
Abstract
Background
Given the differences between malignancies arising from different segments of the colon, specific theranostic biomarkers can be linked to either Right-sided (RCC) or Left-sided colon cancer (LCC).
Objective
Analysis of 65 serum proteins to identify panels of theranostic biomarkers for LCC and RCC.
Methods
Serum levels of 65 immunomodulators were measured in CC, LCC, and RCC patients, as well as healthy controls with the ProcartaPlex Human Immune Monitoring 65-Plex Panel.
Results
IL-27 may be used for early detection in LCC. CD-30 was up-regulated in metastatic CC, BLC was up-regulated in metastatic LCC and CD-40L was down-regulated in metastatic RCC. MDC and MMP-1 were positively associated, while IL-9 and VEGF-A were negatively associated with lymph nodes invasion in CC. Up-regulation of IL-12p70 and MMP-1 in LCC with lymph nodes invasion contrasted with down-regulation of IL-9 and MIP-1beta. IL-23, I-TAC, and SDF-1α were negatively associated with resistant CC to Folfox chemotherapy, and I-TAC was down-regulated in resistant LCC. IL-2 and FGF-2 were down-regulated, while APRIL was up-regulated in resistant RCC.
Conclusions
Our study revealed significant differences in serum protein levels between LCC and RCC emphasizing the importance to explore novel theranostic biomarkers for CC, associated with resistance or sensitivity to chemotherapy.
Introduction
Colon cancer (CC) is the fifth most common cancer worldwide, with an estimated 538 167deaths recorded in 2022 according to GLOBOCAN 2022 (https://gco.iarc.fr/). 1 Approximately 10–15% of CC are diagnosed late, at an advanced stage, contributing to a poorer prognosis. 2 The Clinical, molecular and physiological features differ between LCC (Left-sided Colon Cancer) and RCC (Right-sided Colon Cancer). For instance, certain molecular biomarkers are different between LCC and RCC at various levels such as epigenetic including DNA methylation, transcriptional and post-transcriptional levels, such as miRNA expression. 3 These differences highlight the need for developing distinct biomarkers that can provide insights into the tumor's characteristics, facilitate early diagnosis, and guide therapeutic strategies. Identifying and validating specific biomarkers for LCC and RCC could ultimately lead to improved patient management and personalized treatment approaches, addressing the need for precision medicine. RCC arises in the cecum, ascending colon, hepatic flexure, and transverse colon, while LCC originates in the splenic flexure, descending colon, and sigmoid colon. 3 RCC affects predominantly older female patients and is often associated with advanced tumor stages, larger tumor sizes, and poorer tumor differentiation compared to LCC. 4 Several studies suggest that RCC has a poorer prognosis than that one of LCC. 4
Colonoscopy remains the main diagnostic tool for CC, 5 but it remains invasive, and expensive. 6 While less invasive screening tests, such as fecal occult blood (FOBT) and fecal immunochemical tests (FIT), have been developed, they are still expensive and have limited accuracy in detecting CC. 6 The discovery of new biomarkers is crucial to improving screening methods and predicting treatment responses among LCC and RCC patients.
The tumoral microenvironment (TME) can affect the initiation and progression of CC. 7 Cytokines have been suggested to promote tumor growth, invasion, and metastasis, contributing to various processes involved in the carcinogenesis of CC. 8 Therefore, understanding the impact of dysregulated cytokines, chemokines, growth factors, and soluble receptors on the prognosis of CC and their subtypes, LCC and RCC, is of crucial importance.
To date, a few studies have focused on investigating a panel of serum proteins in cancer patients to identify novel theranostic biomarkers that could help the development of non-invasive diagnostic tests. Recent studies have used Luminex xMAP® technology to detect serum analytes in tumors. Habel et al., reported 21 analytes that were differentially expressed between ovarian cancer patients and healthy controls, along with a second panel of 5 analytes (INF-γ, IL-1β, IL-8, MIP-1β, TNF-α) associated with resistance to chemotherapy. 9 A Tunisian study identified 8 analytes (Eotaxin-3, Fractalkine, IL-16, IL-8, IL-22, MIF, MIP-1α, MIP-1β) as potential biomarkers for the early detection of inflammatory breast cancer (IBC), which could help to prevent metastasis and lymph node invasion. 10 According to CC, only one study has analyzed a panel of 27 cytokines revealing that IL-12(p70), IL-10, IL-1ra, IL-4, IL-6, IL-7, IL-8, G-CSF, and TNFα were higher in RCC and GM-CSF in LCC compared to rectal cancer. 11
This study aimed to analyze a panel of 65 serum analytes to evaluate their potential as theranostic biomarkers and assess their associations with response to treatment, metastasis, and lymph nodes invasion in CC and its subtypes, LCC and RCC.
Materials and methods
Experimental subjects
The study was conducted by the Helsinki II declaration. It was approved by the National Human Research & Ethics Committee of the Salah Azaiez Institute in Tunis (Registration number: ISA/2016/03.1, granted on 22 April 2016). All participants provided written informed consent before their involvement in the study.
Between February 2017 and October 2019, 51 CC patients from the Oncology service of Salah Azaiez Institute (Tunis, Tunisia) were enrolled in this study. The control group consisted of 51 healthy individuals with no personal or family history of CC, matched to cases by gender and age.
Assessment of CC conducted according to the American Cancer Society guidelines. The collected data for CC patients included gender, age at study entry, age at diagnosis of CC, TNM (tumor-node-metastasis) stage and grade, tumor location (RCC and LCC), metastatic status, treatment regimen and response to treatment. The Folfox chemotherapy regimen was given to patients for six months. This regimen consists of Oxaliplatin, Folinate (Leucovorin), and 5-Fluorouracil (5-FU).
The study included patients diagnosed with CC, confirmed through colonoscopy and histopathological analysis. At the time of recruitment, none of the patients had received medical therapy. They were followed for at least 6 months after treatment to evaluate their clinical outcomes, including treatment response, and side effects, using their medical records. Six months after sampling, a review of the patients’ medical records was conducted to assess their response to first-line chemotherapy (CT) based on the FOLFOX regimen. This post-treatment analysis provides insight into the effects of CT on serum protein profiles.
Serum cytokine analysis
Five milliliters of venous blood were collected in a sterile serum coagulation tube. Within 2 h of collection, serum samples underwent centrifugation at 2500 r/min for 20 min at 25°C. Following this initial centrifugation step, the samples were transferred to a microcentrifuge tube and underwent secondary centrifugation at 14,000 r/min for 10 min to remove cell debris and fragments. Serum samples were aliquoted and stored at −80 ◦C until analysis.
Serum samples from each participant were analyzed using the ProcartaPlex Human Immune Monitoring 65- Plex Panel (Invitrogen). The analysis was conducted with the Bio-Plex200 (Bio-Rad Laboratories, Hercules, CA, USA), according to the manufacturer's instructions (https://www.thermofisher.com/order/catalog/product/EPX650-10065-901). The multiplex assay utilized in this study relies on the Millipore MILLIPLEX cytokine array. We quantified the levels of 65 serum proteins: G-CSF, GM-CSF, IFN-α, IFN-γ, IL-1α, IL-1β, IL-2, IL-3, IL-4, IL-5, IL-6, IL-7, IL-8, IL-9, IL-10, IL-12p70, IL-13, IL-15, IL-16, IL-17A, IL-18, IL-20, IL-21, IL-22, IL-23, IL-27, IL-31, LIF, M-CSF, MIF, TNF-α, TN F-β, TSLP, APRIL, BLC, EN A-78, eotaxin-1, eotaxin −2, eotaxin −3, fractalkines, GROα, IP-10, I-TAC, MCP-1, MCP-2, MCP-3, MDC, MIG, MIP-1α, MIP-1β, MIP-3α, and SDF-1α, FGF-2, HGF, MMP-1, NGF-β, SCF, VEGF-A, BAFF, CD30, CD40L, IL-2R, TNF-RII, TRAIL, and TWEAK. Table 1 lists the 65 serum proteins mentioned above.
The 65 serum proteins included in our study.
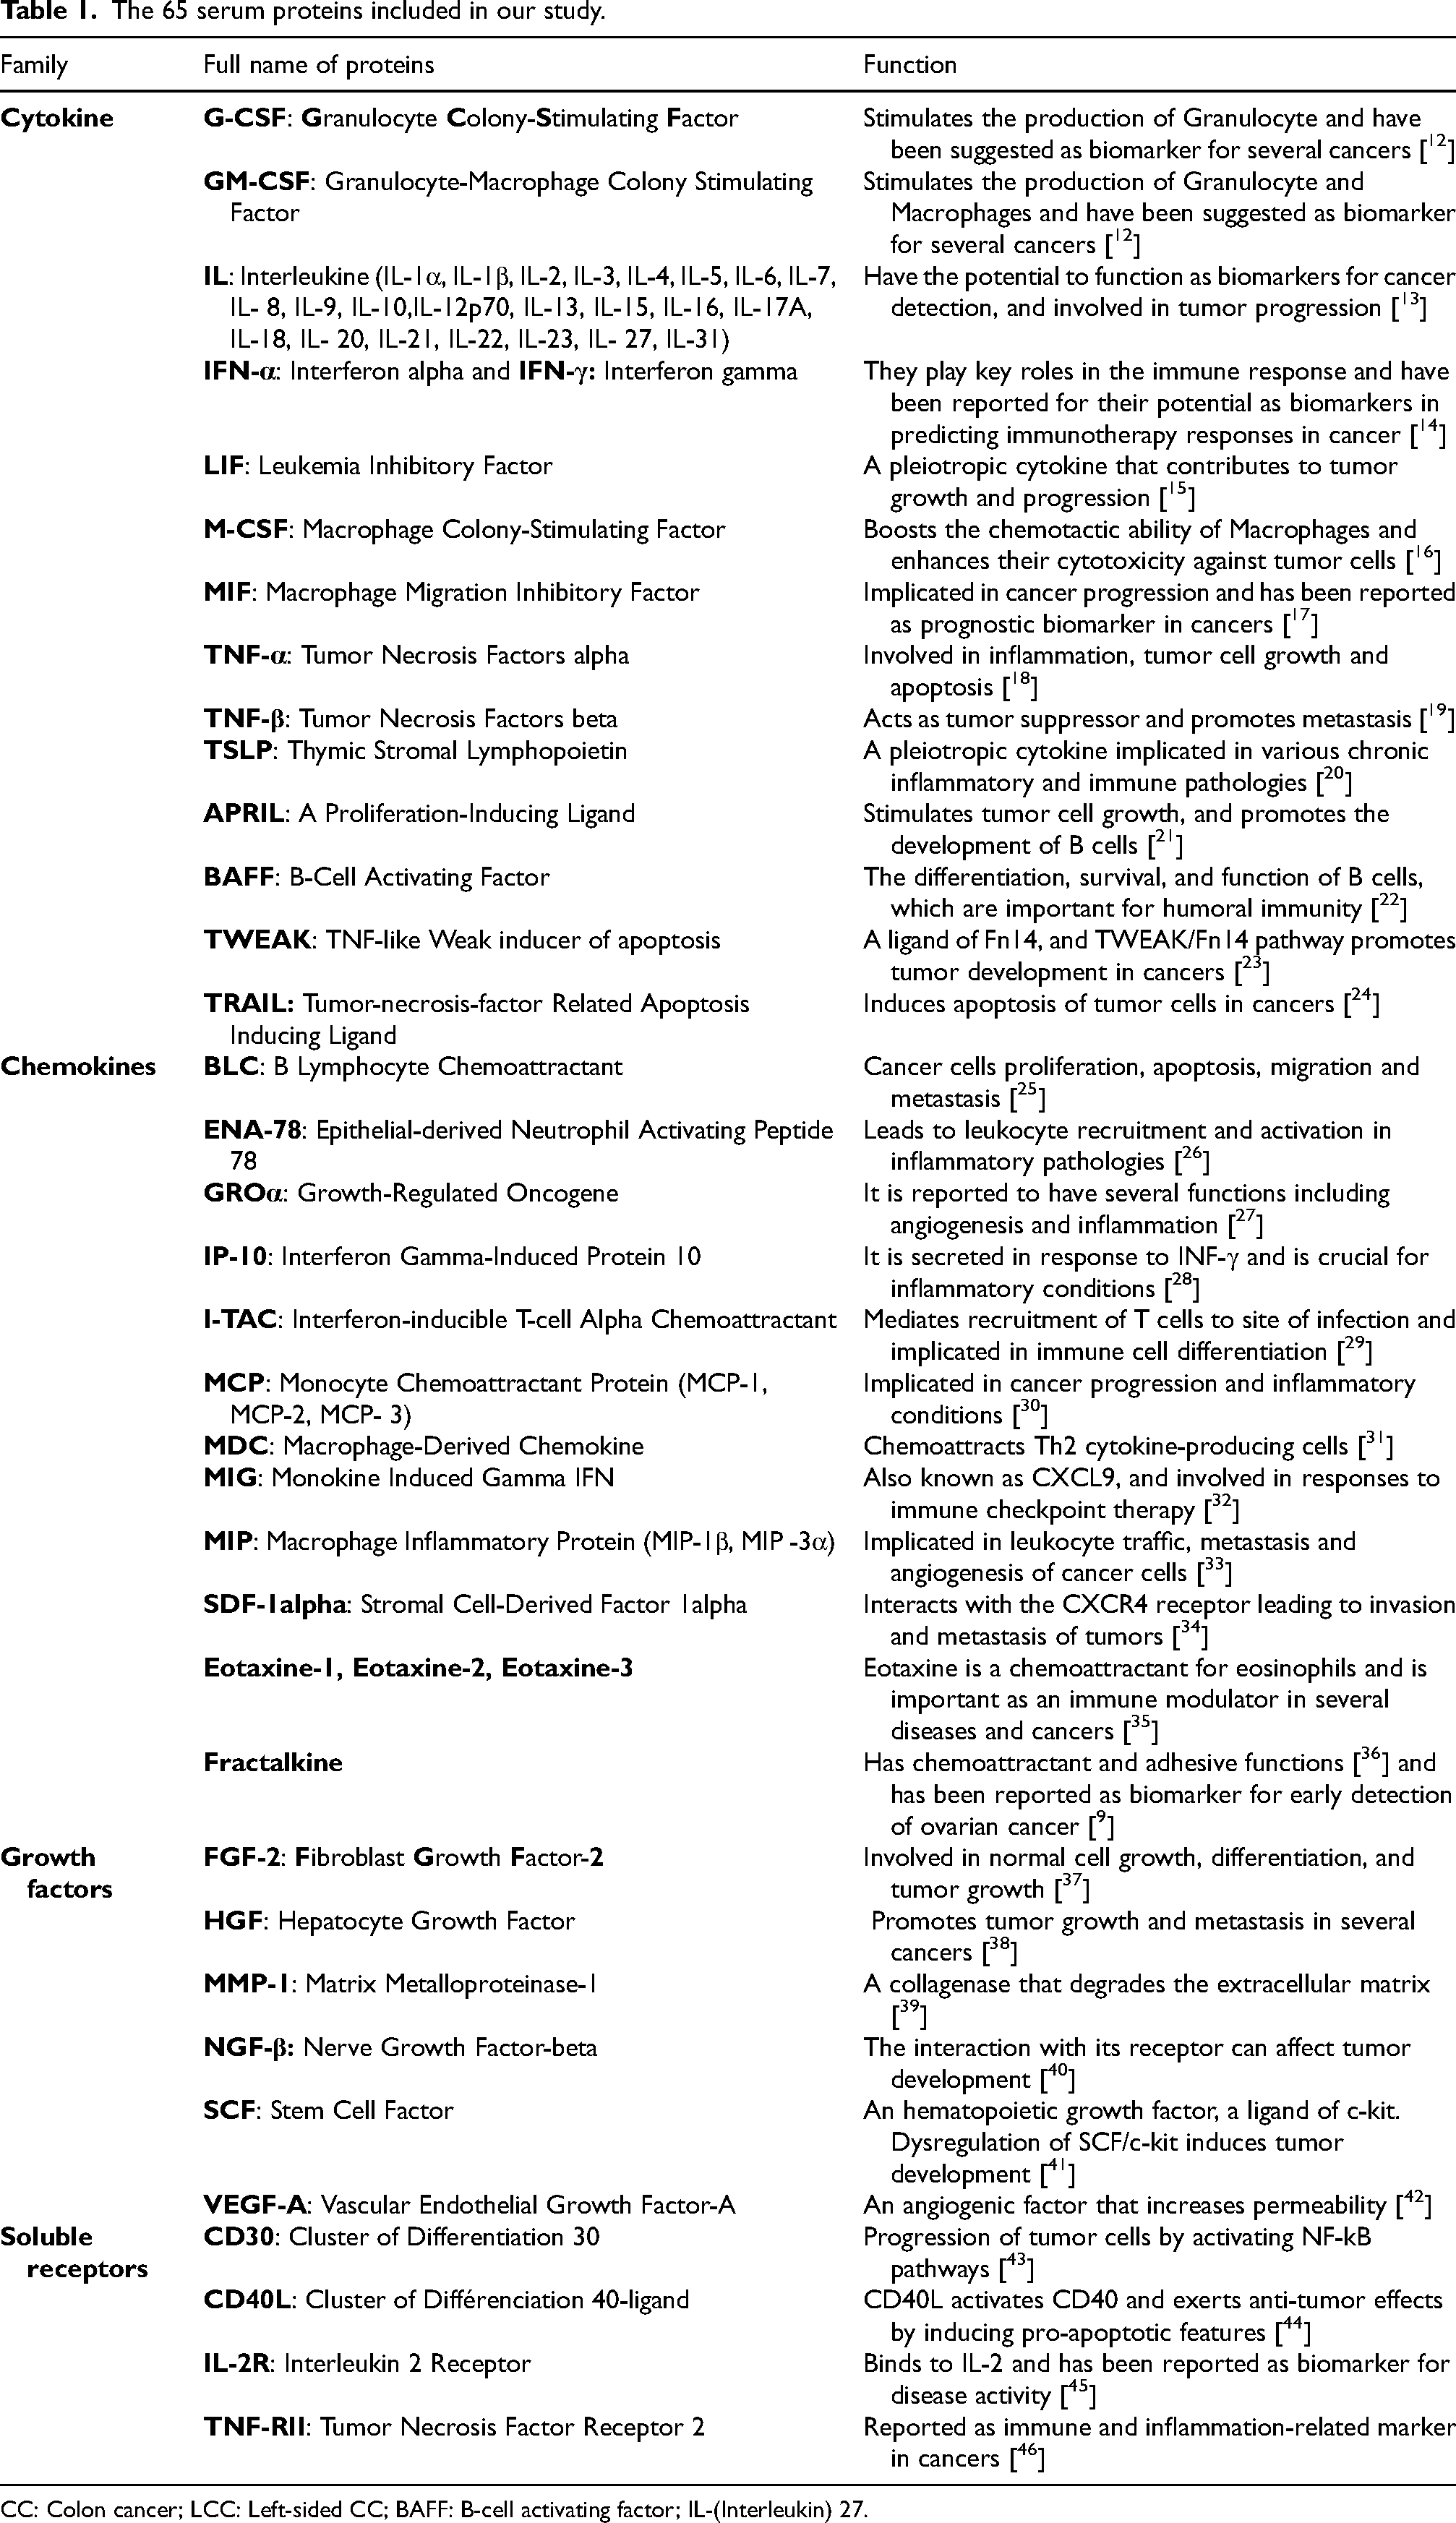
CC: Colon cancer; LCC: Left-sided CC; BAFF: B-cell activating factor; IL-(Interleukin) 27.
Statistical analysis
Statistical analysis was conducted using R software (R version 4.3.2). Graphs were generated with GraphPad Prism 10.1.0 (GraphPad Software, San Diego, CA, USA). The significance was considered at a p-value less than 0.05. The Mann-Whitney U test was employed to examine differences in means and assess intergroup significance. Additionally, for molecules that were differentially expressed between the compared groups, a receiver operating characteristics (ROC) curve analysis was performed. The area under curves (AUC) was calculated, along with sensitivity at 95% specificity, to evaluate the diagnostic performance of these molecules.
Results
Study participants
To identify serum immune mediator profiles associated with CC and its subtypes LCC and RCC, we compared the serum protein levels of 65 analytes between patients and healthy controls.
The clinical and pathological data are presented in Table 2. A total of 51 CC patients and 51 healthy controls were included in this study. Among the CC patients, nineteen (37.25%) were male and 32 (62.75%) were female, aged between 23 and 84 years. The mean age of CC patients was 60.51 ± 12.57 (SD), with a medium age of 61 years. The mean body mass index (BMI) is 24.69 ± 4.10 (SD), with a median BMI of 24.3. The BMI ranged from 15.5 to 33.23. According to the WHO 2000 BMI classification, 3 (5.88%) of our patients were underweight, 20 (39.22%) had a normal weight and 13 (25,49%) were overweight.
Clinical data of CC patients and healthy controls.
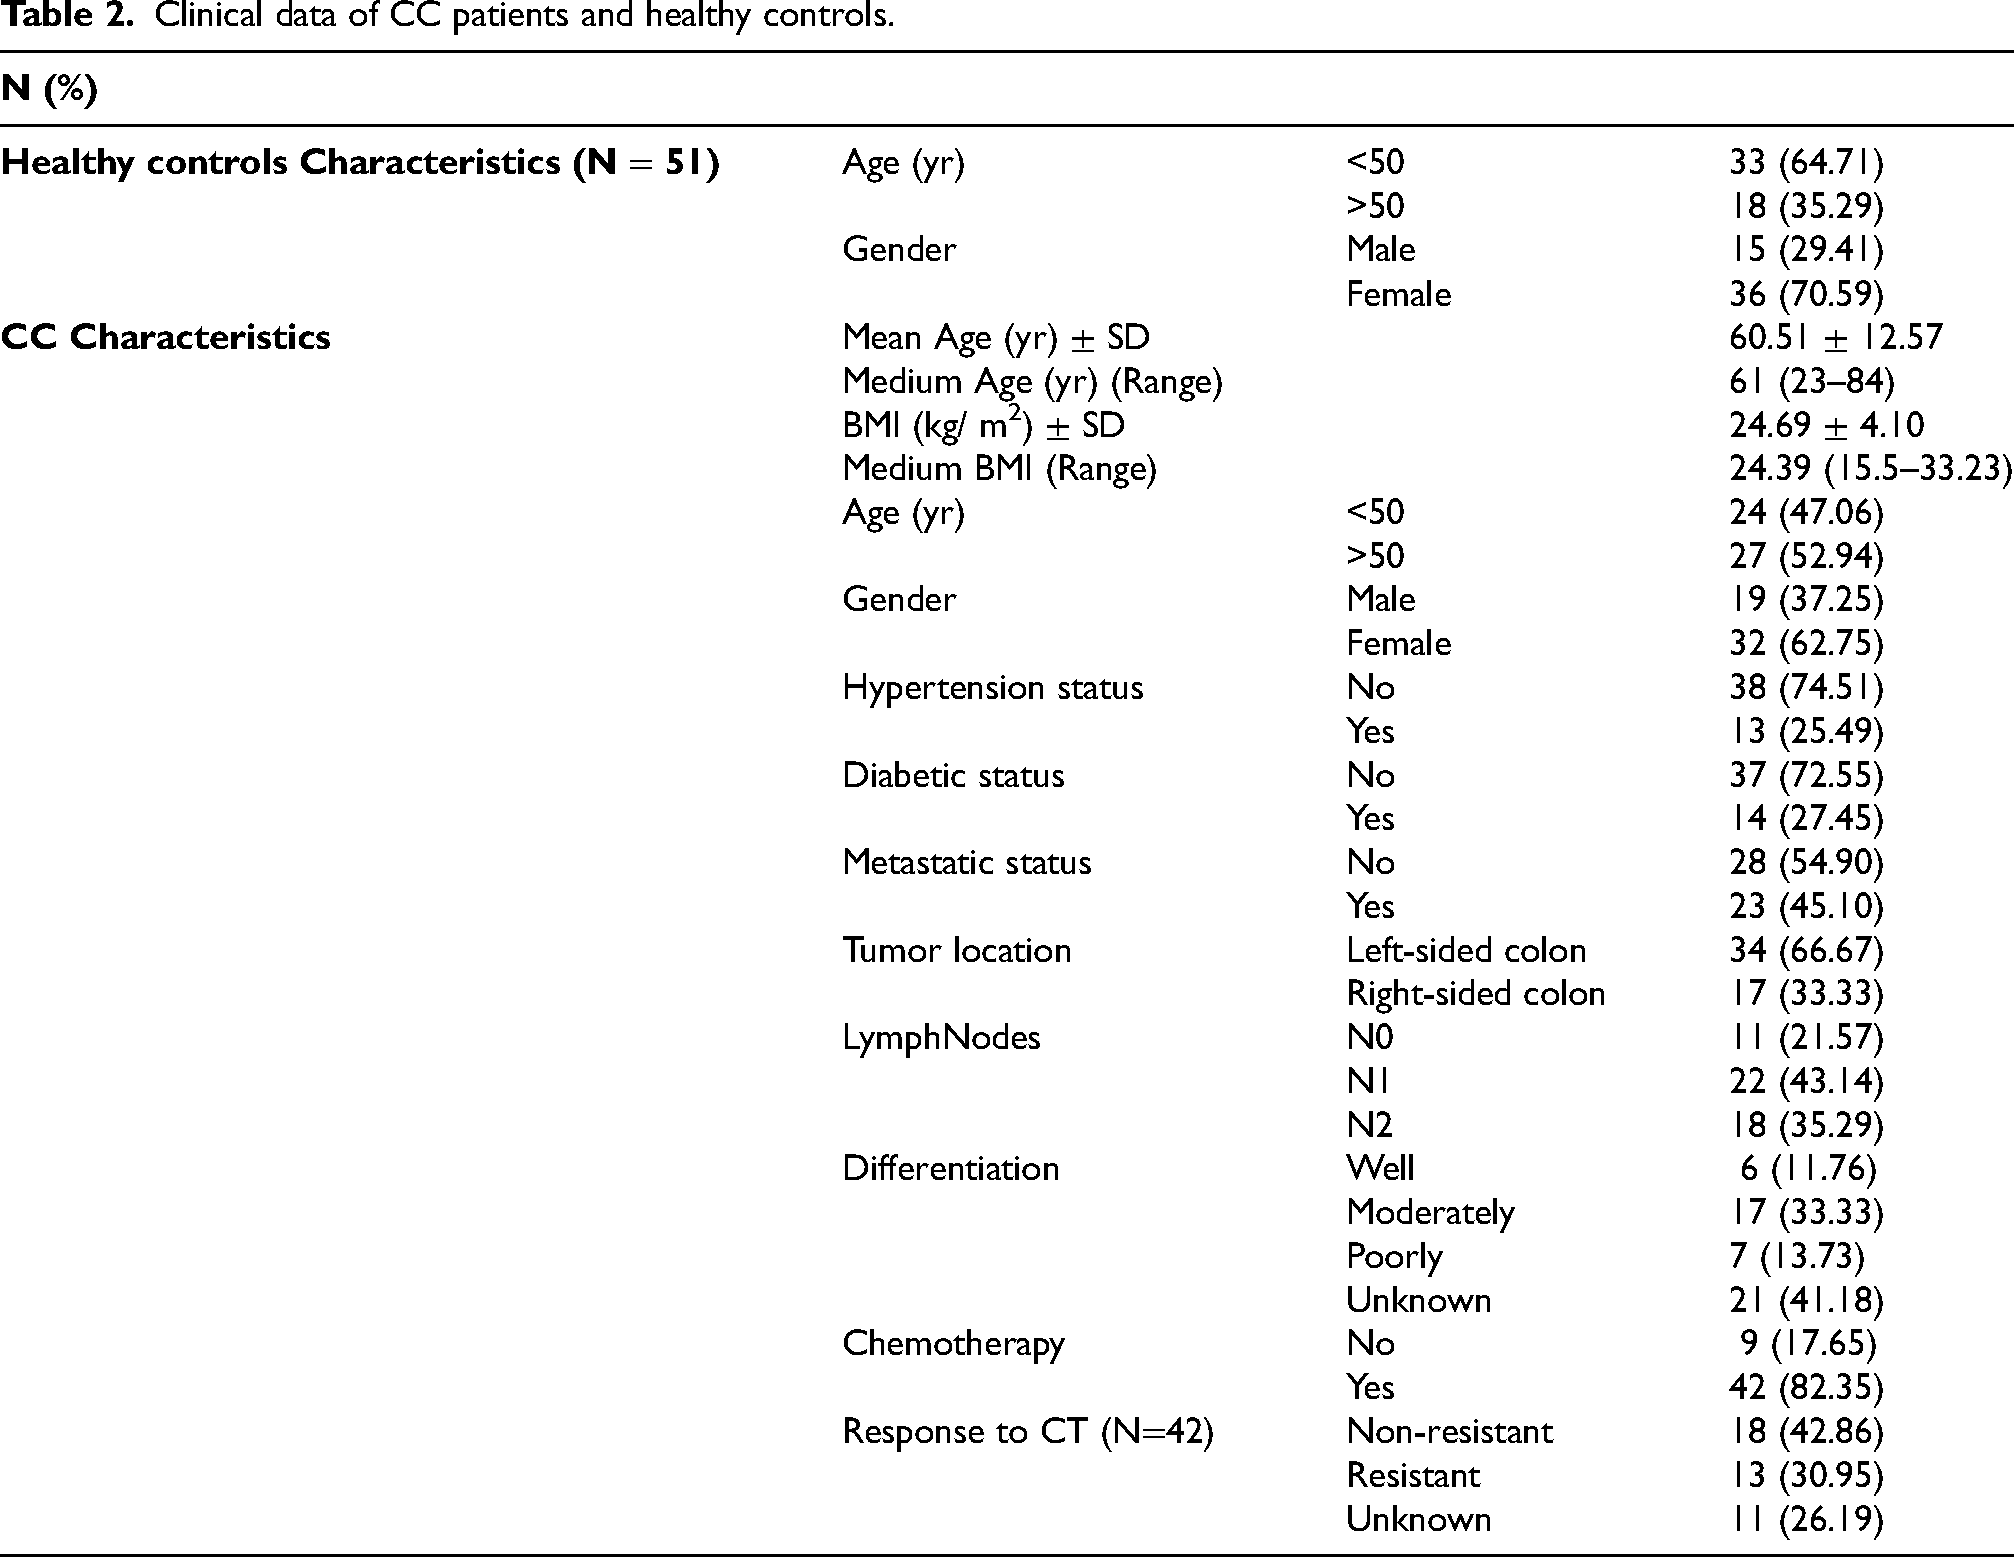
Tumor staging was graded according to the American Joint Committee on Cancer (AJCC) TNM classification of malignant tumors. Among the patients, 40 (78.43%) had lymph node invasion, while 11 (21.57%) did not. Additionally, 23 (45.10%) had metastasis, and 28 (54.90%) had not yet developed metastasis. Tumor differentiation analysis revealed that 7 (13.73%) were poorly differentiated, 17 (33.33%) were moderately differentiated, and 6 (11.76%) were well differentiated. According to tumor location, cases with RCC accounted for 17 (33.33%) and cases with LCC accounted for 34 (66.67%). Moreover, we evaluated the levels of the 65 analytes post-chemotherapy treatment. Out of the total, 42 (82.35%) of CC patients underwent CT, among whom 13 (30.95%) developed resistance and 18 (42.86%) were not resistant. Among RCC patients, 7 (41.18%) developed metastasis and 10 (58.82%) did not. Fourteen (82.35%) had lymph nodes invasion, with 8 (57.14%) classified as N1 and 6 (42.86%) as N2. Only 3 (17.65%) have no lymph node invasion. In addition, 4 (23.53%) were resistant to CT, and 7 (41,18%) were not resistant. For LCC patients, 16 (47.06%) developed metastasis, and 18 (52.94%) did not. Twenty-six (76.47%) had lymph nodes invasion, with 15 (57.69%) classified as N1 and 11 (42.31%) as N2. Meanwhile, 8 (23.53%) had no lymph node invasion. According to response to treatment, 9 (26.47%) were resistant and 11 (32,35%) were not resistant to CT.
Analytes associated with the development of cc, LCC and RCC
Our results revealed that one cytokine, BAFF (B-cell Activating Factor), was differentially expressed between CC patients and healthy controls. BAFF (p = 0.038) was down-regulated in the sera of CC patients compared to those of healthy controls (Table 3, Figure 1(a)). The ROC curves analysis revealed the discriminative potential of CC, with an AUC value of 0.63 (Figure 2(a)).
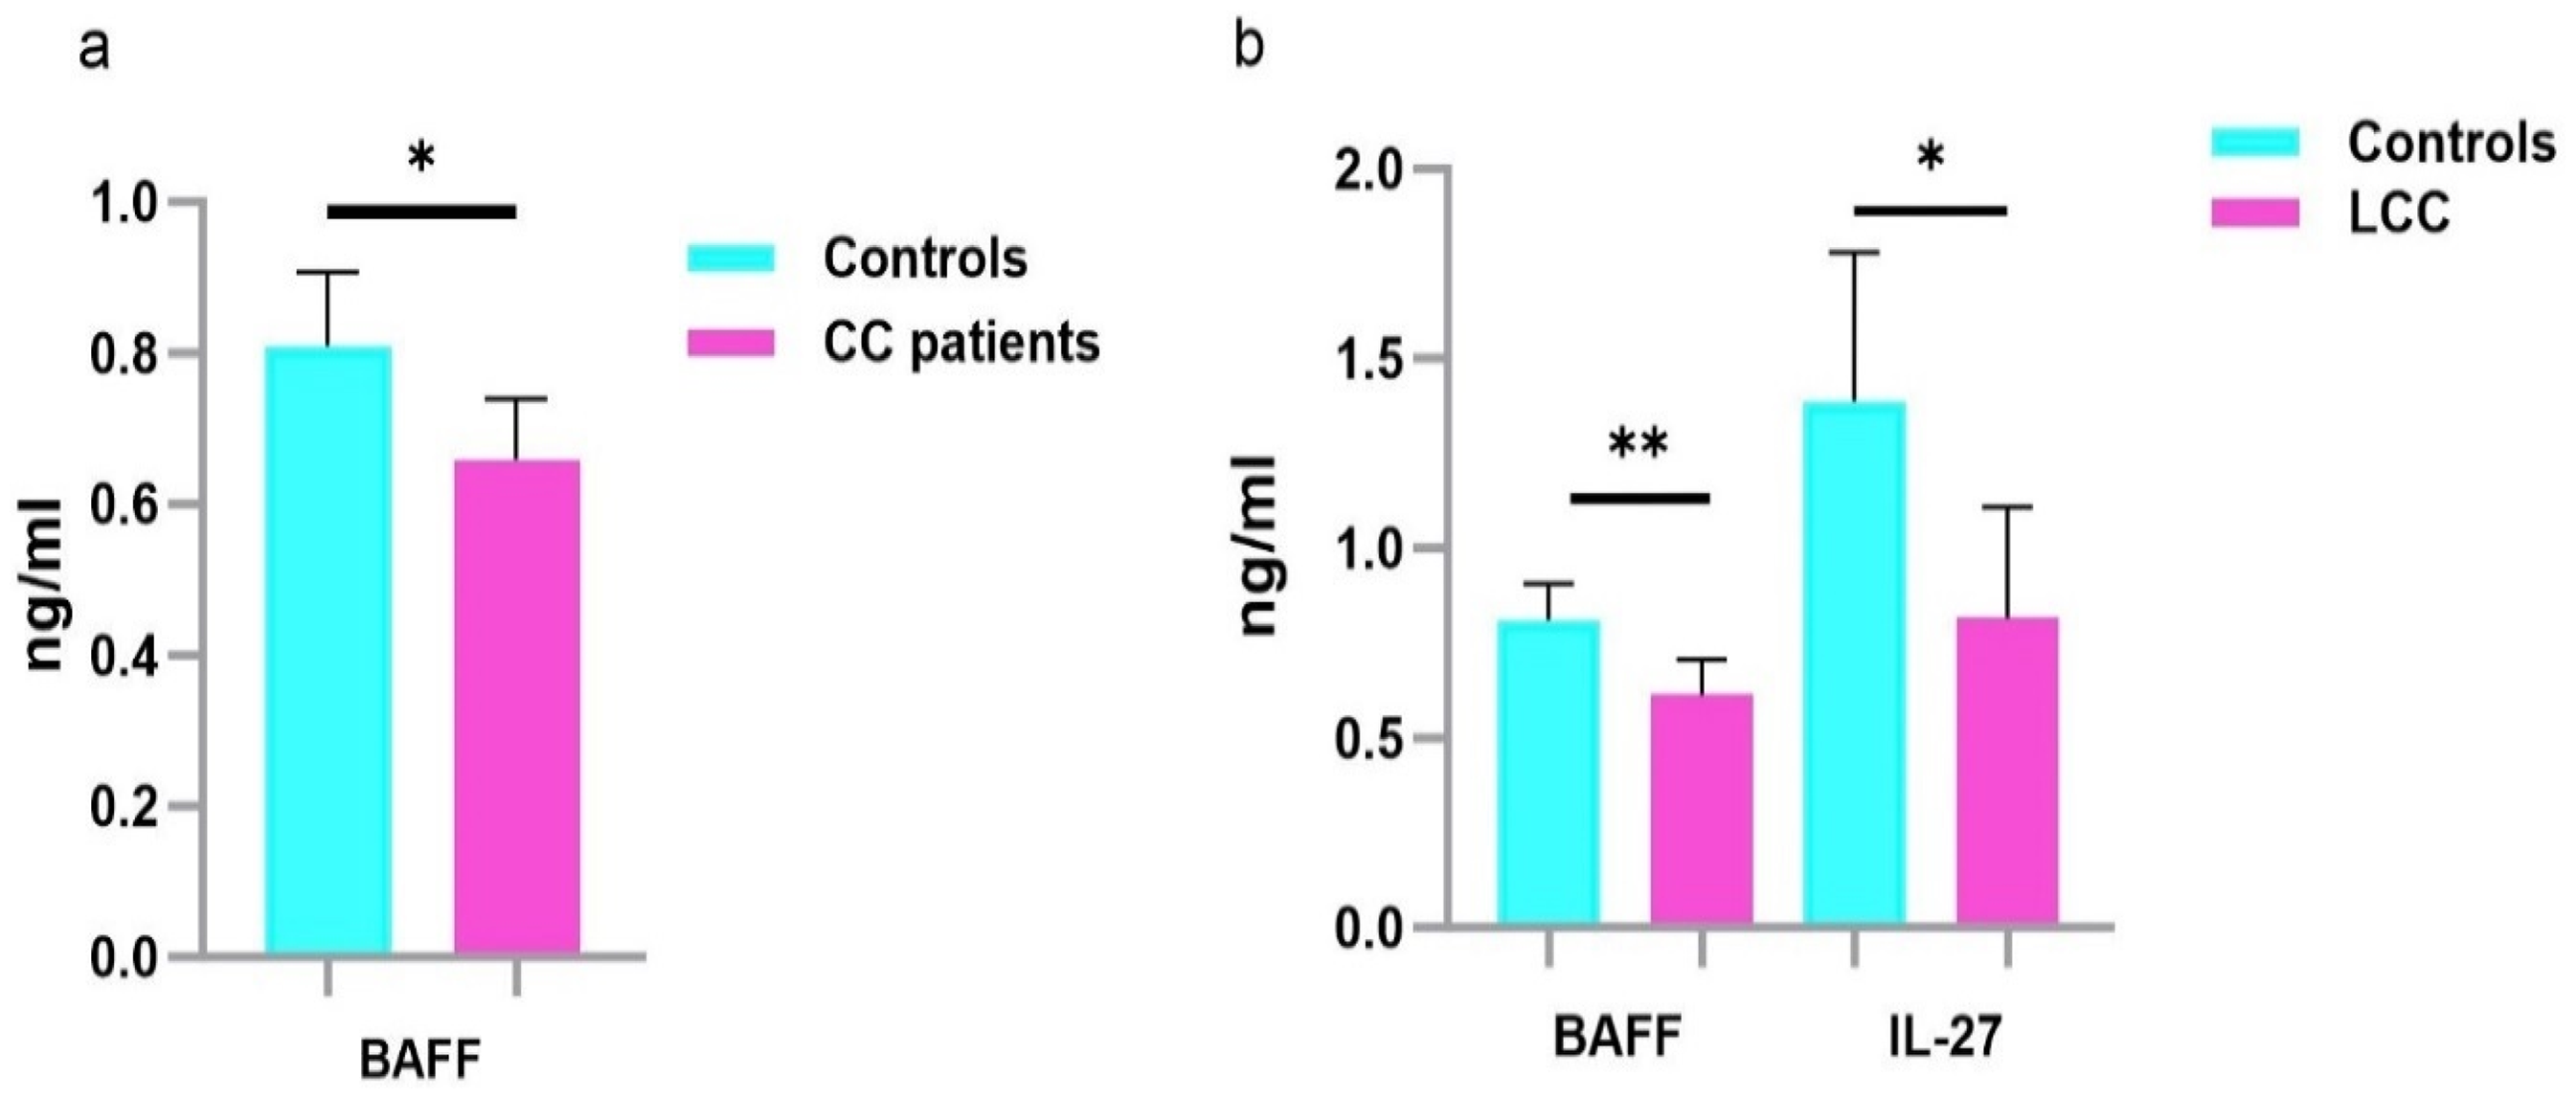
Serum protein levels in CC, LCC patients and healthy controls. Results are expressed as means values in ng/ml. a. Analysis of serum cytokine levels in CC and healthy controls indicates that BAFF was downregulated in the sera of CC compared to those of healthy controls. b. Analysis of serum cytokine levels in LCC and healthy controls indicate that BAFF and IL-27 were down-regulated in the sera of LCC compared to those of healthy controls. P -values represent statistically significant cytokines serum level differences at baseline in CC and LCC versus healthy controls are in black; ** P < 0.005; *P < 0.05.
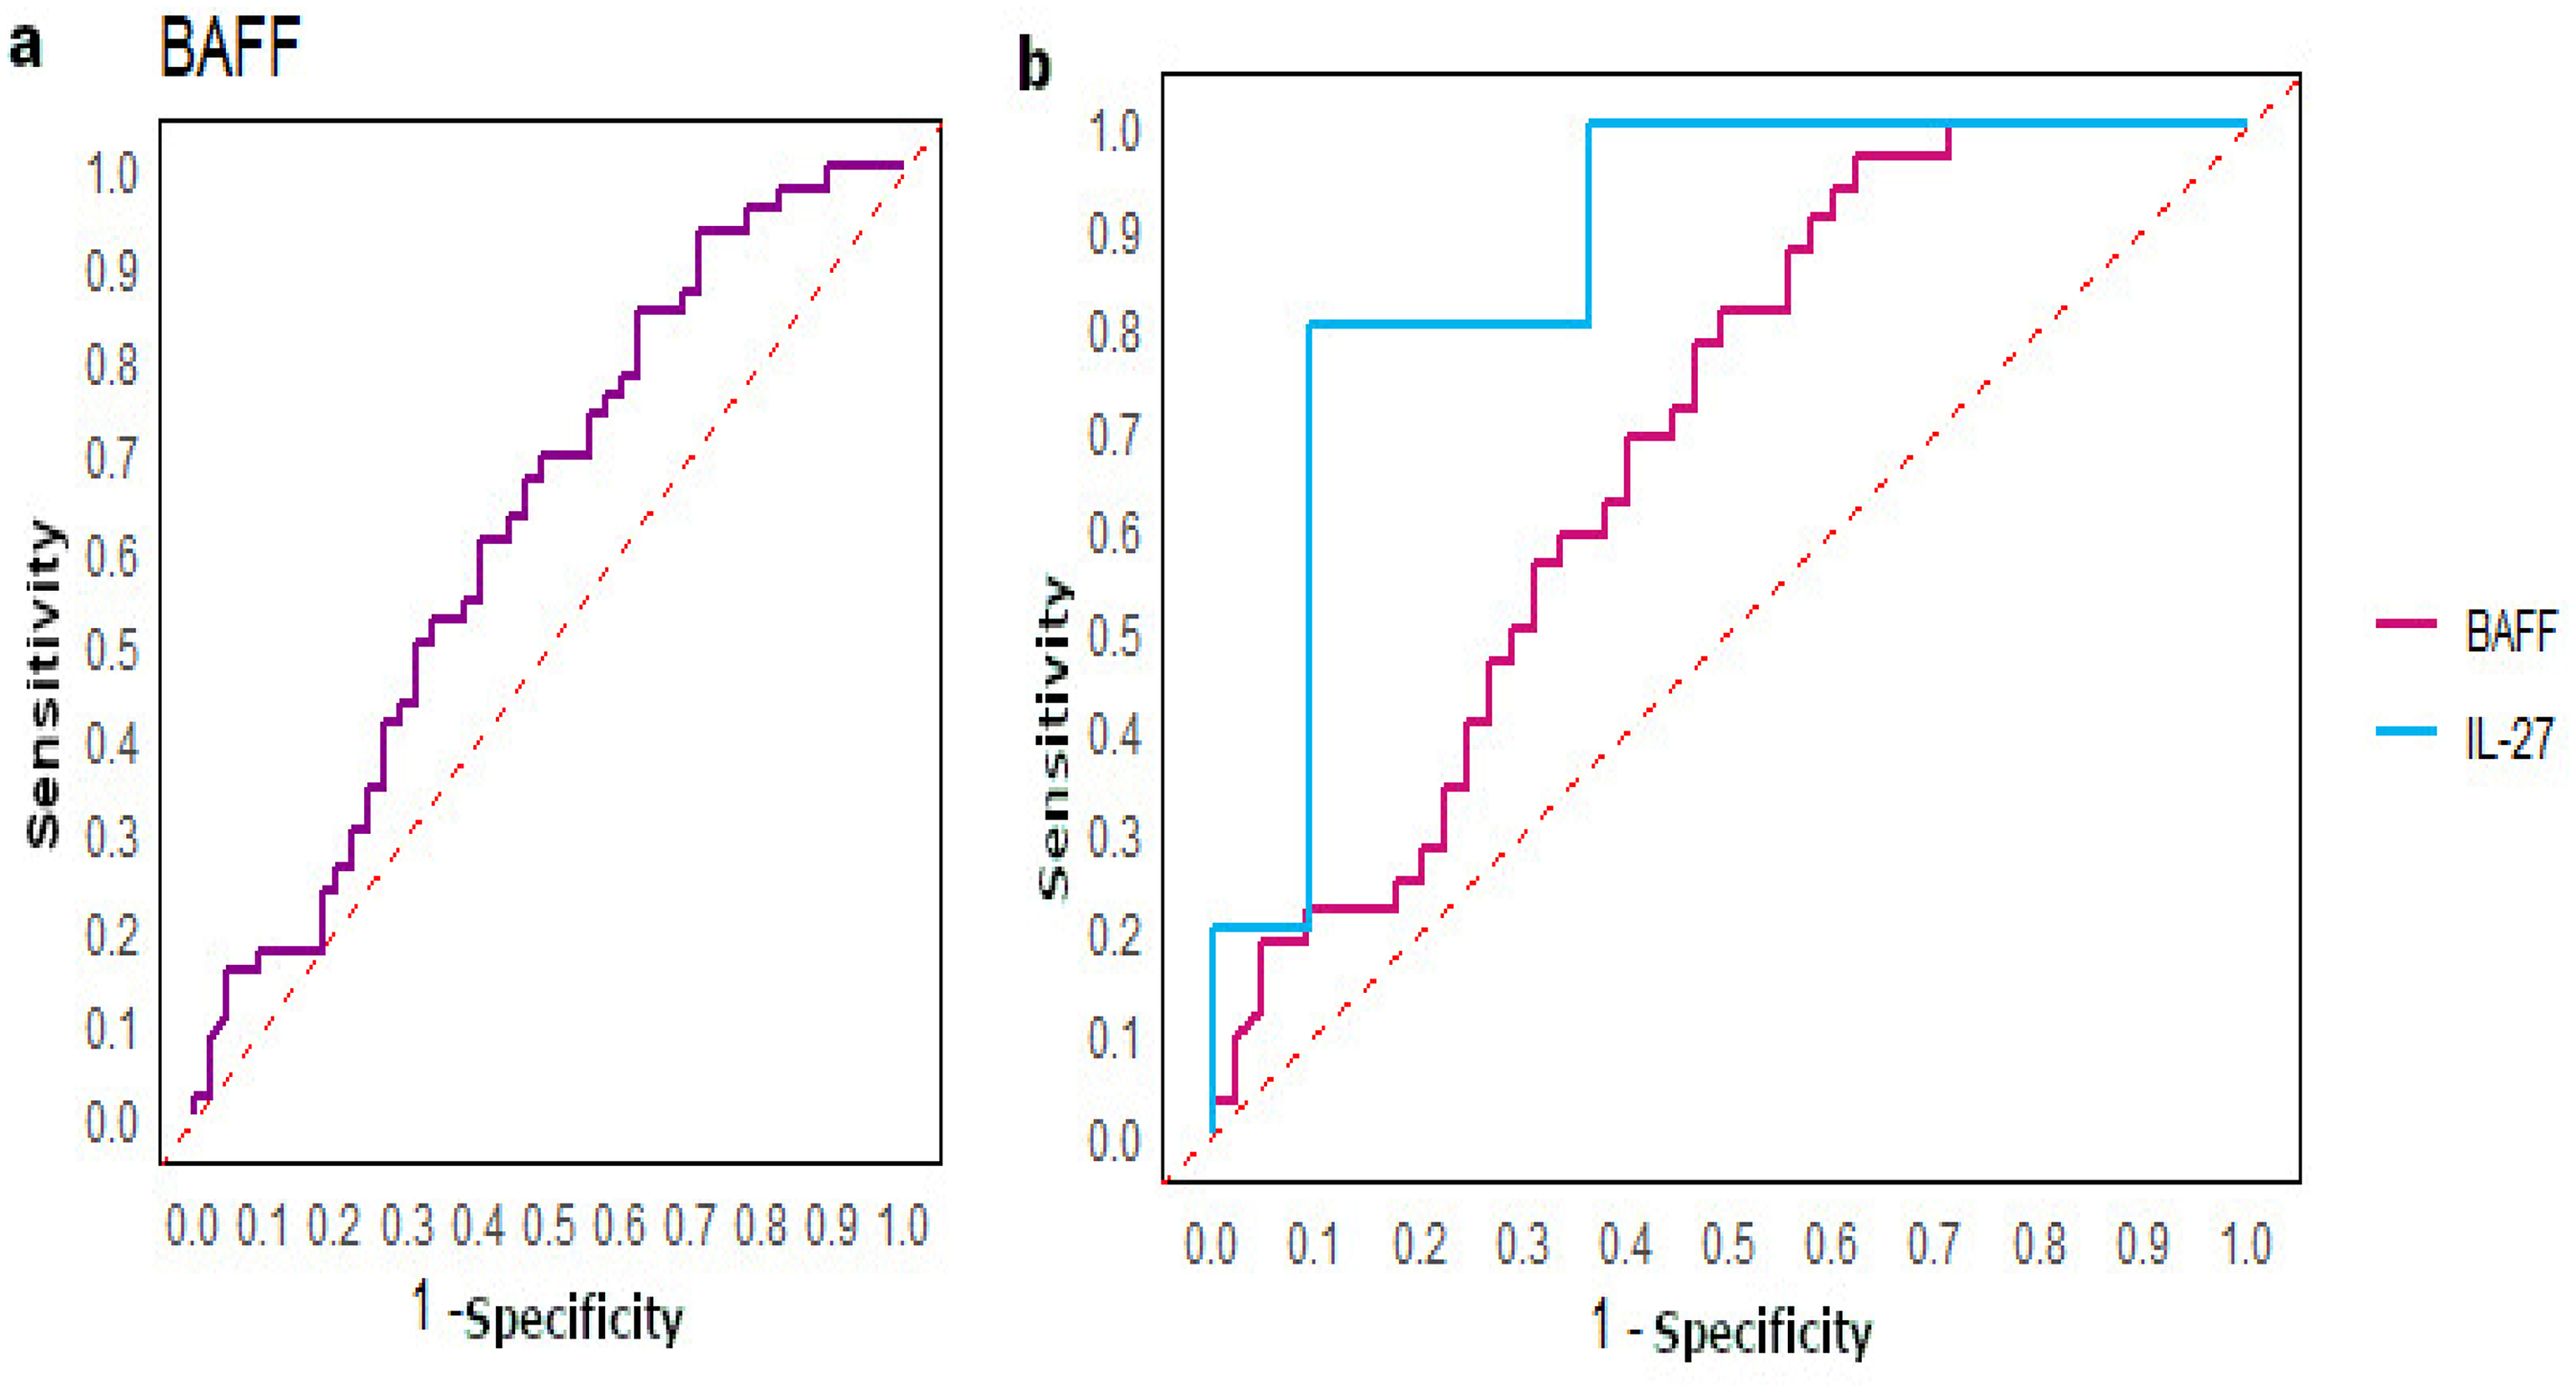
ROC curves. a. Analysis of the ROC curve was performed between CC and healthy controls for BAFF and we found a good AUC (0.63). b. Analysis of the ROC curve was performed between LCC, and healthy controls and we found good AUC with 0.69 for BAFF and 0.87 for IL-27.
Serum proteins differentially expressed between CC, LCC and RCC patients and healthy controls.
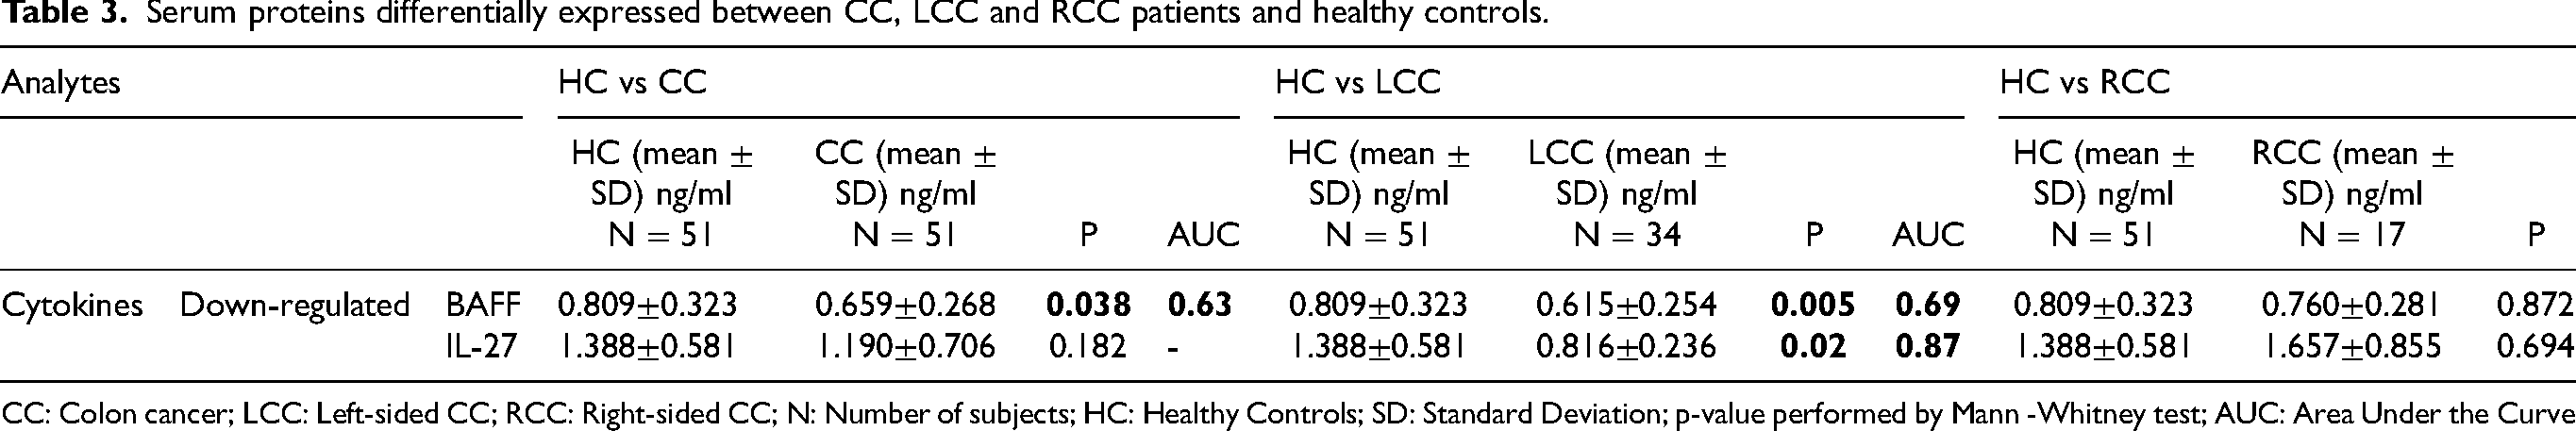
CC: Colon cancer; LCC: Left-sided CC; RCC: Right-sided CC; N: Number of subjects; HC: Healthy Controls; SD: Standard Deviation; p-value performed by Mann -Whitney test; AUC: Area Under the Curve
According to LCC, 2 cytokines were significantly less expressed in LCC patients compared to healthy controls, including BAFF (p = 0.005) and IL-27 (p = 0.02) (Table 3, Figure 1(b)). The ROC curve analysis revealed that BAFF had an AUC value of 0.69, while IL-27 had a notably higher AUC value of 0.87, suggesting its potential clinical utility (Figure 2(b)).
However, we didn't find any significant associations among RCC patients and controls (Table 3).
Analytes associated with the development of metastasis in cc, LCC and RCC patients
Serum protein levels were compared among CC patients, and including its subtypes LCC and RCC patients, stratified according to the development of metastasis. The soluble receptor CD-30 (p = 0.028) was significantly differentially expressed between metastatic and non-metastatic CC patients, being up-regulated in metastatic CC patients (Table 4, Figure 3(a)). The ROC curve analysis revealed an AUC value 0.68 for CD-30 (Figure 4(a))
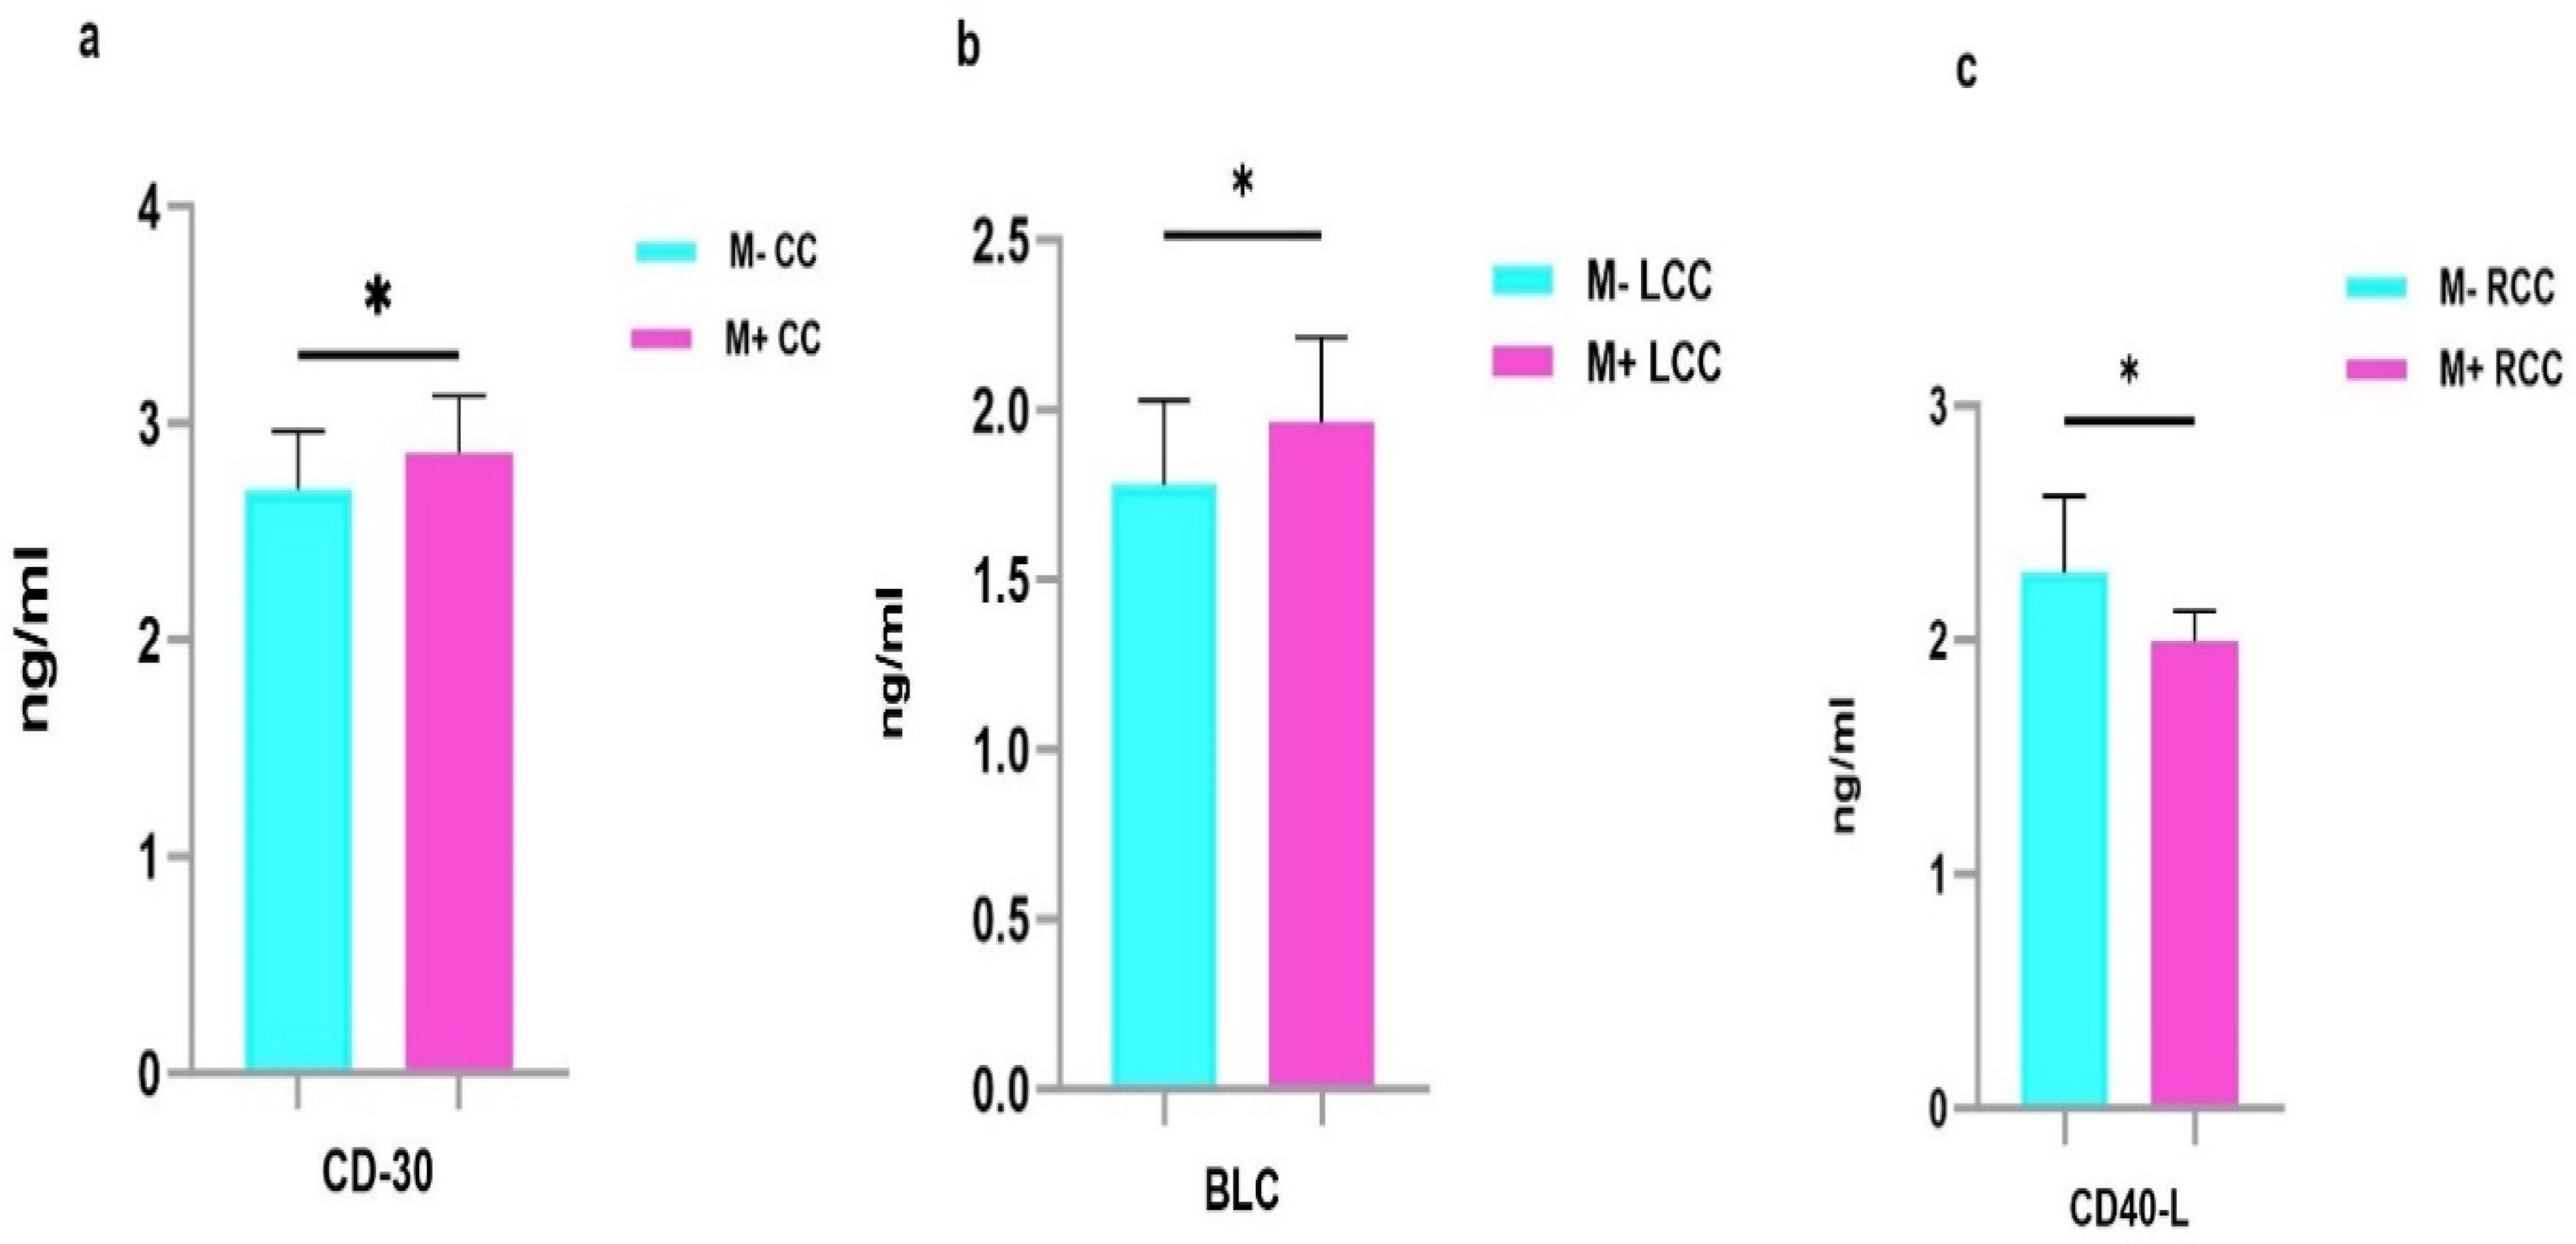
Serum protein levels in metastatic and non-metastatic CC, LCC and RCC patients. Results are expressed as means values in ng/ml. a. Analysis revealed that CD-30 was up-regulated in the sera of M+ CC compared to M- CC. b. BLC was up-regulated in the sera of M+ LCC compared to M- LCC. c. Analysis revealed that CD40-L was down-regulated in the sera of M+ RCC compared to M- RCC. P-values represent statistically significant cytokines serum level differences at baseline in metastatic versus non-metastatic patients are in black; *P < 0.05.
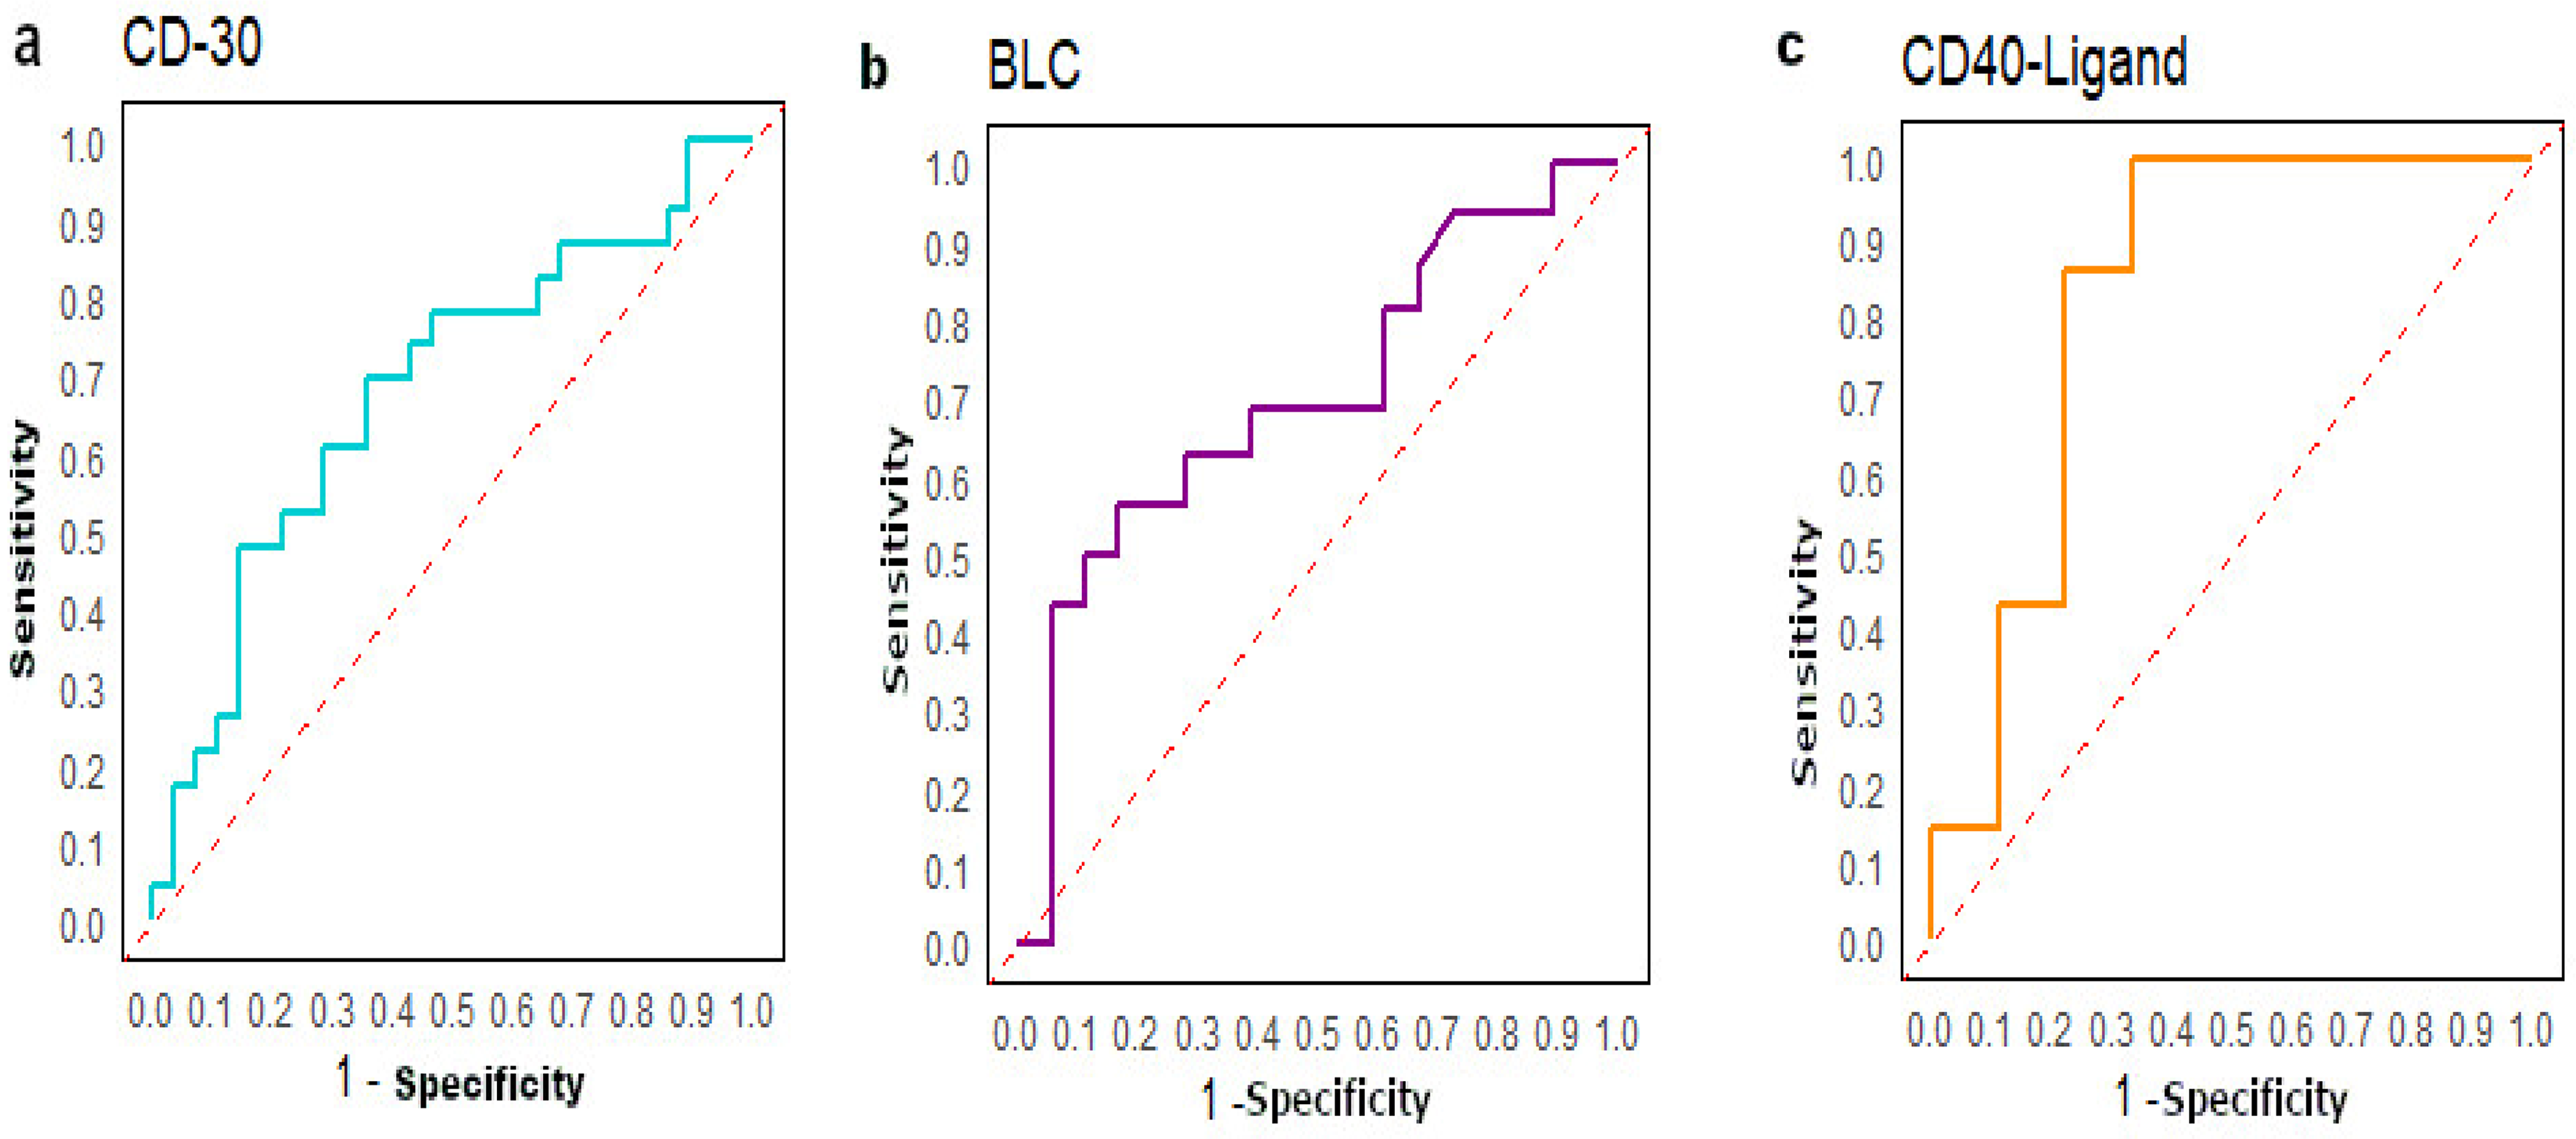
ROC curves. a. Analysis of the ROC curve was performed between M+ and M- CC. We found a good AUC for CD-30 (AUC=0.68). b. Analysis of the ROC curve was performed between M+ LCC and M- LCC and we found a good AUC for BLC (AUC=0.70). c. Analysis of the ROC curve was performed between M+ RCC and M- RCC and we found a good AUC for CD40-L (AUC=0.83).
Serum proteins differentially expressed between metastatic and non-metastatic CC, LCC and RCC patients.
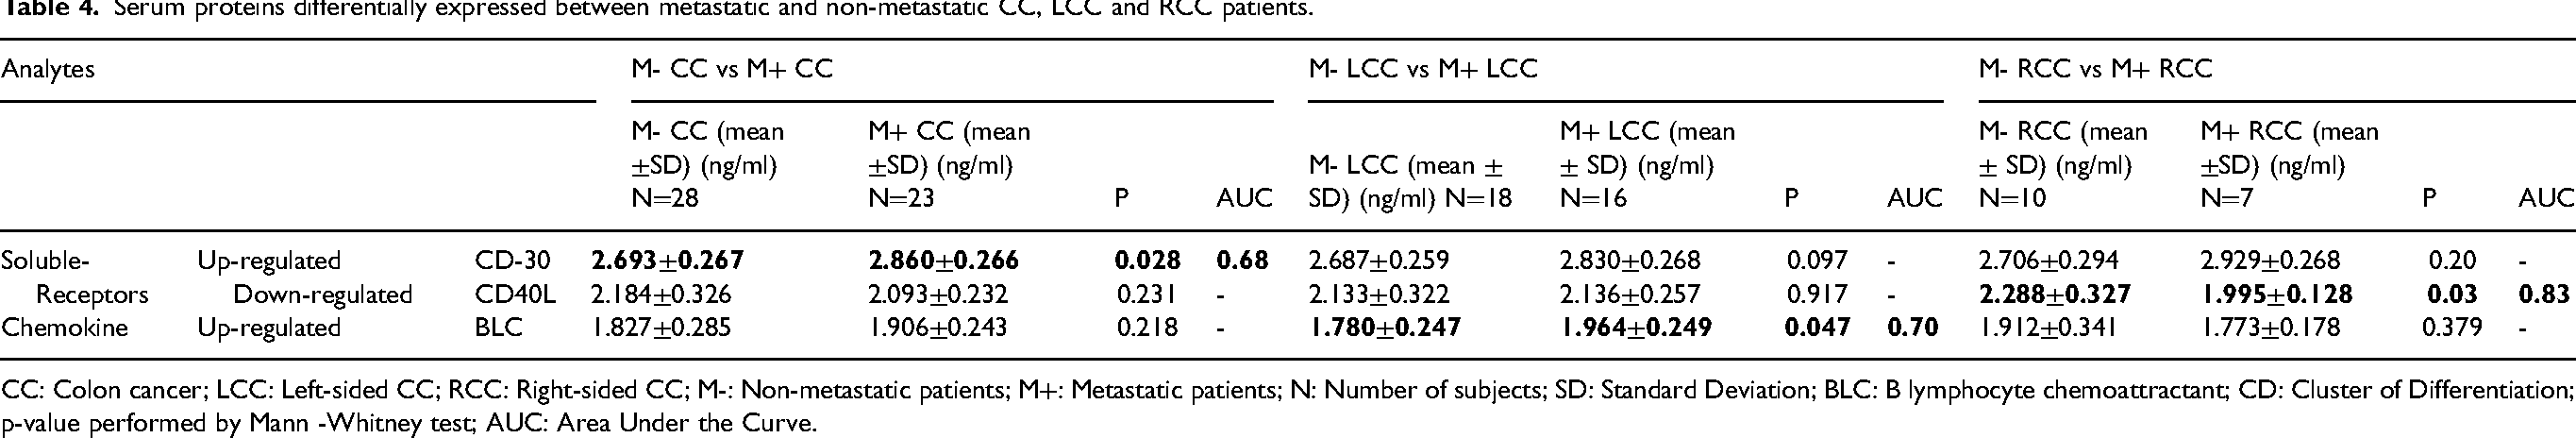
CC: Colon cancer; LCC: Left-sided CC; RCC: Right-sided CC; M-: Non-metastatic patients; M+: Metastatic patients; N: Number of subjects; SD: Standard Deviation; BLC: B lymphocyte chemoattractant; CD: Cluster of Differentiation; p-value performed by Mann -Whitney test; AUC: Area Under the Curve.
According to LCC, the chemokine BLC (B Lymphocyte Chemoattractant) (p = 0.047) showed significantly higher expression in metastatic LCC patients compared to those non-metastatic. (Table 4, Figure 3(b)). The AUC value for BLC was 0.70, indication acceptable discriminative power (Figure 4(b)). For RCC, the soluble receptor CD-40L (p = 0.03) was down-regulated in metastatic RCC patients (Table 4, Figure 3(c)). The AUC value of CD-40L was the highest with 0.83, suggesting its utility as a potential biomarker to identify RCC patients at higher risk of developing metastasis (Figure 4(c)).
Analytes associated with the lymph nodes invasion in cc, LCC and RCC patients
Stratified analysis among CC, LCC and RCC patients according to lymph nodes invasion was performed.
For CC patients, 4 analytes (1 cytokine, 1 chemokine and 2 growth factors) were differentially expressed between CC patients with lymph nodes invasion and those without it. The cytokine IL-9 (p = 0.011) was down-regulated in the sera of CC patients with lymph nodes invasion. In contrast, the chemokine MDC (Macrophage-Derived Chemokine) (p = 0.02) was up-regulated in the sera of CC patients with lymph nodes invasion. Additionally, 2 growth factors showed differential expression including MMP-1(Matrix Metalloproteinase-1) (p = 0.039), highly expressed, and VEGF-A (Vascular Endothelial Growth Factor A) (p = 0.029) less expressed in CC patients with lymph nodes invasion (Table 5, Figure 5(a)). The ROC curves analysis revealed good AUC values for all the differentially expressed analytes. The greatest AUC value was observed for IL-9 (AUC = 1), followed by MDC/CCL22 (AUC = 0.73), VEGF-A (AUC = 0.72) and MMP-1 (AUC = 0.70) (Figure 6(a)).
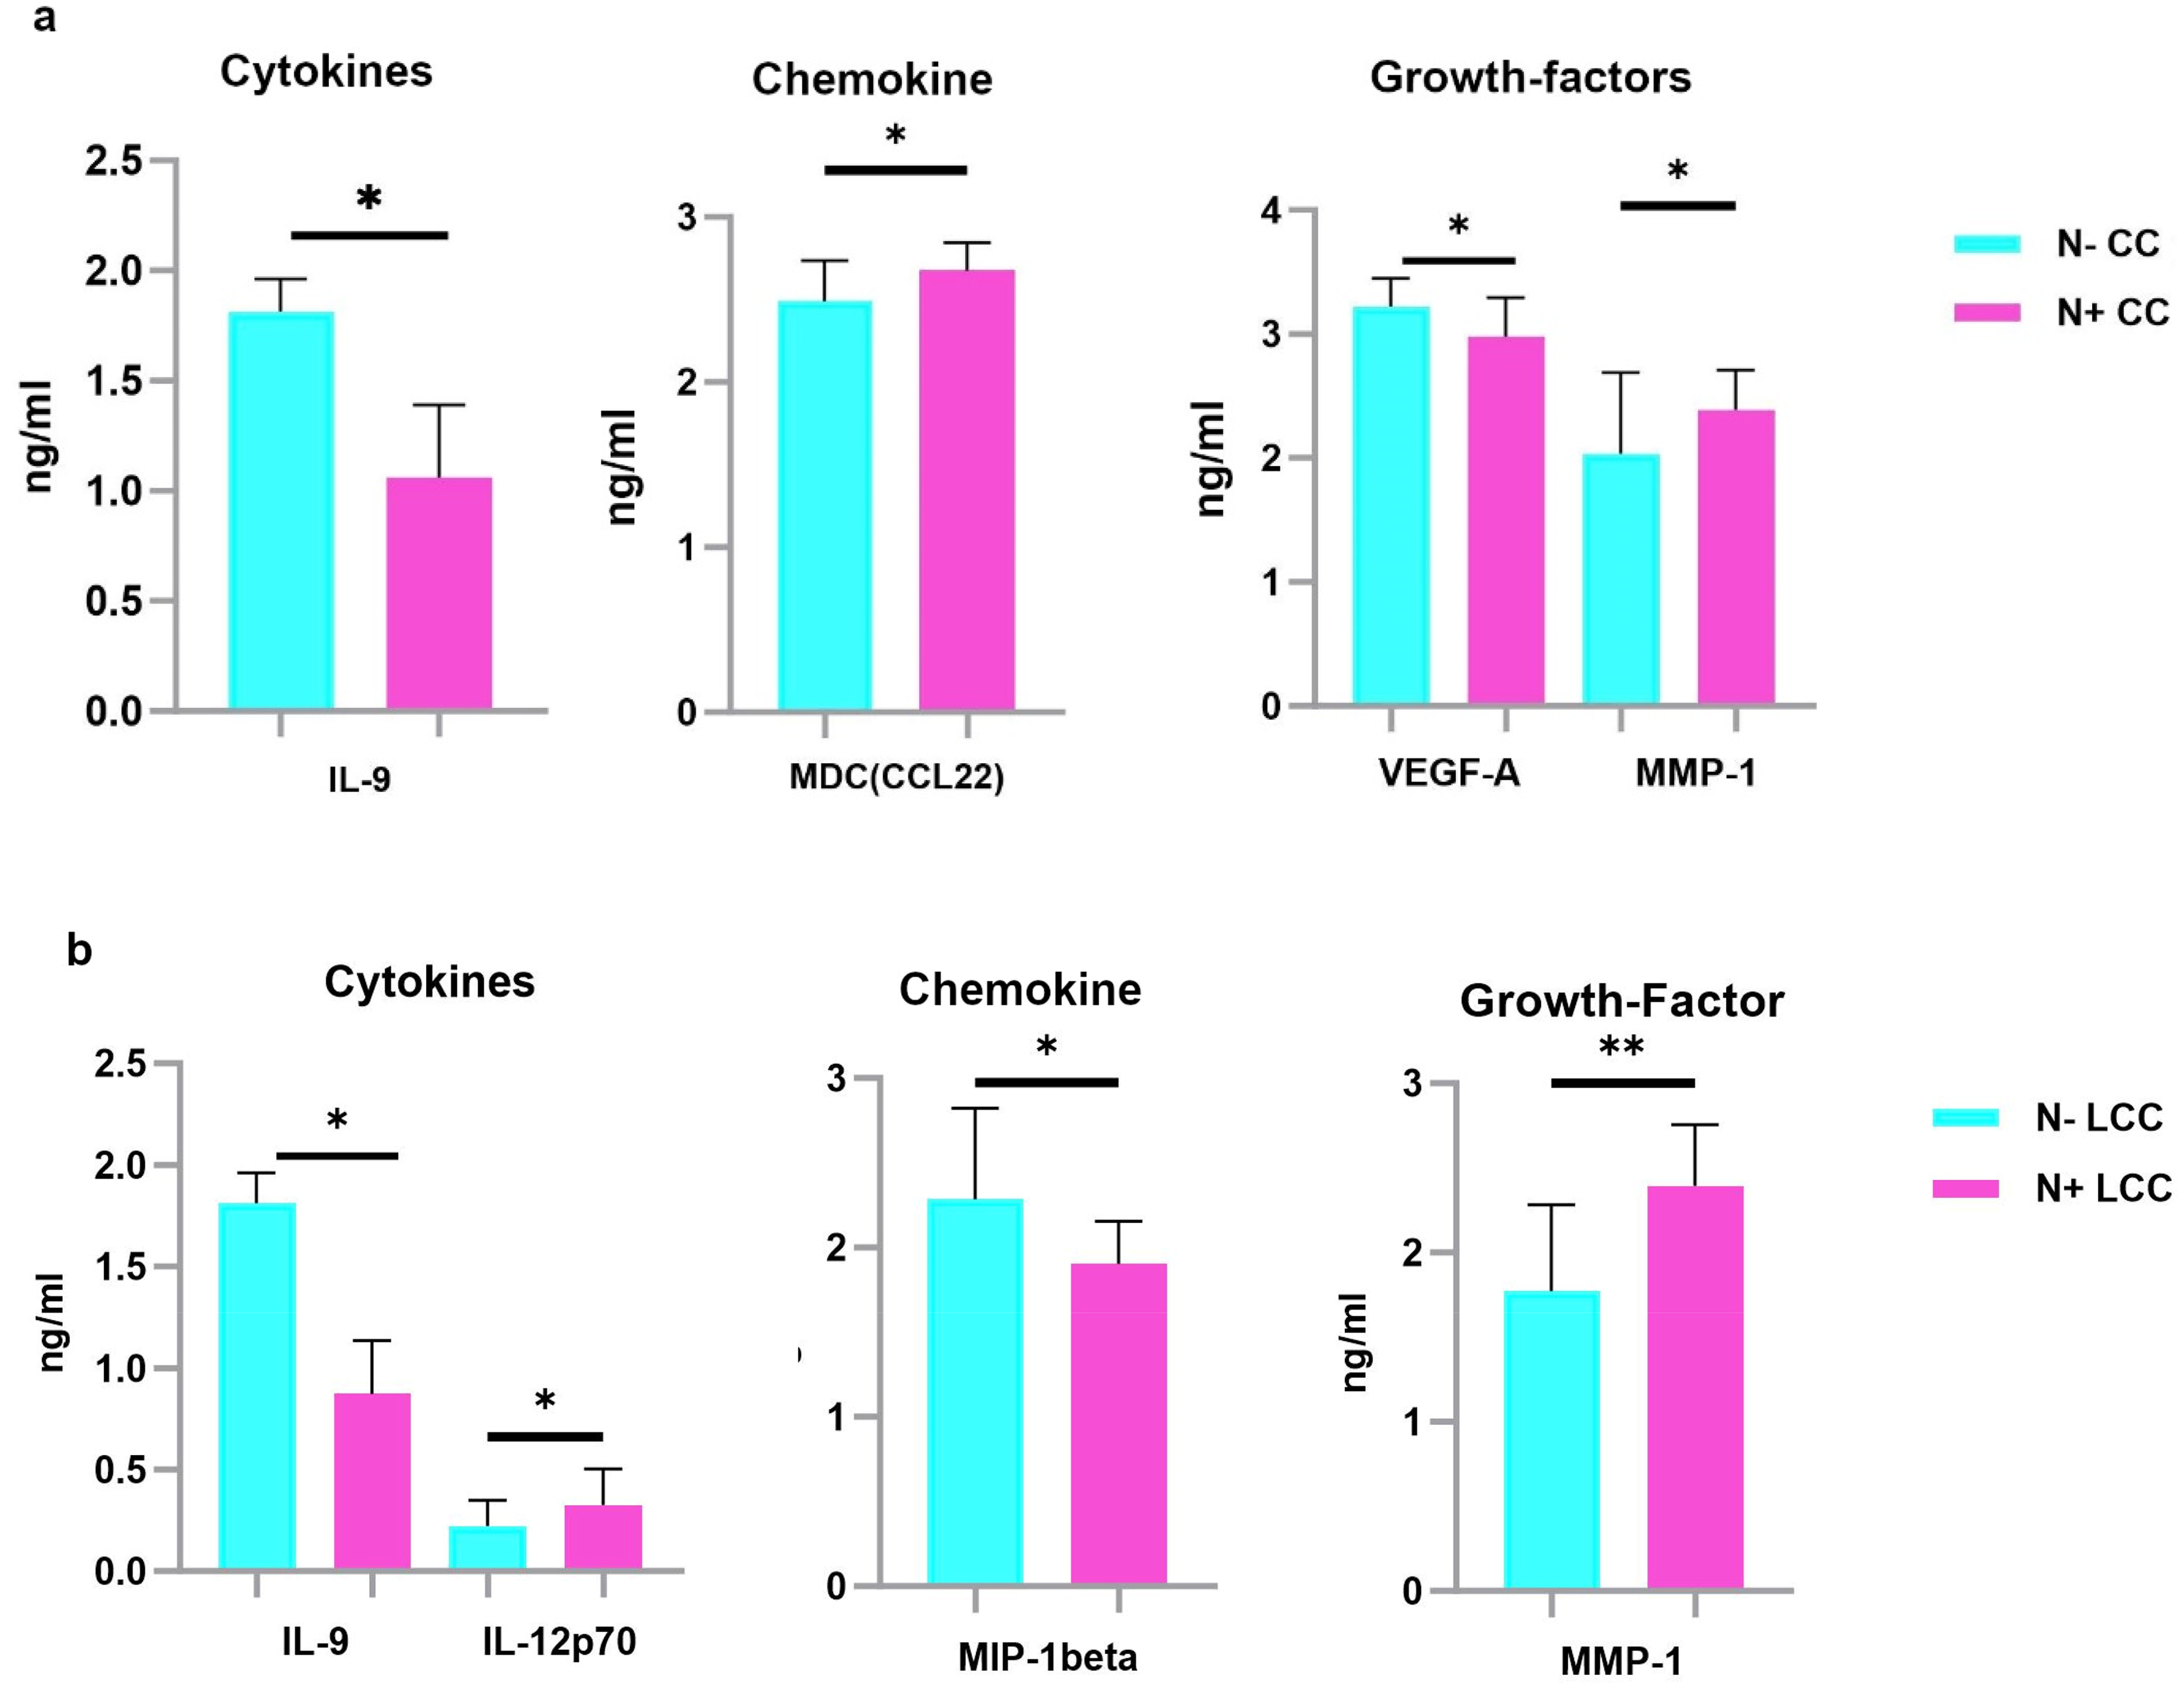
Serum protein levels between N+ and N- CC, LCC and RCC patients. Results are expressed as means values in ng/ml. a. Analysis revealed that IL-9 and VEGF-A were down-regulated, while MDC and MMP-1 were up-regulated in the sera of N+ CC compared to N- CC patients. b. Analysis revealed that IL-9 and MIP-1beta were down-regulated, while IL12-p70 and MMP1 were up-regulated in the sera of N+ LCC compared to N- LCC. P -values represent statistically significant cytokines serum level differences at baseline in N+ versus N- patients are in black; ** P < 0.005; *P < 0.05.
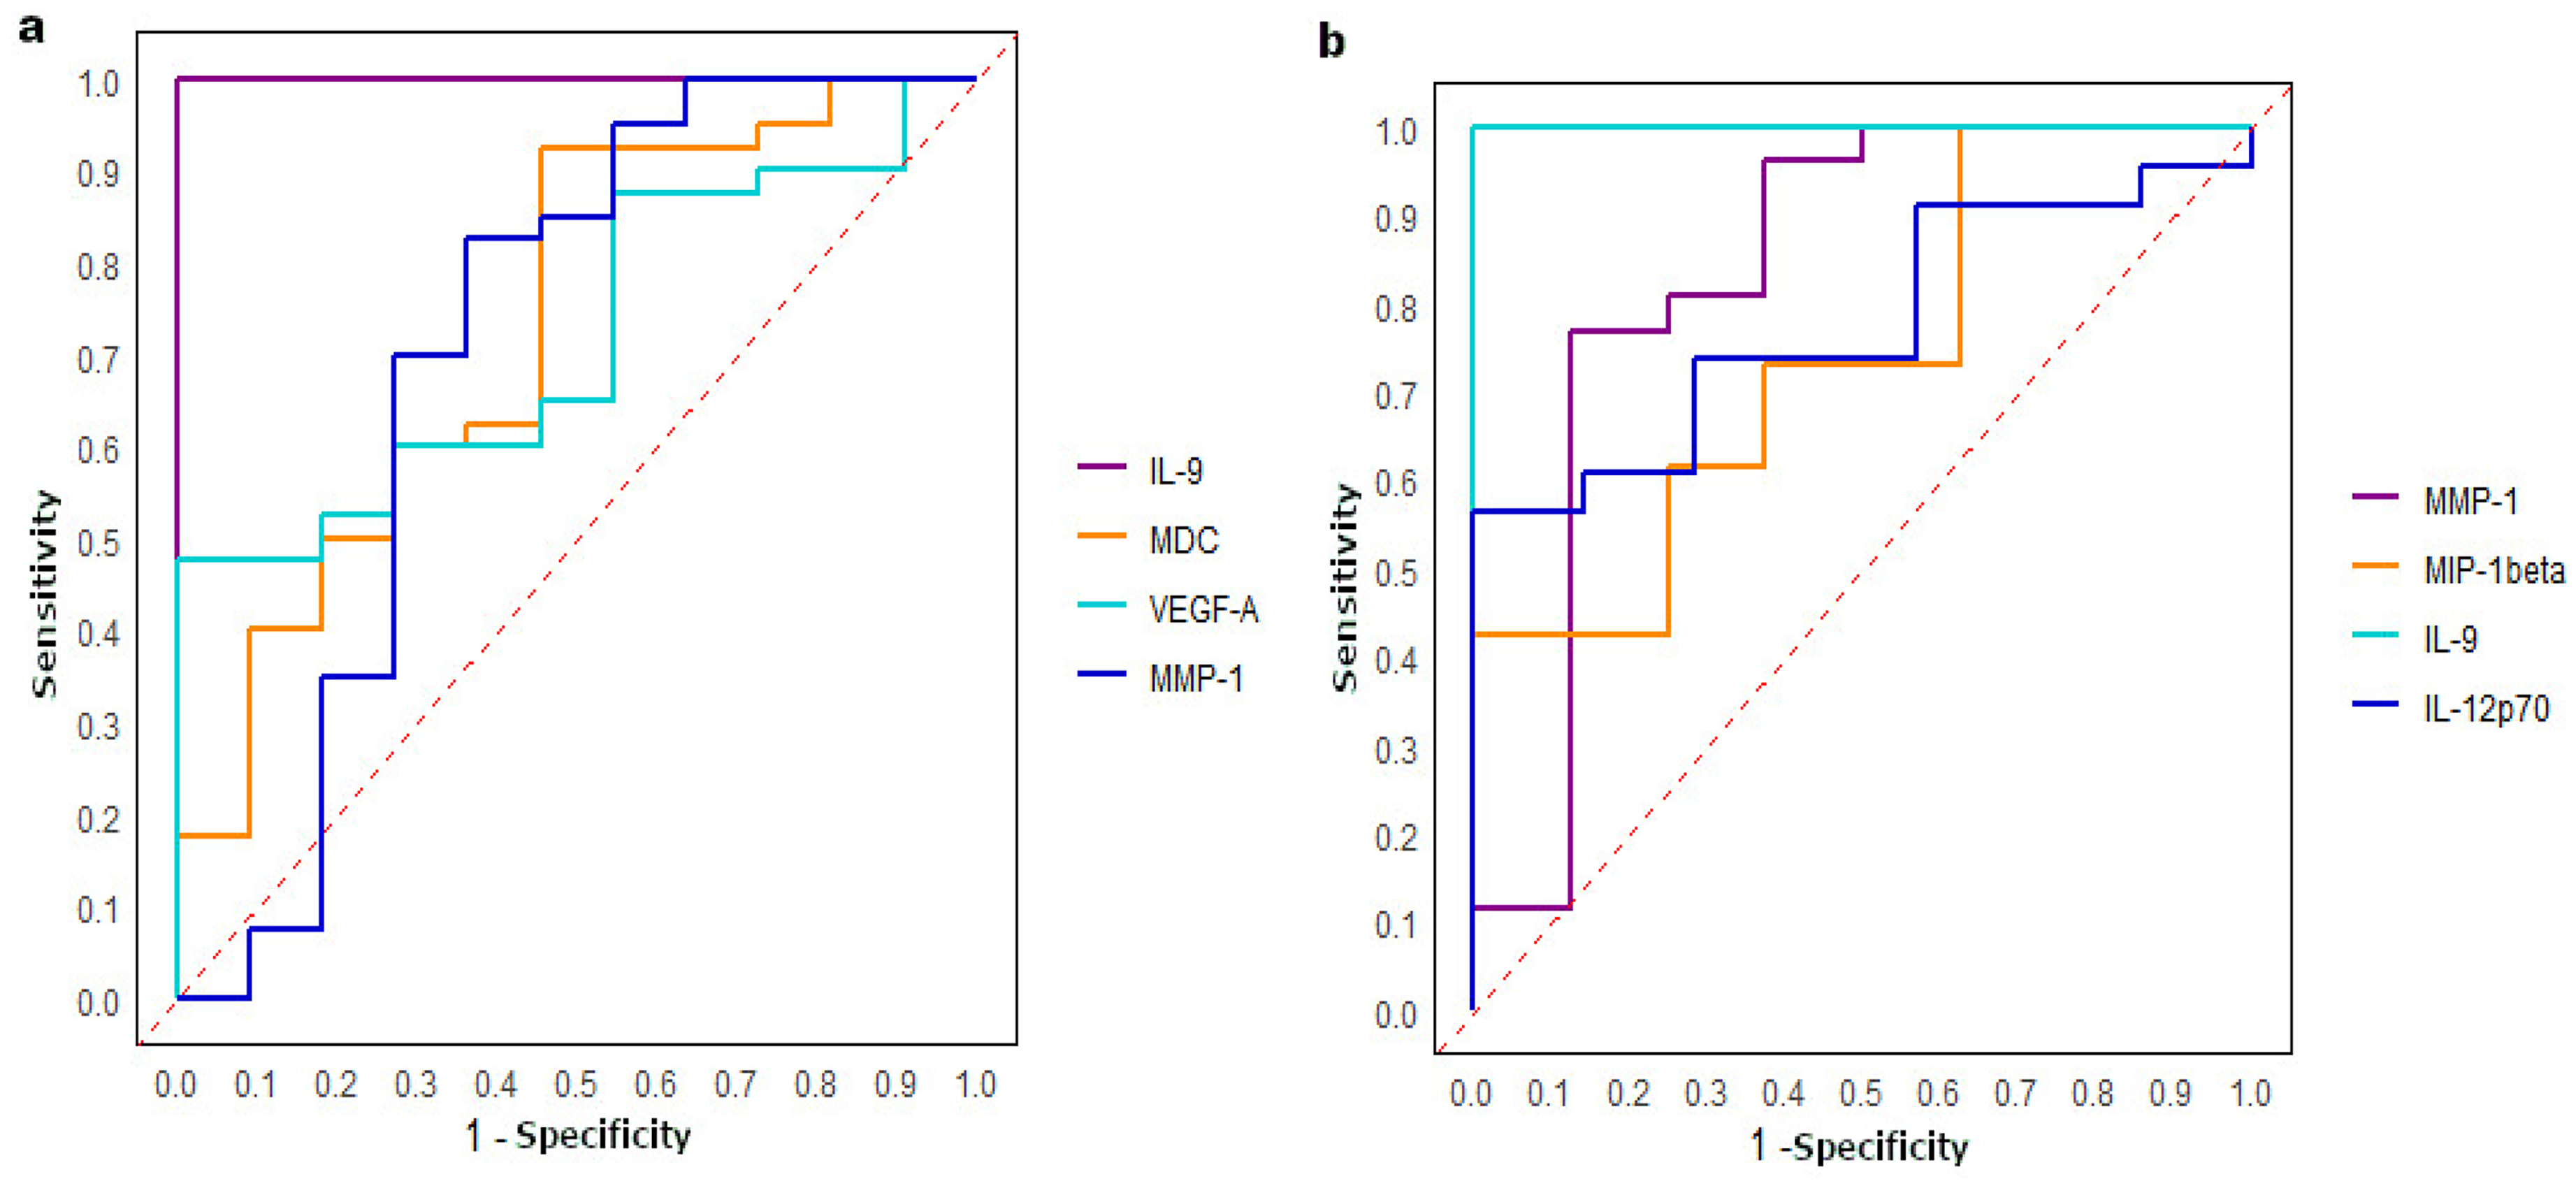
ROC curves. a. Analysis of the ROC curve was performed between N- and N+ CC. The highest AUC was found for IL-9 (1) followed by MDC, VEGF-A and MMP-1 (0.73, 0.72 and 0.70 respectively). b. Analysis of the ROC curve was performed between N- and N+ LCC. A great AUC was found for IL-9 (1), followed by MMP-1, IL-12 and MIP-1beta (0.83, 0.78 and 0.74 respectively).
Serum proteins differentially expressed between CC, LCC and RCC patients with and without lymph nodes invasion.
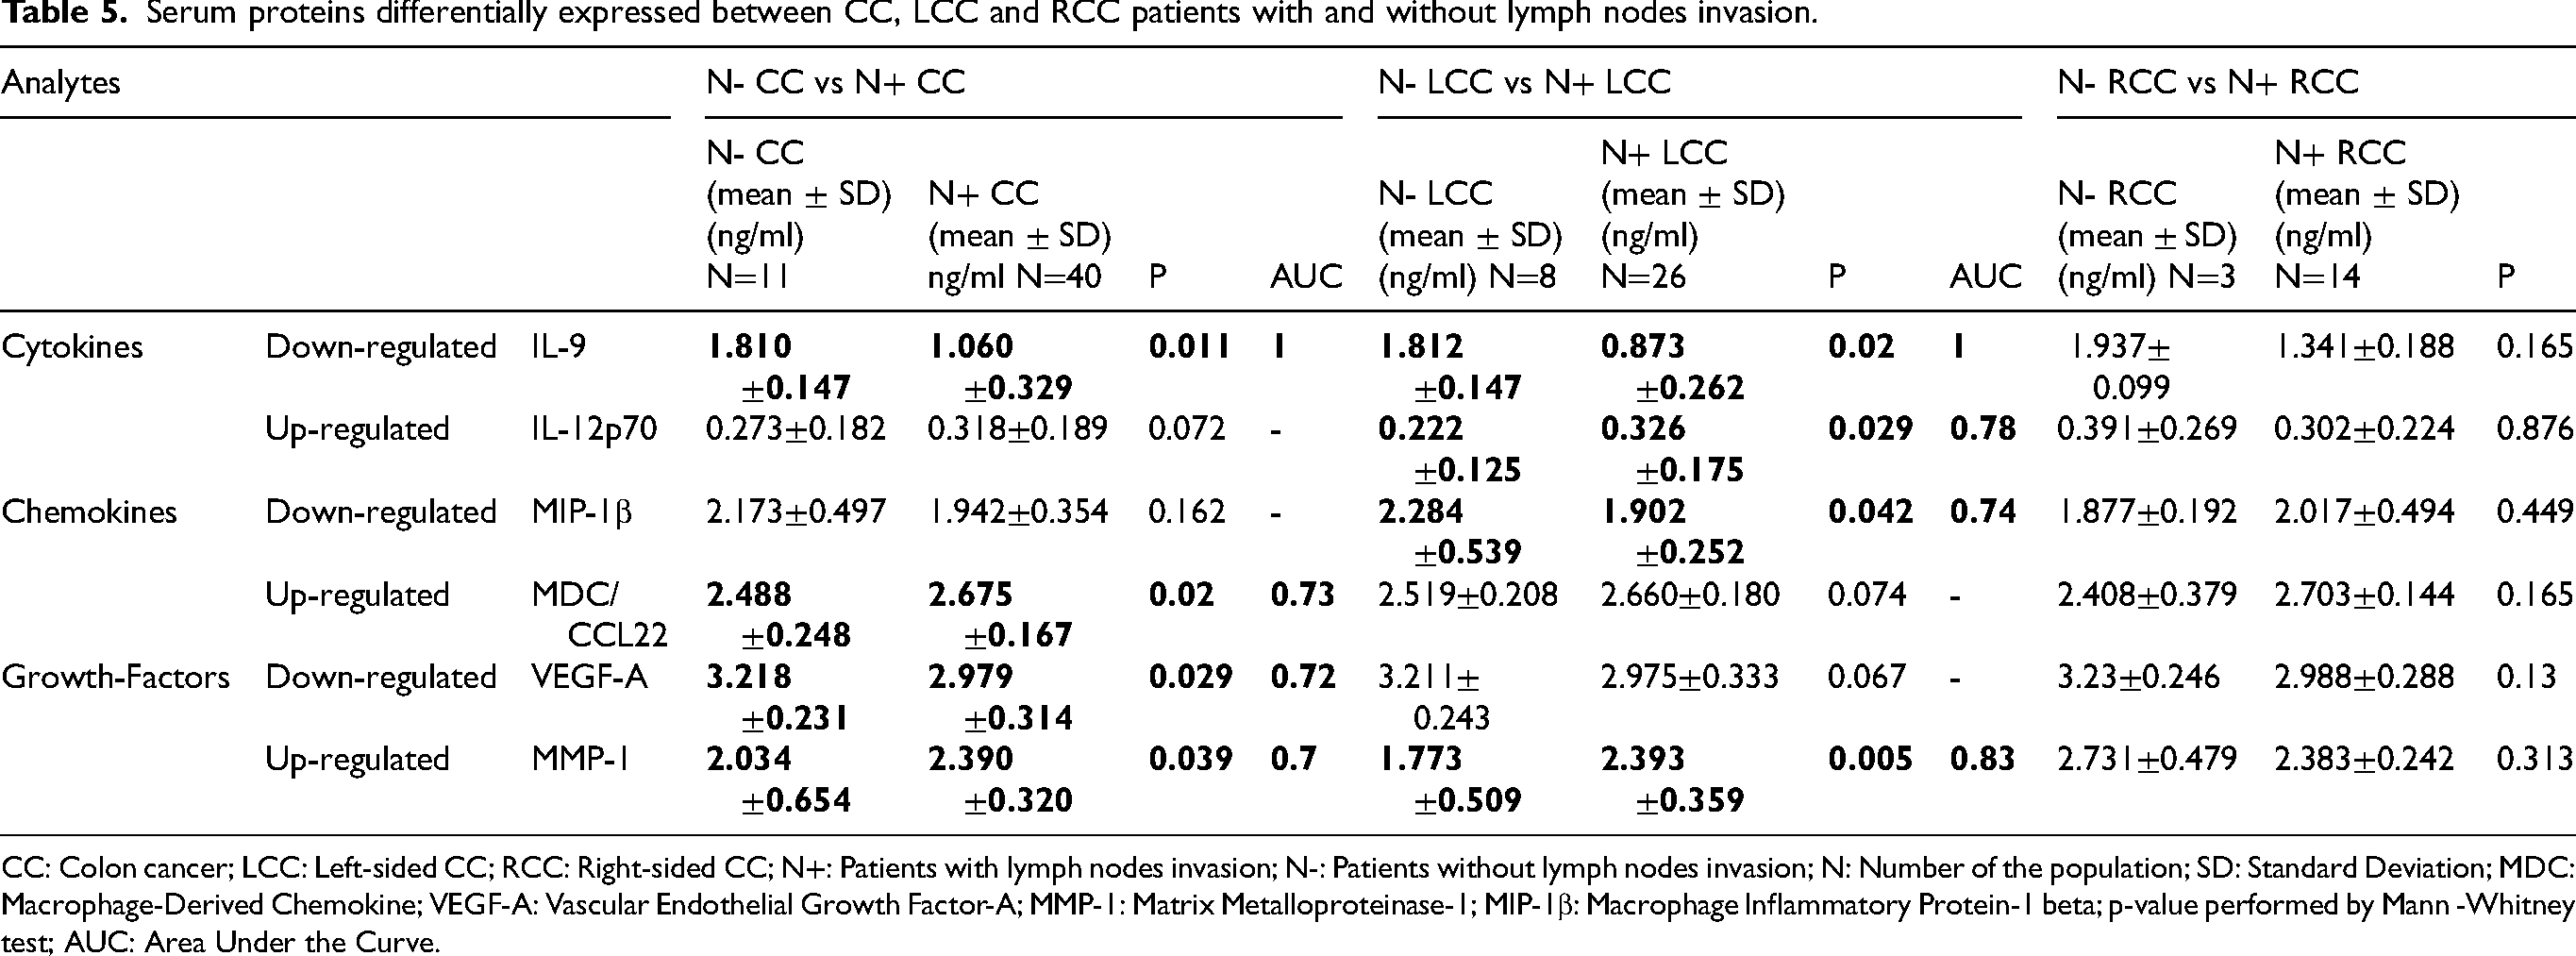
CC: Colon cancer; LCC: Left-sided CC; RCC: Right-sided CC; N+: Patients with lymph nodes invasion; N-: Patients without lymph nodes invasion; N: Number of the population; SD: Standard Deviation; MDC: Macrophage-Derived Chemokine; VEGF-A: Vascular Endothelial Growth Factor-A; MMP-1: Matrix Metalloproteinase-1; MIP-1β: Macrophage Inflammatory Protein-1 beta; p-value performed by Mann -Whitney test; AUC: Area Under the Curve.
Among LCC patients, 4 analytes (2 cytokines, 1 chemokine and 1 growth factor) were differentially expressed between cases with and those without lymph nodes invasion. IL-9 (p = 0.02) was down-regulated, while IL-12p70 (p = 0.029) was up-regulated in the sera of LCC patients with lymph nodes invasion. The chemokine MIP-1β (Macrophage Inflammatory Protein-1 beta) (p = 0.042) is less, whereas the growth factor MMP-1 (p = 0.005) is highly expressed in the sera of LCC patients with lymph nodes invasion (Table 5, Figure 5(b)). The ROC curve analysis revealed that the highest value was observed for IL-9 (AUC = 1), followed by MMP-1 (AUC = 0.83), IL-12p70 (AUC = 0.78) and MIP-1β (AUC = 0.74) (Figure 6(b)). These AUC values highlight the strong potential of these analytes in distinguishing between cases with and those without lymph nodes invasion for CC and LCC patients.
We didn't find any significant associations among RCC patients with and those without lymph-node invasion (Table 5).
Analytes associated with the resistance to ct in cc, LCC and RCC patients
Serum protein levels were analyzed following CT administration among patients diagnosed with CC and its subtypes LCC and RCC, stratified according to their response to CT, categorized as either non-resistant or resistant patients. Our aim was to compare and analyze the serum protein profiles after treatment with CT, providing insights into potential biomarkers associated with treatment resistance.
For CC patients, 3 analytes, including 1 cytokine (IL-23) and 2 chemokines (I-TAC (IFN-inducible T cell α Chemoattractant) and SDF-1α (Stromal cell-Derived Factor-1)) were differentially expressed between non-resistant and resistant CC patients to CT. IL-23 (p = 0.046), I-TAC (p = 0.024) and SDF-1α (p = 0.024) were down-regulated in resistant CC compared to non-resistant CC (Table 6, Figure 7(a)). The ROC curve analysis demonstrated that the highest AUC value was observed for IL-23 (AUC = 1), indicating perfect discrimination, followed by I-TAC and SDF-1α (0.76, 0.74 respectively) (Figure 8(a))
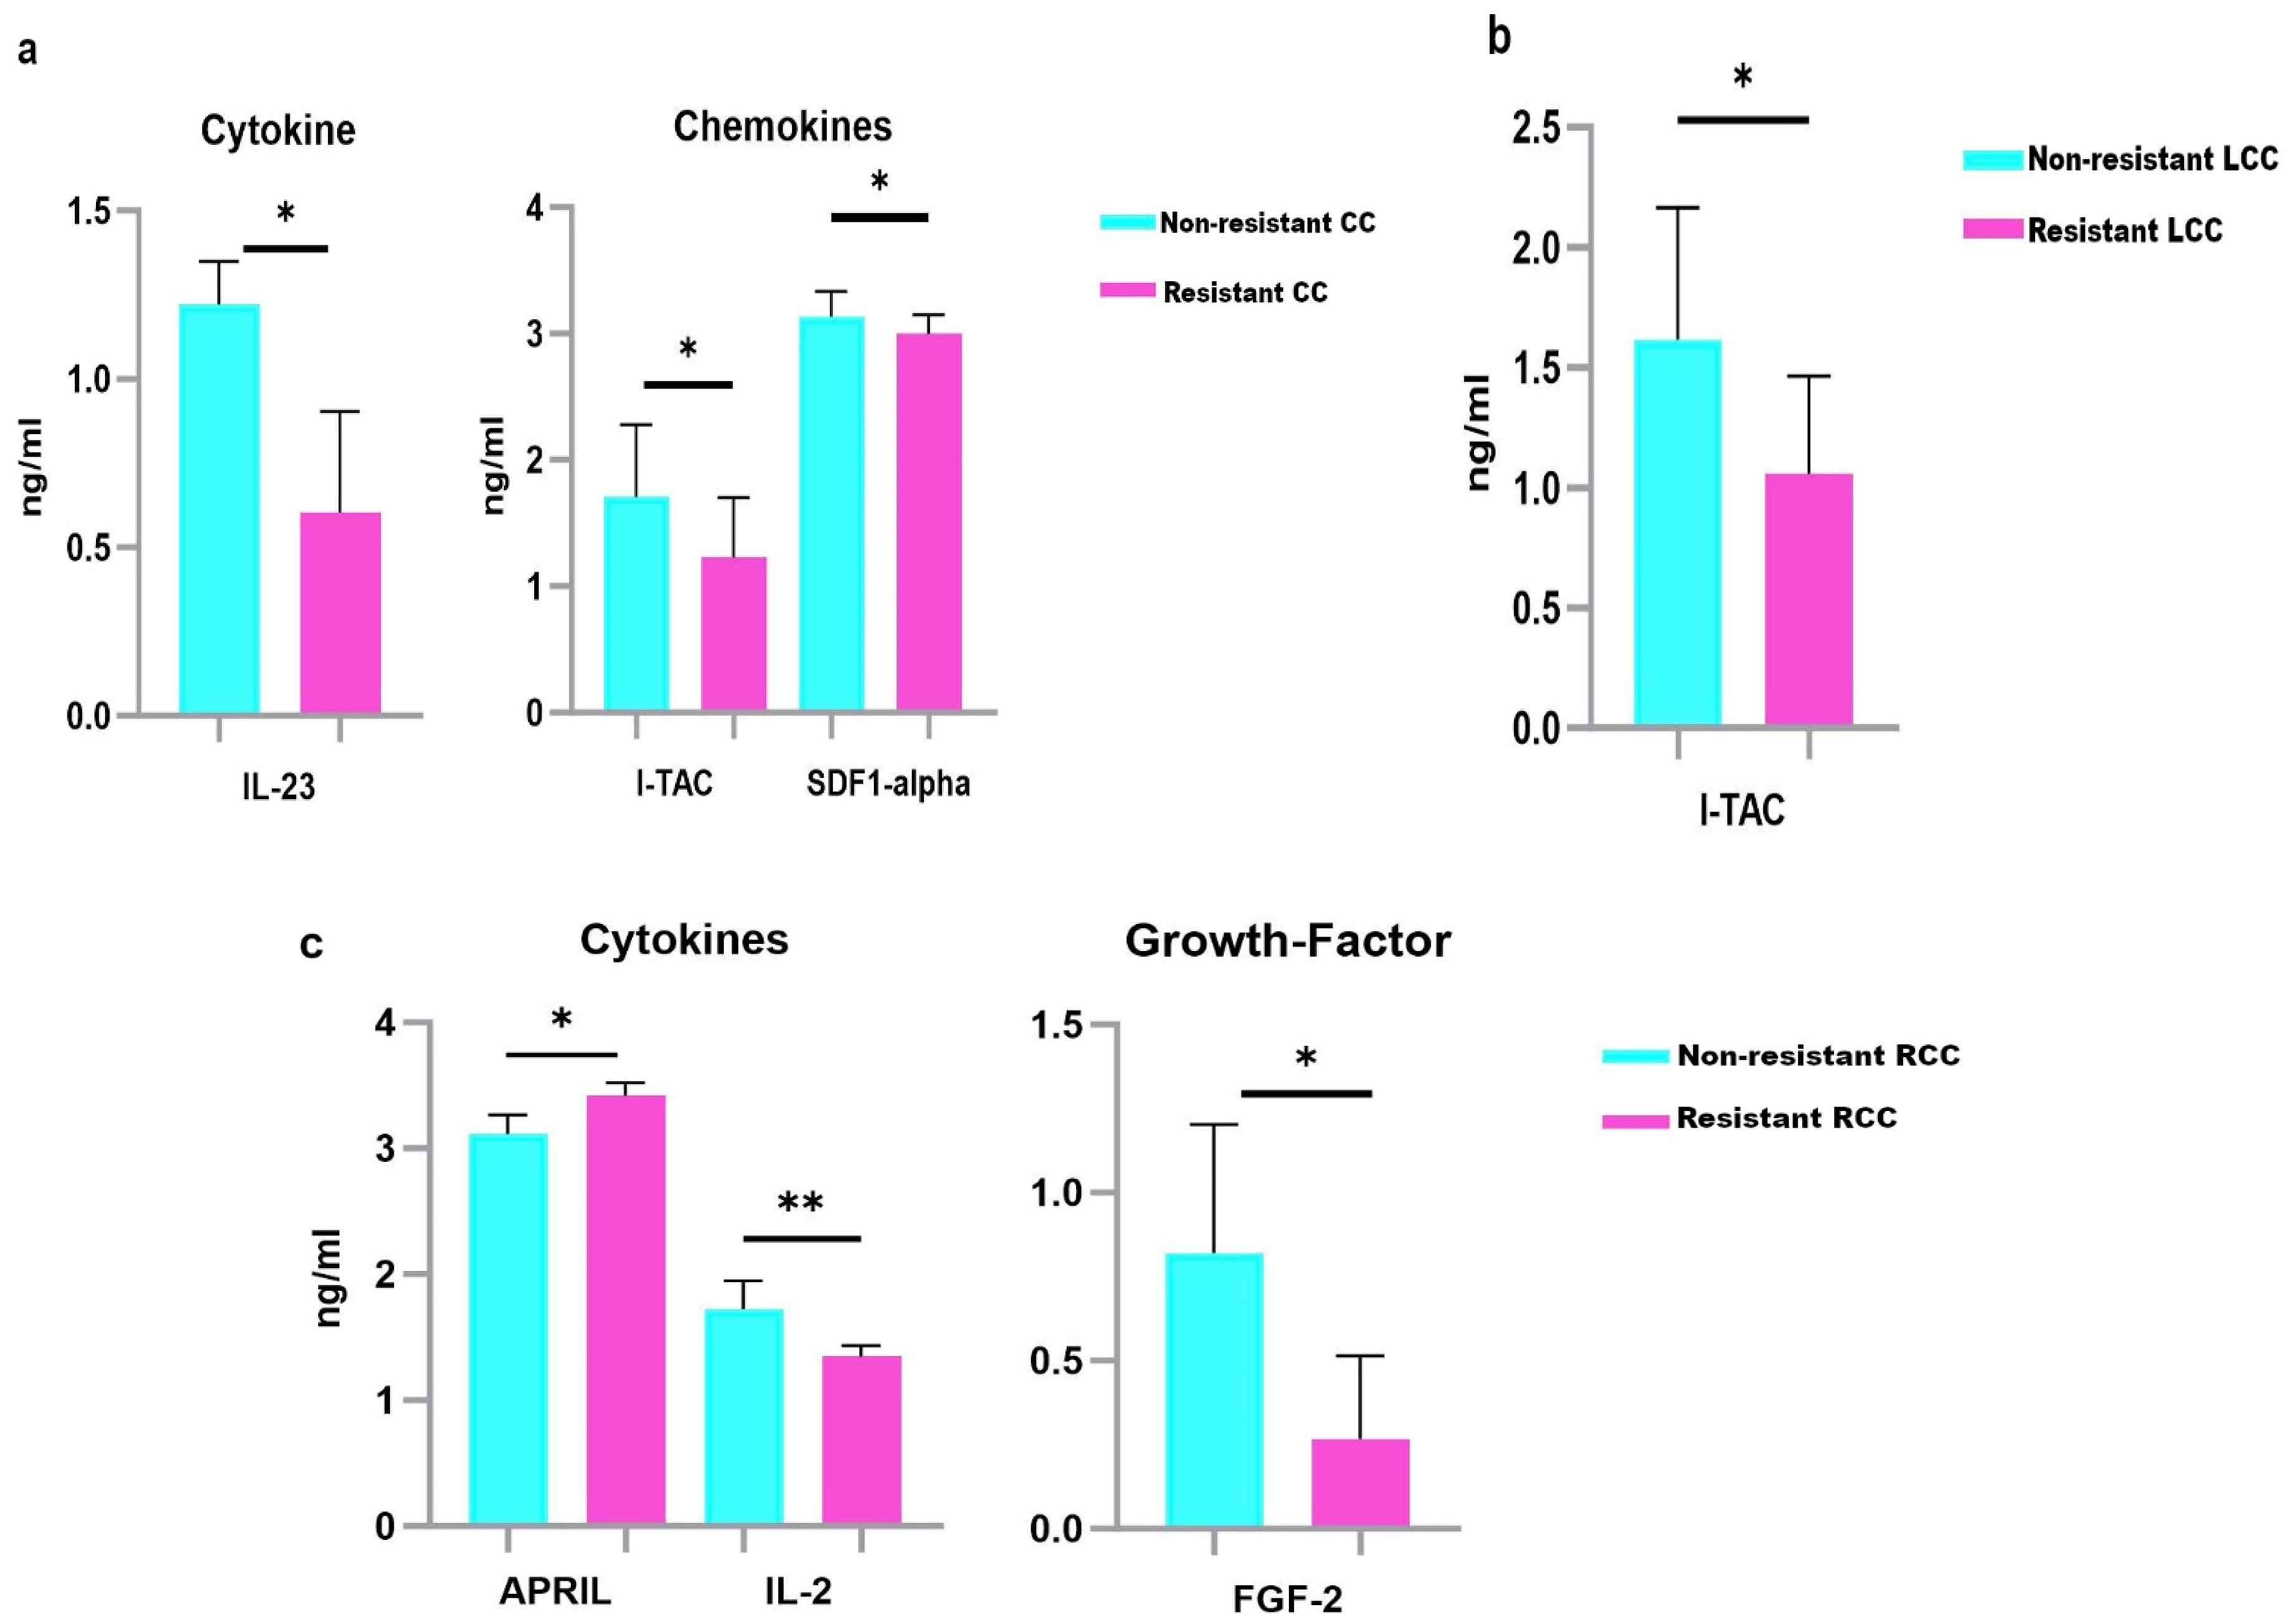
Serum protein levels in non-resistant and resistant CC, LCC and RCC to CT. Results are expressed as means values in ng/ml. a. IL-23, I-TAC and SDF1-α were down-regulated in the sera of resistant CC compared to non-resistant CC. b. I-TAC was down-regulated in the sera of resistant LCC. c. IL-2 and FGF-2 were down-regulated, while APRIL was up-regulated in the sera of resistant RCC. P-values represent statistically significant cytokines serum level differences at baseline in resistant versus non-resistant patients are in black; ** P < 0.005; *P < 0.05.
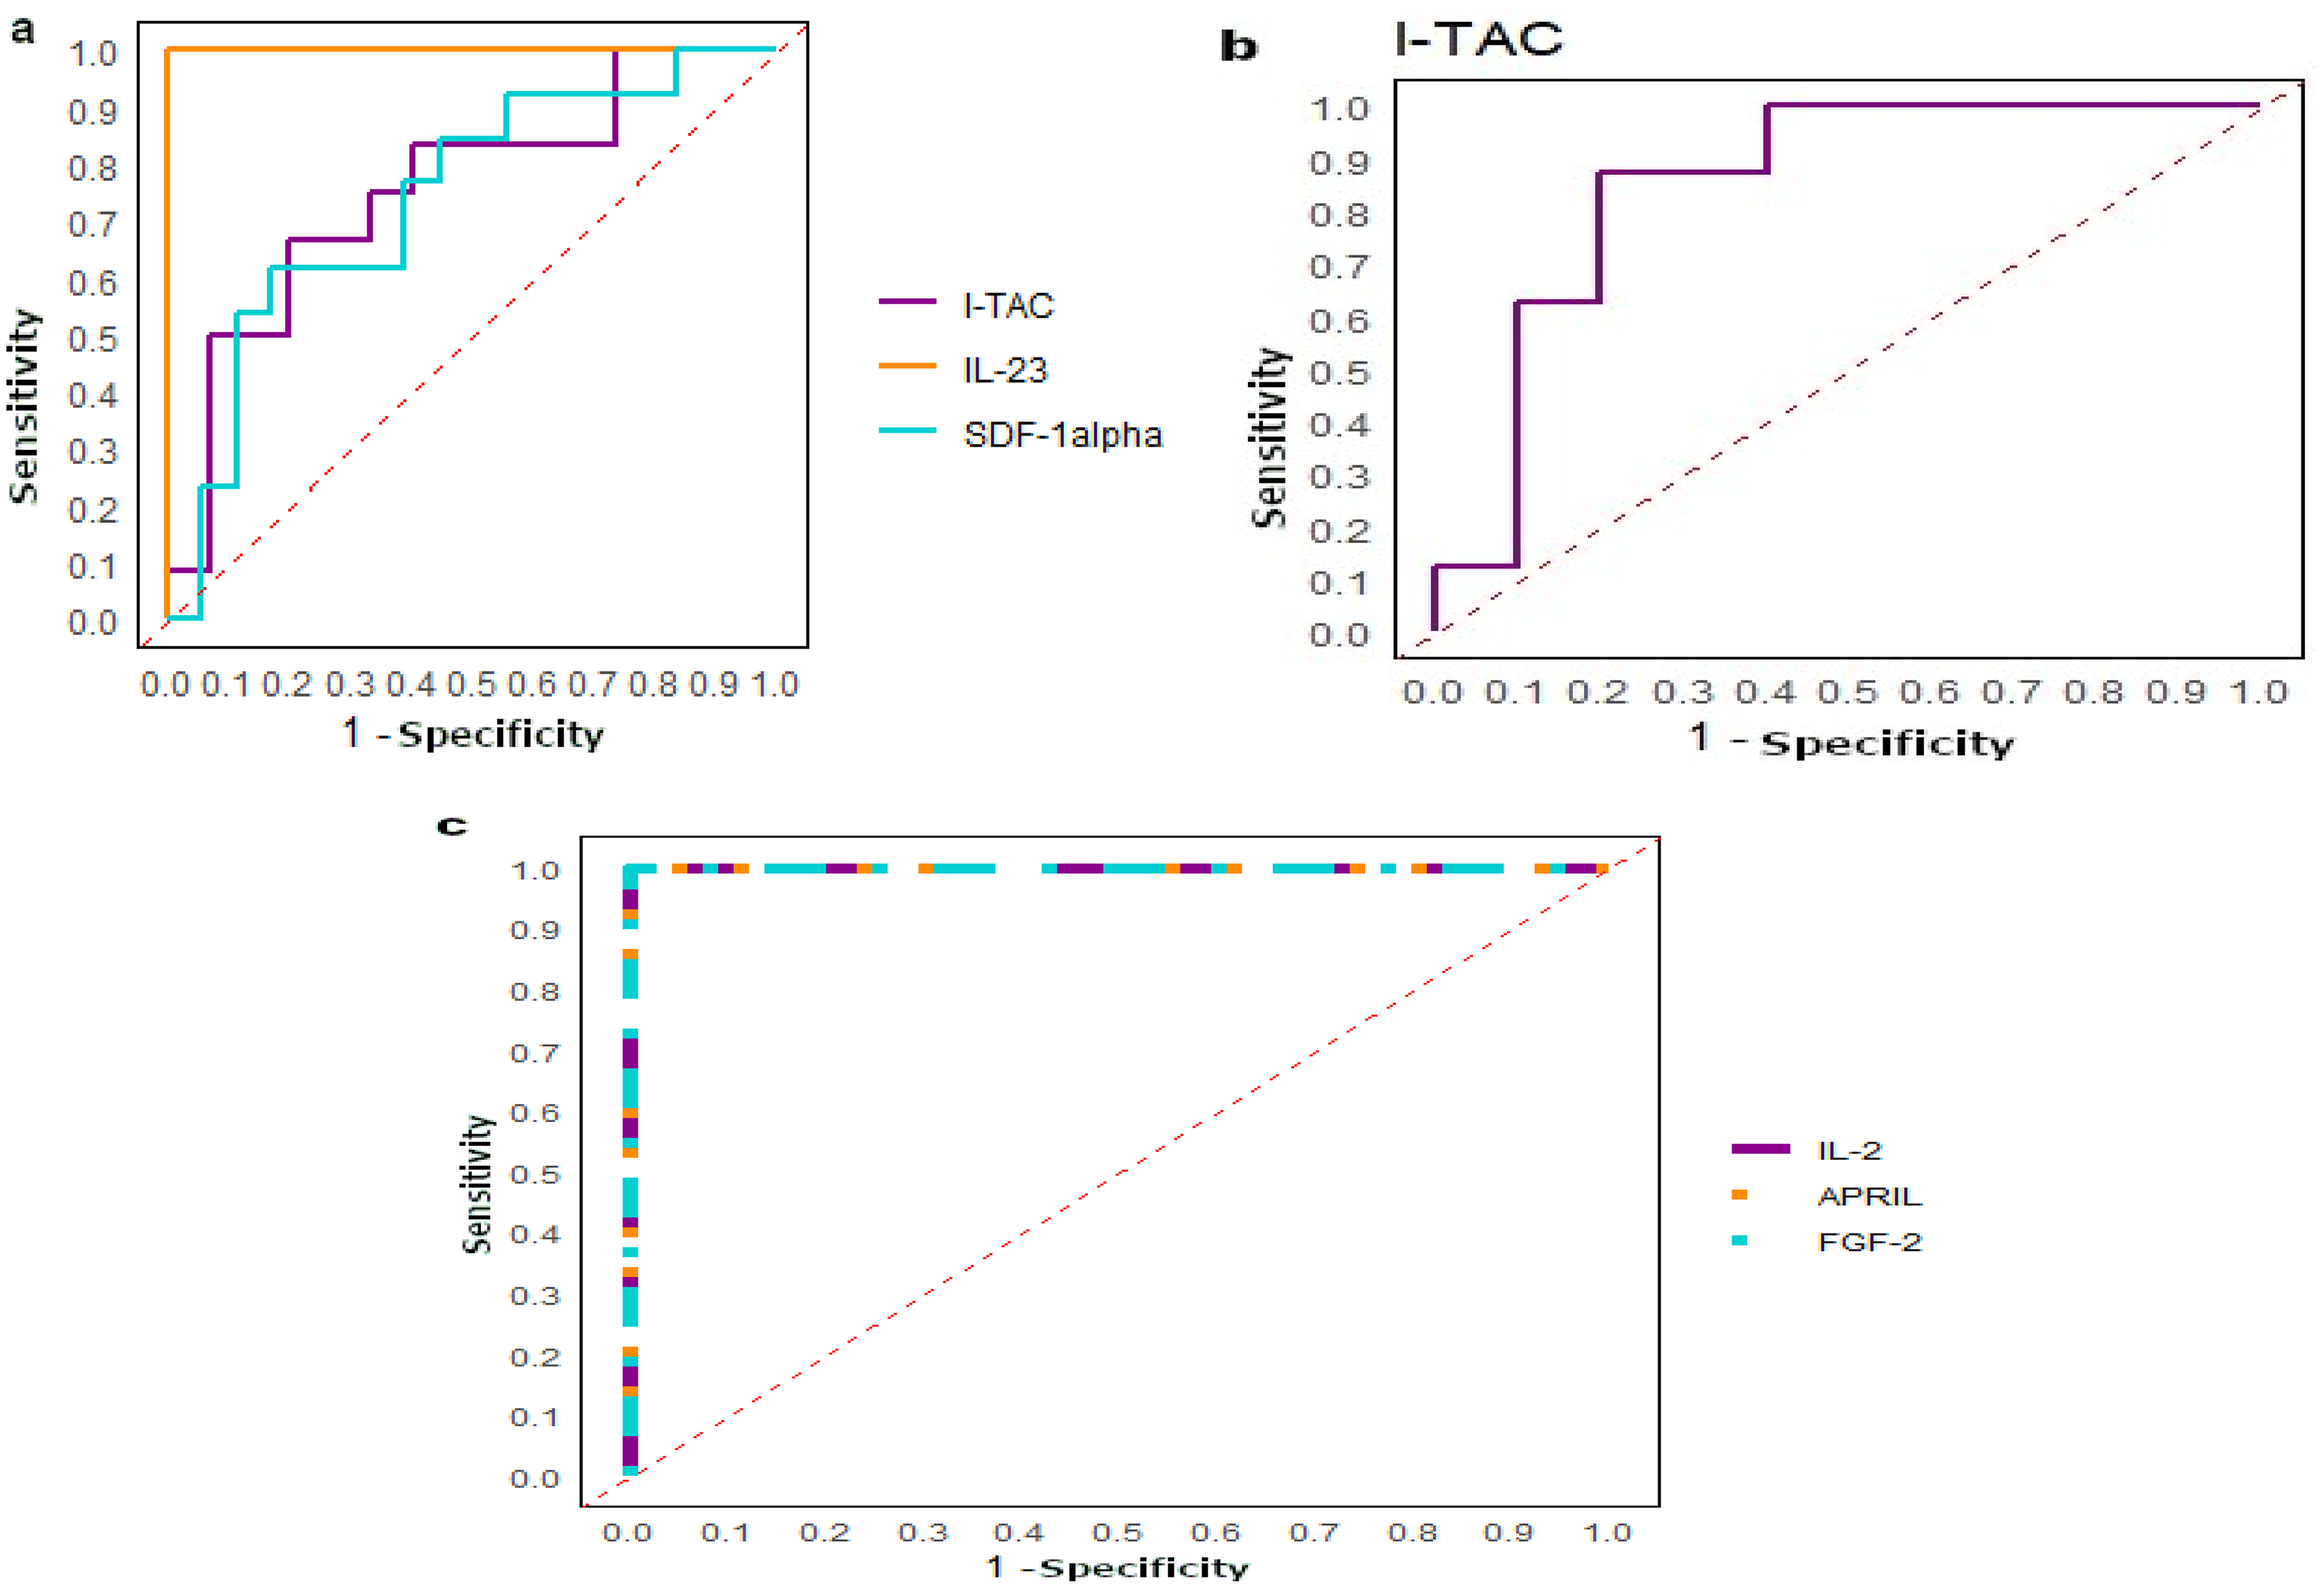
ROC curves. a. Analysis of the ROC curve was performed between non-resistant and resistant CC to CT. The highest AUC was found for IL-23 (1), followed by I-TAC and SDF-1α (0.76 and 0.74 respectively). b. Analysis of the ROC curve was performed between non-resistant and resistant LCC. A great AUC was found for I-TAC (AUC=0.85). c. Analysis of the ROC curve was performed between non-resistant and resistant. Great AUC with 1 was found for IL-2, APRIL and FGF-2.
Serum proteins differentially expressed between non-resistant and resistant CC, LCC and RCC patients.
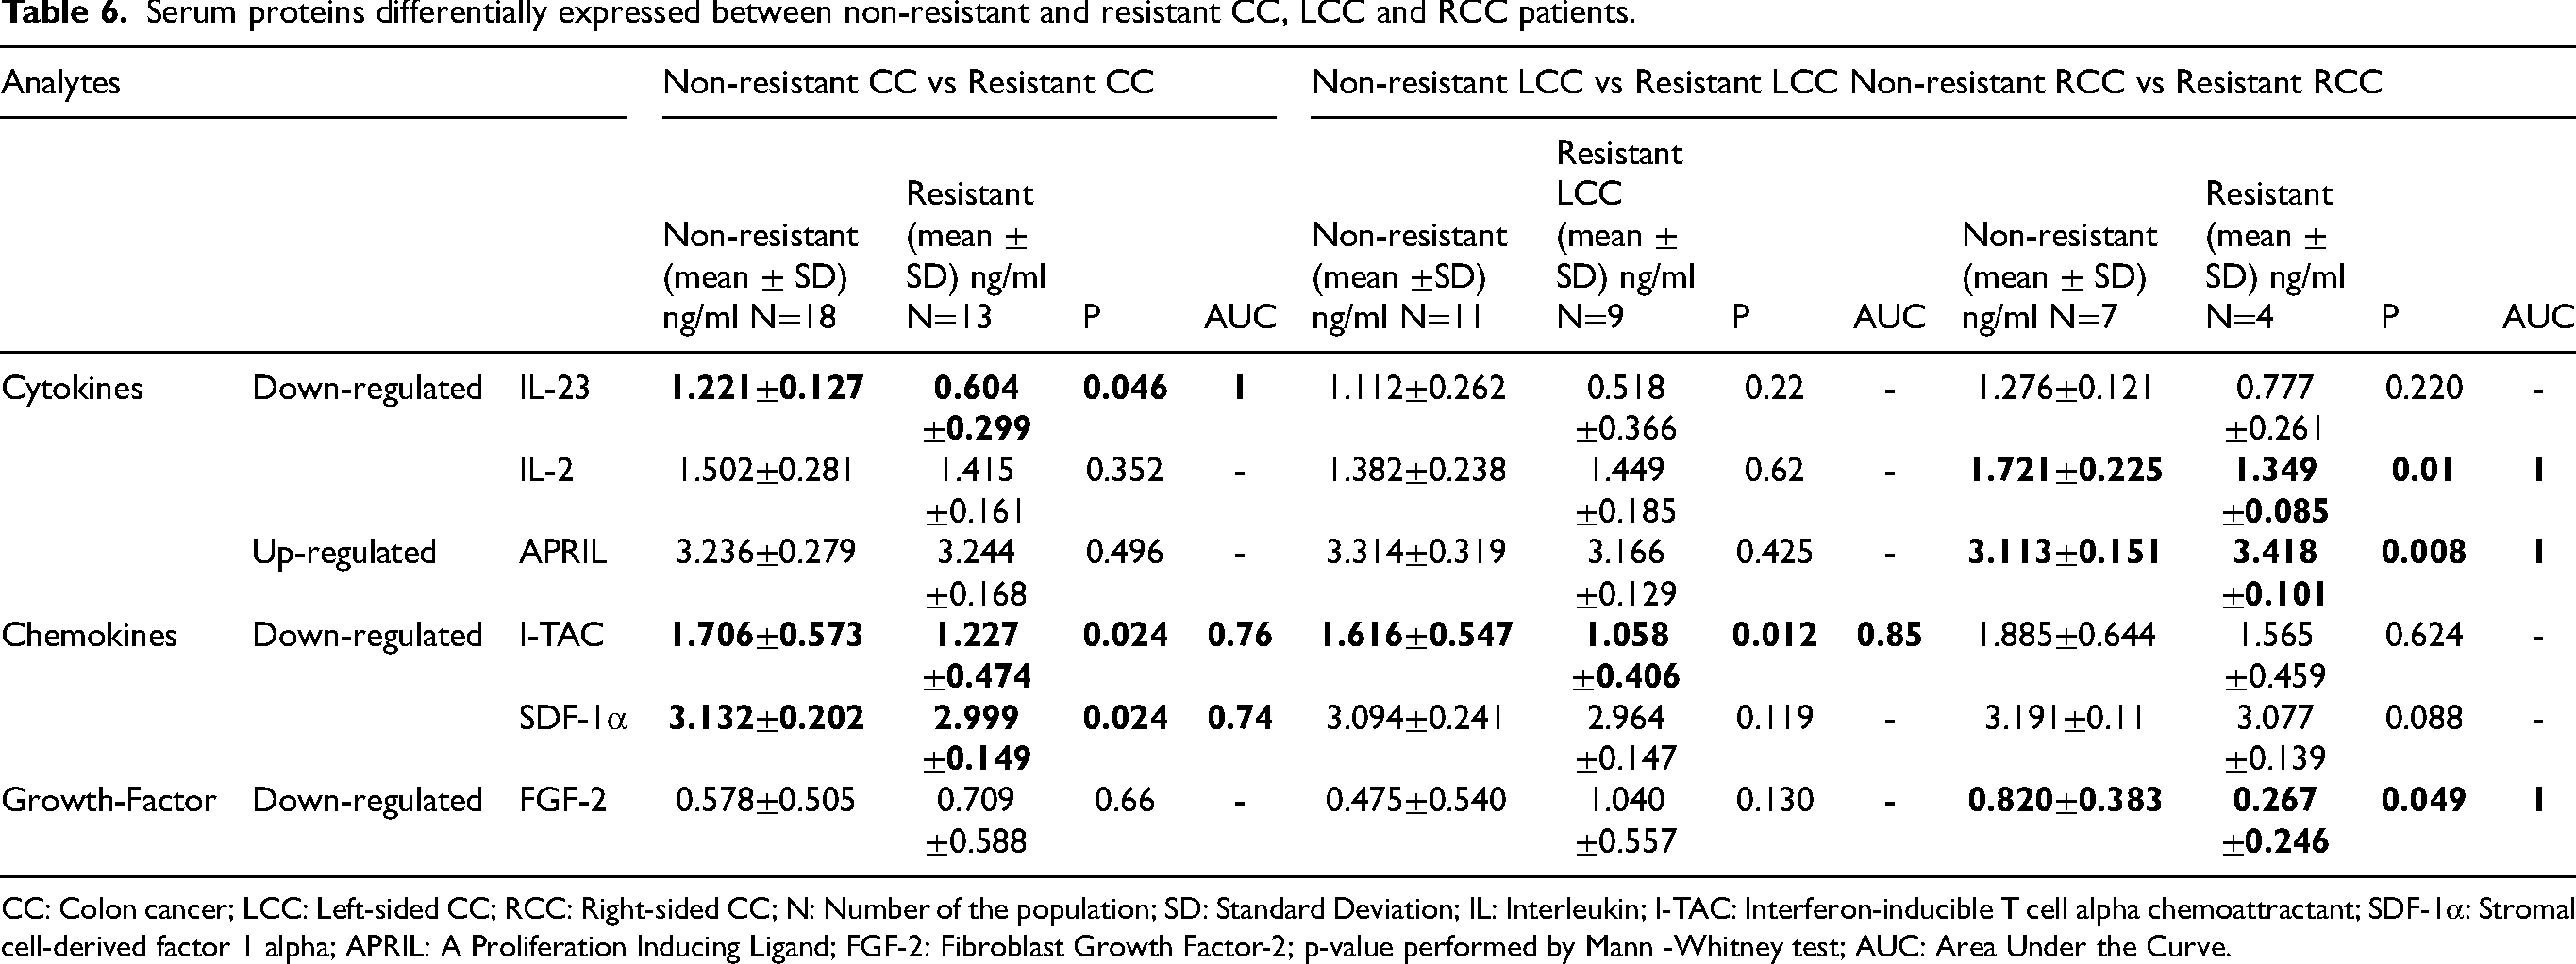
CC: Colon cancer; LCC: Left-sided CC; RCC: Right-sided CC; N: Number of the population; SD: Standard Deviation; IL: Interleukin; I-TAC: Interferon-inducible T cell alpha chemoattractant; SDF-1α: Stromal cell-derived factor 1 alpha; APRIL: A Proliferation Inducing Ligand; FGF-2: Fibroblast Growth Factor-2; p-value performed by Mann -Whitney test; AUC: Area Under the Curve.
Our results revealed that I-TAC (p = 0.012) was negatively associated with resistance to CT in LCC patients (Table 6, Figure 7(b)). I-TAC showed a great AUC value of 0.85 (Figure 8(b)).
According to RCC patients, 2 cytokines, IL-2 and APRIL (Proliferation-Inducing Ligand), and a growth factor FGF-2 (Fibroblast growth factor-2), were differentially expressed between resistant and non-resistant RCC. IL-2 (p = 0.01) and FGF-2 (p = 0.049) were down-regulated, while APRIL (p = 0.008) was up-regulated in the sera of resistant RCC patients (Table 6, Figure 7(c)). The ROC curve analysis revealed that IL-2, APRIL, and FGF2, had high AUC value of 1, suggesting their potential utility as theranostic biomarkers to identify potential resistant LCC patients to CT (Figure 8(c)).
Discussion
Approximately 80% of CC patients are 60 years or older at the time of diagnosis. 47 Although most CC cases are diagnosed at advanced stage, 2 emphasizing the identification of novel theranostic biomarkers to improve early detection of this tumoral disease. Differences in clinical characteristics and therapy responses are evident between LCC and RCC. 48 The identification of biomarkers associated with a higher risk of LCC and RCC, and response to CT, is essential in cancer biology. Our study revealed a higher proportion of female patients, particularly among RCC patients. Several Studies have shown that the incidence of RCC and/or LCC can vary between genders..4,48,49 These results highlight the need to identify sex-specific biomarkers in RCC and LCC to improve personalized treatment strategies. In this context, we aimed to assess variations in the serum protein levels between LCC and RCC patients. To the best of our knowledge, this is the first study to evaluate a panel of 65 serum analytes in LCC and RCC patients.
Association of analytes with the development of cc, LCC and RCC
The cytokine BAFF was down-regulated in the sera of CC patients compared to healthy controls, while both BAFF and IL-27 were down-regulated in LCC patients. However, no significant associations were observed for RCC patients. These findings have not been previously reported. BAFF, also known as TALL-1, CD257, TNFSF13B, or BLyS, belongs to the tumor necrosis factor (TNF) family and plays a critical role in the differentiation, survival, and function of B cells, which are important for humoral immunity. 22 BAFF has been implicated in various cancers, including breast cancer, 50 multiple myeloma 21 and CRC. 46 Otherwise, the down-regulation of BAFF has been observed in chronic lymphocytic leukemia. 51 Another study did not find differences in BAFF expression between normal and breast cancer tissue. 50 Although studies have highlighted the implication of BAFF in CRC, they have not conducted stratified analysis based on tumor location. BAFF levels were higher in CRC tumoral samples compared to normal tissues. 46
IL-27 has been reported to have anti-tumor activities. Low levels were found in CRC, 52 and lung cancer, 53 which is in accordance with our results in CC. Conflicting studies reported that elevated serum levels of IL-27 were found in gastroesophageal cancer 54 and breast cancer. 55 Thus, additional studies are needed to better evaluate this cytokine as theranostic biomarker for CRC including LCC and RCC.
Analytes associated with the development of metastasis in cc, LCC and RCC
More than 90% of cancer-related deaths occur due to metastasis. 56 Our results revealed that CD30 was up-regulated in metastatic CC patients. To the best of our knowledge, this is the first worldwide study to investigate serum levels of CD-30 in metastatic CC patients. CD30, also known as TNFRSF8 (TNF receptor superfamily member 8), is implicated in various biological processes by interacting with its ligand CD30L. 57 Upon activation, CD30 transmits signals via TRAF (TNF receptor-associated proteins), and this signaling cascade activates NF-kB (the nuclear factor-kappa B) pathways, leading to the progression of tumor cells. 43 The up-regulation of CD-30 was reported in several diseases including Hodgkin's disease, 43 ovarian cancer, 9 and some lymphomas, 58 such as diffuse large B-cell lymphoma. 45 A recent study suggested elevated levels of CD-30 in the serum of metastatic IBC. 10
In our study, BLC was up-regulated in metastatic LCC patients. BLC, is also known as chemokine CXC ligand 13 protein (CXCL13) or B cell-attracting chemokine 1 (BCA-1) and belongs to the CXC subtype of chemokine superfamily. 59 CXCL13 and its receptor CXCR5 promote the growth, migration, and invasion of CC cells, conferring poor prognosis. 60 Moreover, CXCL13 contributes to the development of distant metastasis in CC by increasing the secretion of matrix metalloproteinase 13 (MMP13) and the activation of the PI3K/Akt (Phosphatidylinositol 3 kinase/protein Kinase B) pathway. 61 BLC is involved in cancer cells proliferation, apoptosis, migration and metastasis. 25 It was reported that high levels of BLC were associated with poorer prognosis, 62 resistance to 5-FU in CRC, 63 and early stage of lung adenocarcinoma. 59
Our findings indicated that CD40L is downregulated in metastatic RCC patients. CD40L belongs to the TNF family. 64 CD40L activates CD40, a transmembrane protein receptor that exerts anti-tumor effects by inducing pro-apoptotic features. 44 Previous studies have reported elevated serum levels of CD40L in metastatic CC in comparison to healthy donors 65 and in metastatic CRC.66–68 Stratified analysis according to the tumor location of LCC and/or RCC was not enrolled. CD40L-positive tumors in large B-cell lymphoma was linked to better survival rates, suggesting a favorable prognosis. 69 Additionally, a down-regulation of CD40L serum levels has been reported in ovarian cancer patients. 9
Analytes associated with lymph nodes invasion in cc, LCC and RCC patients
Lymph nodes are crucial for the development of metastatic cells and immune modulation. 70 In this context, we evaluated the association of serum proteins with lymph node invasion in CC, and its subtypes LCC and RCC.
IL-9 and VEGF-A were down-regulated, while MMP-1 and MDC were up-regulated in CC patients with lymph nodes invasion. Zhang et al., reported that low levels of VEGF-A, an angiogenic factor that increases permeability, 42 were linked to better survival rates in CC. 71 Increased levels of VEGF-A were associated with lymph node metastasis in CRC72,73 and breast cancer. 74 MDC, also known as CC motif chemokine ligand 22 (CCL22), was up-regulated in colon epithelial cells in response to proinflammatory cytokines. 31 It has been reported that MDC is up-regulated in metastatic thyroid carcinoma 75 and CRC. 76
According to LCC, IL-9 and MIP-1β were down-regulated, whereas IL-12p70 and MMP-1 were up-regulated in LCC patients with lymph node invasion. However, no significant associations were observed for RCC patients. Significantly decreased levels of MIP-1β have been reported to be associated with increased risk of CC. 33 Otherwise, upregulation of MIP-1β has been revealed in IBC patients with lymph node invasion, 10 and with rectal cancer as compared to CC. IL-12p70 high levels were associated with the development of RCC in comparison to LCC and with lymph node metastasis in CRC. 18
In our findings, IL-9 was down-regulated in CC and LCC patients with lymph node invasion. IL- 9 is a pleiotropic cytokine, that promotes apoptosis of malignant cells in cancers, 77 such as melanoma. 78 The expression levels of IL-9 in CC are not well established. 79 Decreased levels of IL-9 in CC tissues were associated with CC progression, advanced stages (III-IV), 79 and lymph node metastasis. 80 MMP-1, a collagenase that degrades the extracellular matrix, 39 was up-regulated in CC and LCC patients with lymph node invasion. High plasma levels of MMP-1 were associated with lymph nodes invasion in CC, 81 and CRC,82,83 which aligns with our results. Moreover, increased levels of MMP-1 were associated with cell invasion, migration 84 and worse survival outcomes in CC.81,85
Analytes associated with resistance to treatment in cc, LCC and RCC patients
Our results revealed a downregulation of IL-23, I-TAC and SDF-1α, in resistant CC patients. IL-23 plays conflicting roles in cancer development. It has been suggested that IL-23 is associated with the development of inflammatory bowel disease (IBD) and colitis-associated CC, 86 the progression of CC, 87 and the promotion of metastasis in CRC. 88 Conversely, one study reported that high levels of IL-23 inhibit cancer progression. 89 Moreover, although increased levels of IL-23 were found in CRC patients undergoing CT based on Folfox, there was no apparent correlation with treatment outcomes. 90 SDF-1α chemokine, also known as CXCL12, interacts with the CXCR4 receptor leading to invasion and metastasis of tumors. 34 Nevertheless, it was proved that disrupting the SDF-1α/CXCR4 interaction with a CXCR4 inhibitor could enhance sensitivity to CT in CC. 34 Low levels of SDF-1α have been reported to be associated with the development of IBC in patients with lymph node invasion. 10
I-TAC, also known as CXCL11, was also down-regulated in resistant LCC patients. To the best of our knowledge, this is the first study to report the association of serum levels of such analyte with response to treatment in CC and LCC. Recent studies reported that the up-regulation of I-TAC in CC was associated with improved prognosis suggesting anti-tumor effects.29,91 In contrast, one study revealed that elevated levels of I-TAC were associated with lymph node metastases, advanced stage and worse survival rates. 92
According to RCC, IL-2 and FGF-2 were down-regulated, while APRIL was up-regulated in resistant RCC patients. IL-2 is an anti-tumor cytokine that induces T-cell-mediated immune response by activating T cells and NK cells. 93 Transfection of IL-2 gene into C-26 murine CC cells induced increased survival rates.. 94 Low levels of IL-2 have been reported in CRC. 52 In contrast, high levels of IL-2 were found in diabetic CC patients. 95 FGF-2 was up-regulated in IBC 10 and in CRC, 37 but not yet according to tumor location. Kopetz et al., found decreased plasma levels of FGF-2 after one cycle of FOLFIRI+bevacizumab in metastatic CRC. 96
In our results, we reported the up-regulation of APRIL in resistant RCC patients. APRIL, belongs to the TNF family, was overexpressed in several diseases including invasive bladder cancer, glioblastoma, esophageal and pancreatic adenocarcinoma. 21 APRIL has been reported to be upregulated in resistant CRC following 5FU-based CT. 97
The study demonstrated several strengths. First, CC cases and controls were well-matched according to their age and ethnicity (only Tunisian-born cases and controls included). Second, the comparison was conducted across several groups of patients. Furthermore, the analysis covered a wide range of 65 immune mediators. However, our study has limitations including the small sample size and the absence of validation in CC tumoral tissues. Future investigations with larger cohorts and confirmation in tumor samples are imperative to assess the impact of these analytes.
Conclusion
Our findings highlighted potential analytes that could be used as theranostic biomarkers for LCC and RCC patients. According to LCC, IL-27 may be used for early detection, up-regulation of BLC was associated with metastasis, IL-9 and MIP-1β were down-regulated, while IL-12p70 and MMP-1 were up-regulated in LCC patients with lymph nodes invasion, and I-TAC was down-regulated in resistant LCC patients. For RCC, CD-40L was down-regulated in metastatic RCC and, high levels of IL-2 and FGF-2 were associated with chemosensitivity, while APRIL provides valuable insights for clinicians to identify resistant RCC to CT.
Footnotes
Acknowledgments
We thank all blood donors and patients with CC who volunteered to participate in the present study. We thank the staff of the Salah Azaiez Oncology Institute for their help in collecting blood samples. The study was supported in part by the Tunisian Ministry of Higher Education and Scientific Research, The Agency for Science Technology and Research (A*STAR) and the PRFD4-P1-ANPR project.
Ethical considerations
The study was done by the Helsinki II declaration and was approved by the Ethics Committee of Salah Azaiez Institute and that all participants have provided informed consent, and the approval code is: ISA/2016/03.1, granted on April 22, 2016.
Author contributions/CRediT
Besma YACOUBI-LOUESLATI: Supervision and Revision for important intellectual content. Amani Attia: Interpretation or analysis of data, Preparation of the manuscript and Revision for important intellectual content. Mouna Stayoussef: Preparation of the manuscript. Amel Mezlini: Conception. Anis Larbi: Conception and Interpretation or analysis of data. Xu Weili: Conception and Interpretation or analysis of data. Azza Habel: Preparation of the manuscript.
Funding
The authors received no financial support for the research, authorship, and/or publication of this article.
Conflicting interests
The authors declared no potential conflicts of interest with respect to the research, authorship, and/or publication of this article.
Data availability
The datasets generated and/or analyzed during the current study are available from the corresponding author upon reasonable request.