
Abstract
Background
Neuroblastoma (NB) is one of the most common and aggressive pediatric solid tumors, characterized by a highly complex pathogenesis. Within the tumor microenvironment (TME), cancer-associated fibroblasts (CAFs) constitute a major cell population and play a pivotal role in facilitating communication among various stromal cells. However, the specific functions and contributions of CAFs in NB remain incompletely understood.
Objective
To investigate the impact of CAFs-related genes on the prognosis of NB, we developed a risk model to facilitate the diagnosis and prognostication of patients.
Methods
In this study, a CAFs gene prognostic model for NB was established using single-cell analysis and genomic sequencing data. The effectiveness of this prognostic model was subsequently evaluated through the development of a nomogram, immune infiltration analysis, drug prediction, and gene set enrichment analysis. Ultimately, the expression levels of the identified key genes were experimentally validated in NB tissues.
Results
A novel prognostic model for CAFs related to NB prognosis was established through single-cell analysis and transcriptome dataset analysis. The prognosis of the high-risk group was worse than that of the low-risk group. The validity of the model was confirmed by nomogram, drug sensitivity analysis, and immune infiltration methods. Finally, the high expression of the key gene STEAP2 in NB tissues was verified by experiments.
Conclusions
The study introduces a new predictive model that uses CAF markers to forecast the prognosis of NB. STEAP2 plays a key role in identifying high-risk neuroblastoma and may become a potential therapeutic target for NB.
Introduction
Neuroblastoma is one of the most common solid tumors in infancy and childhood, with a clinical incidence of approximately 1 in 7500 to 10,000 children. 1 Originating from neural crest cells, neuroblastoma typically arises in the adrenal medulla or along the sympathetic ganglion chain extending from the neck to the pelvis. The clinical presentation of NB is variable, ranging from asymptomatic masses to local infiltration and widespread metastasis, which can lead to symptoms affecting other organ systems. Recent advancements in treatment modalities, including myeloablative chemotherapy, radiation therapy, stem cell transplantation, surgery, retinoic acid, and antibody-based immunotherapy, have significantly improved the long-term event-free survival rates for high-risk neuroblastoma patients.2–4 Nevertheless, the prognosis for patients with advanced NB remains unsatisfactory, emphasizing the need for further investigation into the pathogenesis of NB.
The TME consists of adjacent blood vessels, immune cells, fibroblasts, signaling molecules, and the extracellular matrix (ECM). Tumor cells actively interact with the TME by releasing signals that promote tumor angiogenesis, induce immune tolerance, and modulate the surrounding environment. In turn, the TME can significantly influence cancer cell proliferation and evolution. 5 Fibroblasts are a major component of the TME, and CAFs constitute a heterogeneous subset of stromal cells. Compared to normal quiescent fibroblasts, CAFs exhibit enhanced proliferation rates, increased secretion of ECM proteins such as collagen and fibronectin, and improved migratory capabilities.6,7 CAFs have been found to play an important role in prostate cancer, cervical cancer, and colon cancer.8–10 However, further research is necessary to determine whether CAFs are useful for NB.
In recent years, medical bioinformatics has gained widespread application, spanning traditional genomics research to emerging single-cell analyses integrated with a diverse array of machine-learning techniques. Several prognostic models have been developed based on distinct gene expression patterns to evaluate disease risk and prognosis in NB, thereby facilitating the development of personalized diagnostic and therapeutic strategies. Despite being the most prevalent pediatric malignancy, limited research has focused on the prognostic significance of genes associated with cancer-associated CAFs in neuroblastoma.
This research aims to discover the key functions of critical CAFs genes by conducting a comprehensive analysis and modeling of the hub genes of CAFs in NB, using single-cell RNA sequencing and bulk transcriptomic RNA sequencing from the GEO dataset. Our study will provide novel insights into the prognosis and treatment of NB.
Methods
Data acquisition
The workflow was shown in Figure 1. The GSE192906 NB single-cell sequencing dataset and bulk transcriptome RNA-seq GSE49710 were obtained from the GEO website (https://www.ncbi.nlm.nih. gov/geo/). The R package “Seurat v4.3.0” was used for cell clustering and annotation. The clinical information and gene expression data from the NB patient dataset GSE49710 (n = 498) were utilized as the training set, with 5 patients lacking survival information excluded. Additionally, the E-MTAB-8248 dataset (n = 223) from the European Bioinformatics Institute (https://www.ebi.ac.uk/) and the TARGET-NB dataset (n = 248) from the National Cancer Institute (https://www.cancer.gov/) were selected as external validation sets.
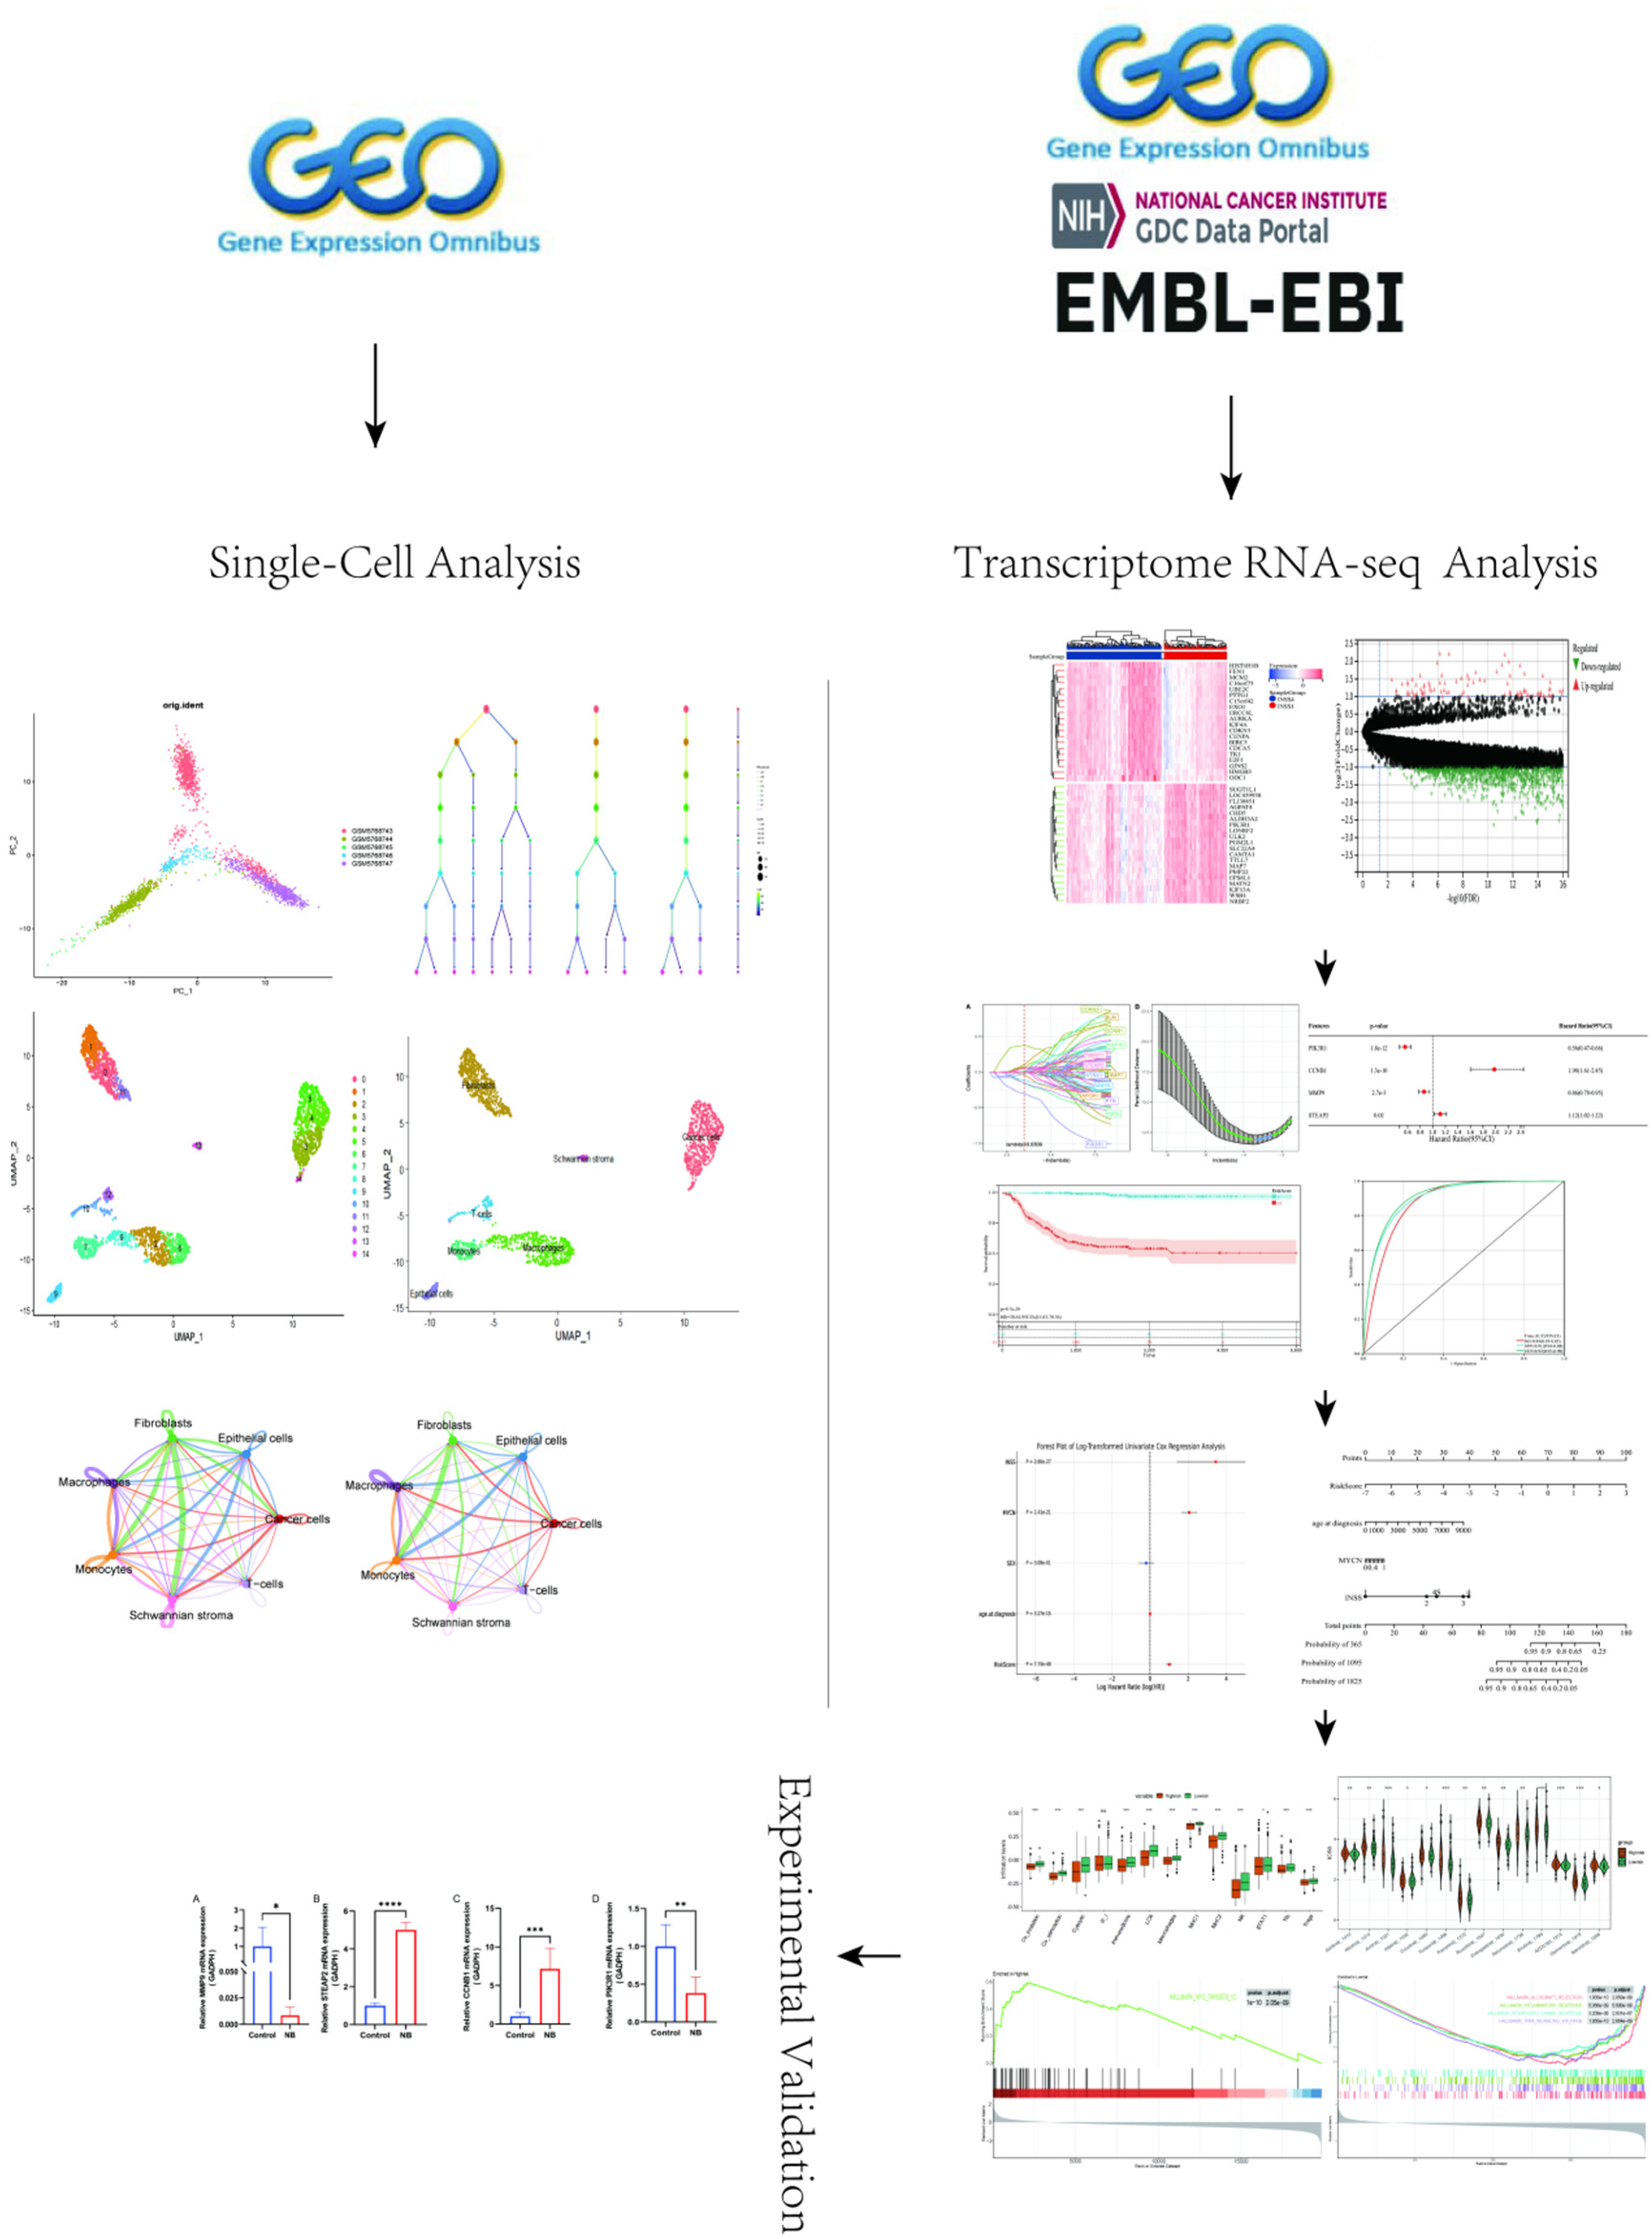
The workflow of this study is as follows. First, we utilized single-cell RNA sequencing data from GSE192906 to demonstrate that cancer-associated fibroblasts are highly active in the tumor microenvironment of neuroblastoma. Next, we analyzed the neuroblastoma transcriptome dataset GSE49710, which includes a total of 1696 genes, and intersected it with CAF-related genes obtained from public databases. This process identified 81 hub genes associated with both CAFs and NB. Using random forest and LASSO regression, we further narrowed down these hub genes to four key genes. A prognostic model was then established based on multivariate Cox regression analysis and validated using two external datasets. To facilitate clinical application, we constructed a nomogram. Additionally, we employed ESTIMATE, ssGSEA, GSEA, and OncoPredict algorithms to comprehensively analyze the immune landscape. Finally, experimental validation was conducted.
To identify CAFs genes, the GeneCards website (https://www.genecards.org) using keywords such as “cancer-associated fibroblast” and “CAF-s,” was applied to identify CAFs genes. A relevance score exceeding 5 was selected for further study.
Single-Cell RNA-seq spectrum analysis and communication analysis
The R package “Seurat v4.3.0” was used to conduct unsupervised clustering for single-cell data. 11 T-distributed stochastic neighbor embedding (t-SNE) and uniform manifold approximation and projection (UMAP) were employed to project high-dimensional single-cell transcriptome data into two-dimensional or three-dimensional coordinate spaces, facilitating the visualization of cell similarities. The R package SingleR and the CellMarker database were utilized to identify distinctive marker genes and categorize cell types.
The “CellChat” was employed to perform communication analysis. Cellular interactions, cell factors, and receptor ligands were analyzed to elucidate cell signaling pathways and regulatory networks.
Differential gene analysis and enrichment analysis
493 samples from the training dataset GSE49710 were chosen. A comparative analysis was conducted using the R package “limma”, with a fold change of 2, a threshold of p < 0.05, and false discovery rate < 0.05, to identify differentially expressed genes (DEGs) between the stage 1 and stage 4 groups. Subsequently, the genes obtained from differential analysis were intersected with 759 CAF-related genes sourced from various online platforms to screen for hub genes in NB. The R packages “clusterProfiler” and “enrichplot” were utilized to perform Gene Ontology (GO) and Kyoto Encyclopedia of Genes and Genomes (KEGG) enrichment analyses on these identified marker genes.
Construction and validation of prognostic features related to CAFs-associated genes
A univariate Cox analysis was performed on the 81 genes to identify genes with prognostic significance. Lasso regression was utilized to remove redundant genes and random forest was employed to identify genes with importance exceeding 0.7. multivariate Cox regression analysis was conducted to determine correlation coefficients and gene expression values. A risk score by combining gene expression values with corresponding multivariate Cox regression coefficients was developed using the formula: Risk score = Gene exp1 × β1 + Gene exp2 × β2 + … + Gene expn × βn. Then, patients were classified into high-risk and low-risk categories based on the median score. The R packages “survival” and “timeROC” were utilized to generate survival and ROC curves for assessing the prognostic value of the risk score. And the results were validated using external datasets E-MTAB-8248 and Target-NB.
Construction of nomogram and DCA plot for model calibration
The R packages “survival” and “survminer” were used to perform univariate Cox regression analysis to create a forest plot analyzing whether Risk score, age, gender, MYCN gene amplification status, and International Neuroblastoma Staging System (INSS) stage were independent prognostic factors for NB. Subsequently, the significant independent prognostic factors was used to perform multivariate Cox regression and construct a Nomogram and decision curve analysis (DCA) curves using the “rms” package.
Immune cell infiltration analysis
The Estimate algorithm was employed to assess the stromal and immune cell populations within malignant tumor tissues in high-risk versus low-risk groups. Additionally, single-sample gene set enrichment analysis (ssGSEA) was conducted using two distinct databases to quantify the abundance of 28 and 13 types of tumor-infiltrating immune cells at the individual sample level.
Relationship analysis between chemotherapy risk score and sensitivity
The “OncoPredict R” package was utilized to forecast drug responses in cancer patients by aligning tissue gene expression profiles with genomic sensitivity datasets from the Genomics of Drug Sensitivity in Cancer (GDSC) (https://www.cancerrxgene.org/) and Cancer Cell Line Encyclopedia (CCLE) (https://portals.broadinstitute.org/ccle_legacy/home) databases. The sensitivity to 198 drugs between high-risk and low-risk groups was evaluated using unpaired t-tests, with statistical significance determined at a threshold of P < 0.05.
Pathway and functional enrichment analysis
Pathway and functional enrichment analysis were conducted using GSEA software (version 4.0.1) with 1000 permutations. The analysis criteria included gene set size ≤ 15, Normalized Enrichment Score (NES) > 1.5, and P value < 0.05. The GSEA results were visualized using the R packages “enrichplot” and “gseaplot2.”
Clinical tissue specimens
This study involved the collection of tumor tissues from six patients with stage IV NB, as classified by the INSS stage, along with adjacent non-tumor tissues obtained from regions surrounding the tumor, including samples from the tumor margin. These adjacent tissues were used as normal controls for the experimental analysis. The samples were collected from the Department of Pediatric Surgery at Zhujiang Hospital, Southern Medical University, between May 2022 and August 2023. All tissue specimens were confirmed by pathology. The study was approved by the Ethics Committee of Zhujiang Hospital, Southern Medical University, and all procedures complied with the principles of the Helsinki Declaration. Written informed consent was obtained from the guardians of the pediatric patients prior to specimen collection.
Tissue specimens were preserved in tissue RNA preservation solution (New Cell &, Molecular Biotech, China) and stored at −80°C. The research was approved by the Ethics Committee of Zhujiang Hospital, Southern Medical University, and all procedures were carried out in compliance with the Helsinki Declaration. Written consent from the guardians of pediatric patients was obtained before specimen collection.
RT-PCR
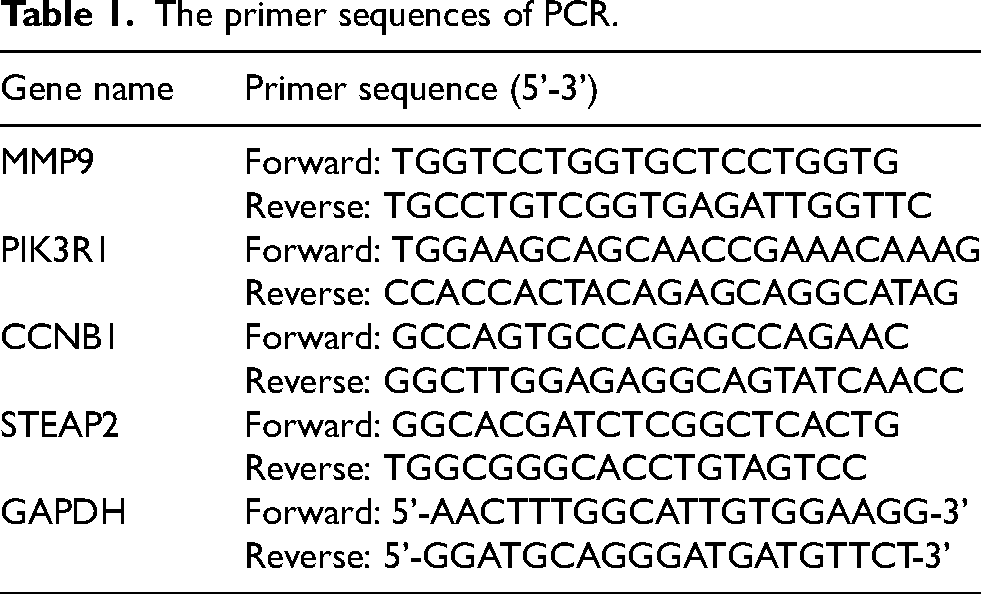
Trizol reagent (Accurate Biology, Hunan, China) was used to isolate total RNA from tissues. cDNA was synthesized through reverse transcription employing Evo-M-MLV RT Kit II (inclusive of gDNA removal reagent) (Accurate Biology, Hunan, China). PCR was conducted utilizing SYBR Green qPCR Mix fluorescence quantitative PCR kit (Biosharp, China) with GAPDH serving as the internal reference. The qRT-PCR amplification procedure was performed in the following three-step: pre-denaturation at 95°C for 5 min once, followed by 45 cycles (denaturation at 95°C for 15 s, annealing at 55–65°C for 30 s), and extension at 72°C for 30 s. Relative expression levels of target genes were detected by the Bio-RadCFX96 Touch (Bio-RAD, USA) and analyzed using ΔΔCT method. The primer sequences (Ruibo Biotechnology Co., Ltd, China) were shown in Table 1.
The primer sequences of PCR.
Statistical analysis
All the statistical analyses were carried out by using R software (version 4.2.0). The experimental data were analyzed and the statistical charts were drawn by using GraphPad (version 9.5.0) and Image J (version 1.53e) software. A P value < 0.05 was regarded as statistically significant.
Results
Single-Cell RNA-seq spectrum analysis and trajectory analysis
Following quality control measures based on the criteria of nFeature_RNA values between 100 and 5000 and a percentage of mitochondrial genes below 15%, a total of 2315 cells were isolated for subsequent analysis of this specific feature. The expression profiles from five neuroblastoma-related tissue samples in the GSE192906 dataset were utilized for this analysis (Figure 2A, B). Principal Component Analysis (PCA) was performed to reduce the dimensionality of the samples, revealing a dispersed yet coherent distribution of single-cell samples (Figure 2C). The optimal number of principal components (PCs) was determined to be 7 based on the Elbow Plot analysis (Figure 2D).
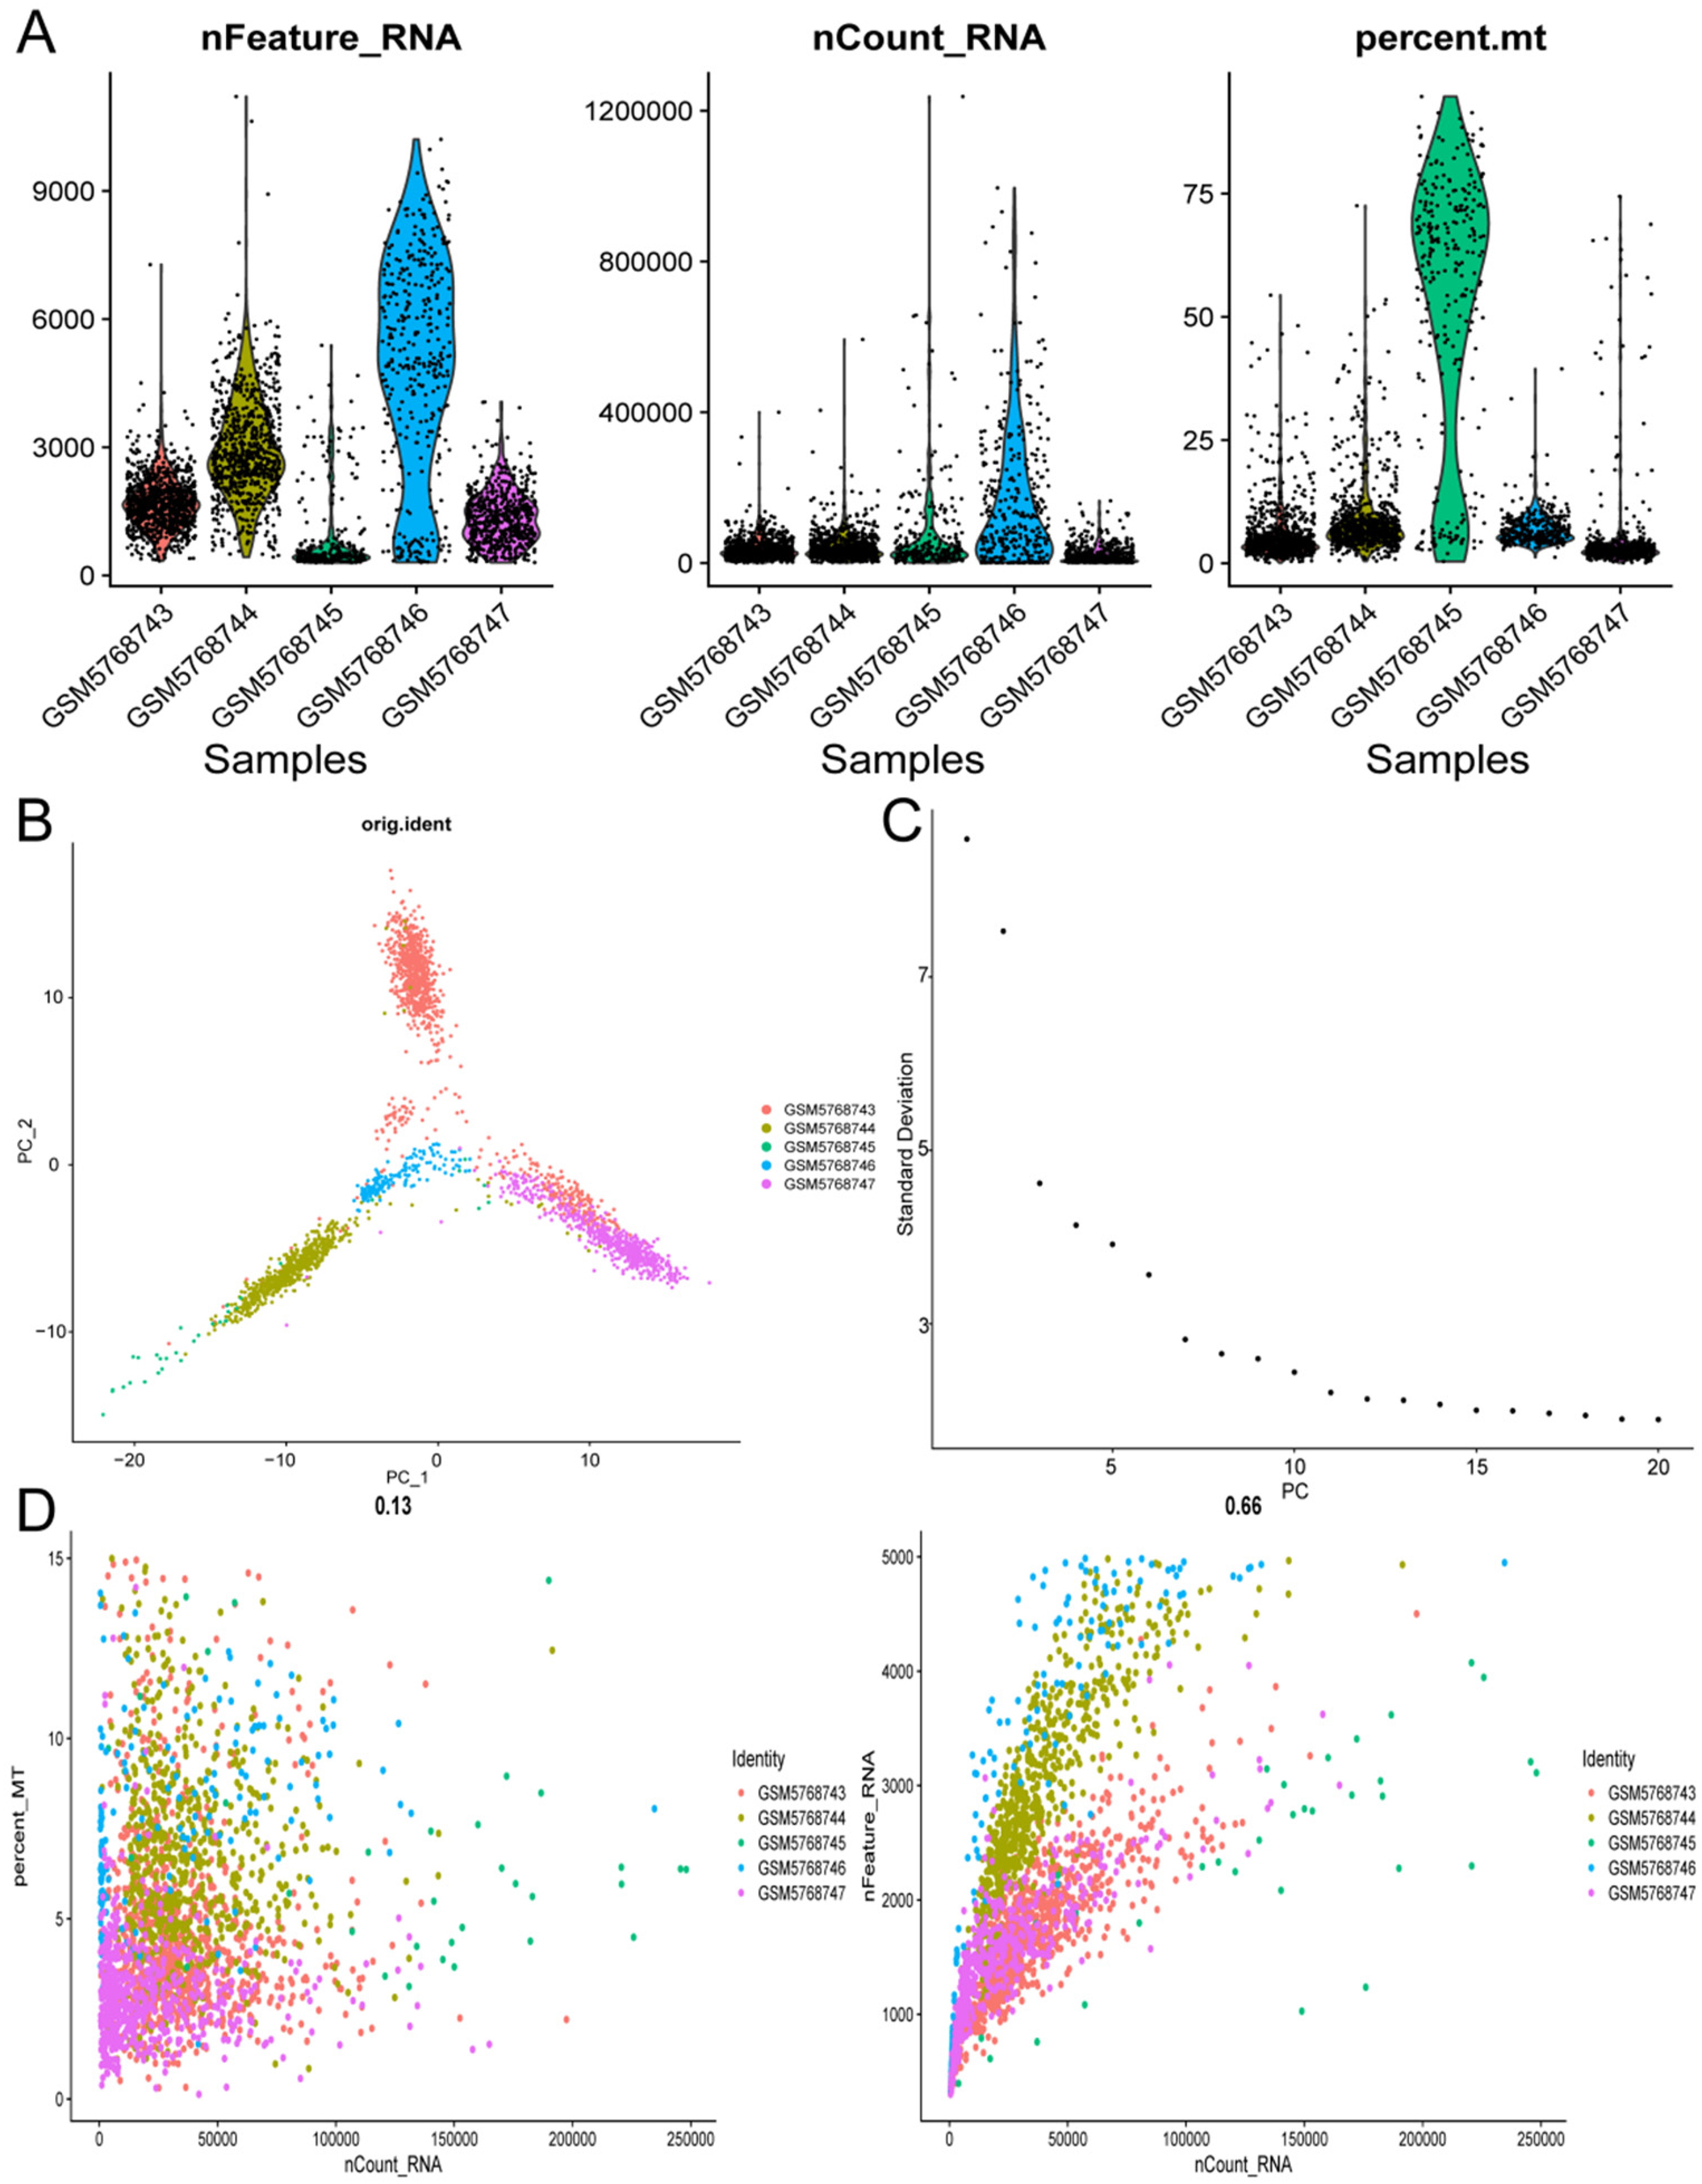
The preprocessing of single-cell expression profiles (A), (B). A total of 5 NB-related tissue samples were included, containing 2315 cells after quality control (C), (D). Principal Component Analysis (PCA) was utilized to identify the essential dimensions within the dataset, and the optimal number of principal components determined was 7.
The FindClusters function was employed to perform dimensionality reduction clustering based on varying resolution parameters. Clustering outcomes were evaluated at different resolution settings, and their associations were compared (Figure 3A). When the resolution parameter was set to 1, 15 distinct cell clusters were identified (Figure 3B). When the resolution parameter was adjusted to 0.2, 7 cell clusters were distinguished (Figure 3C). Subsequently, differential gene expression analysis was carried out for each subtype using R package SingleR and FindAllMarkers, and cell annotations were conducted utilizing the CellMarker database. 7 annotated cell types were discovered: cancer cells, fibroblasts, macrophages, monocytes, T-cells, epithelial cells, and Schwannian stroma (Figure. 3D).
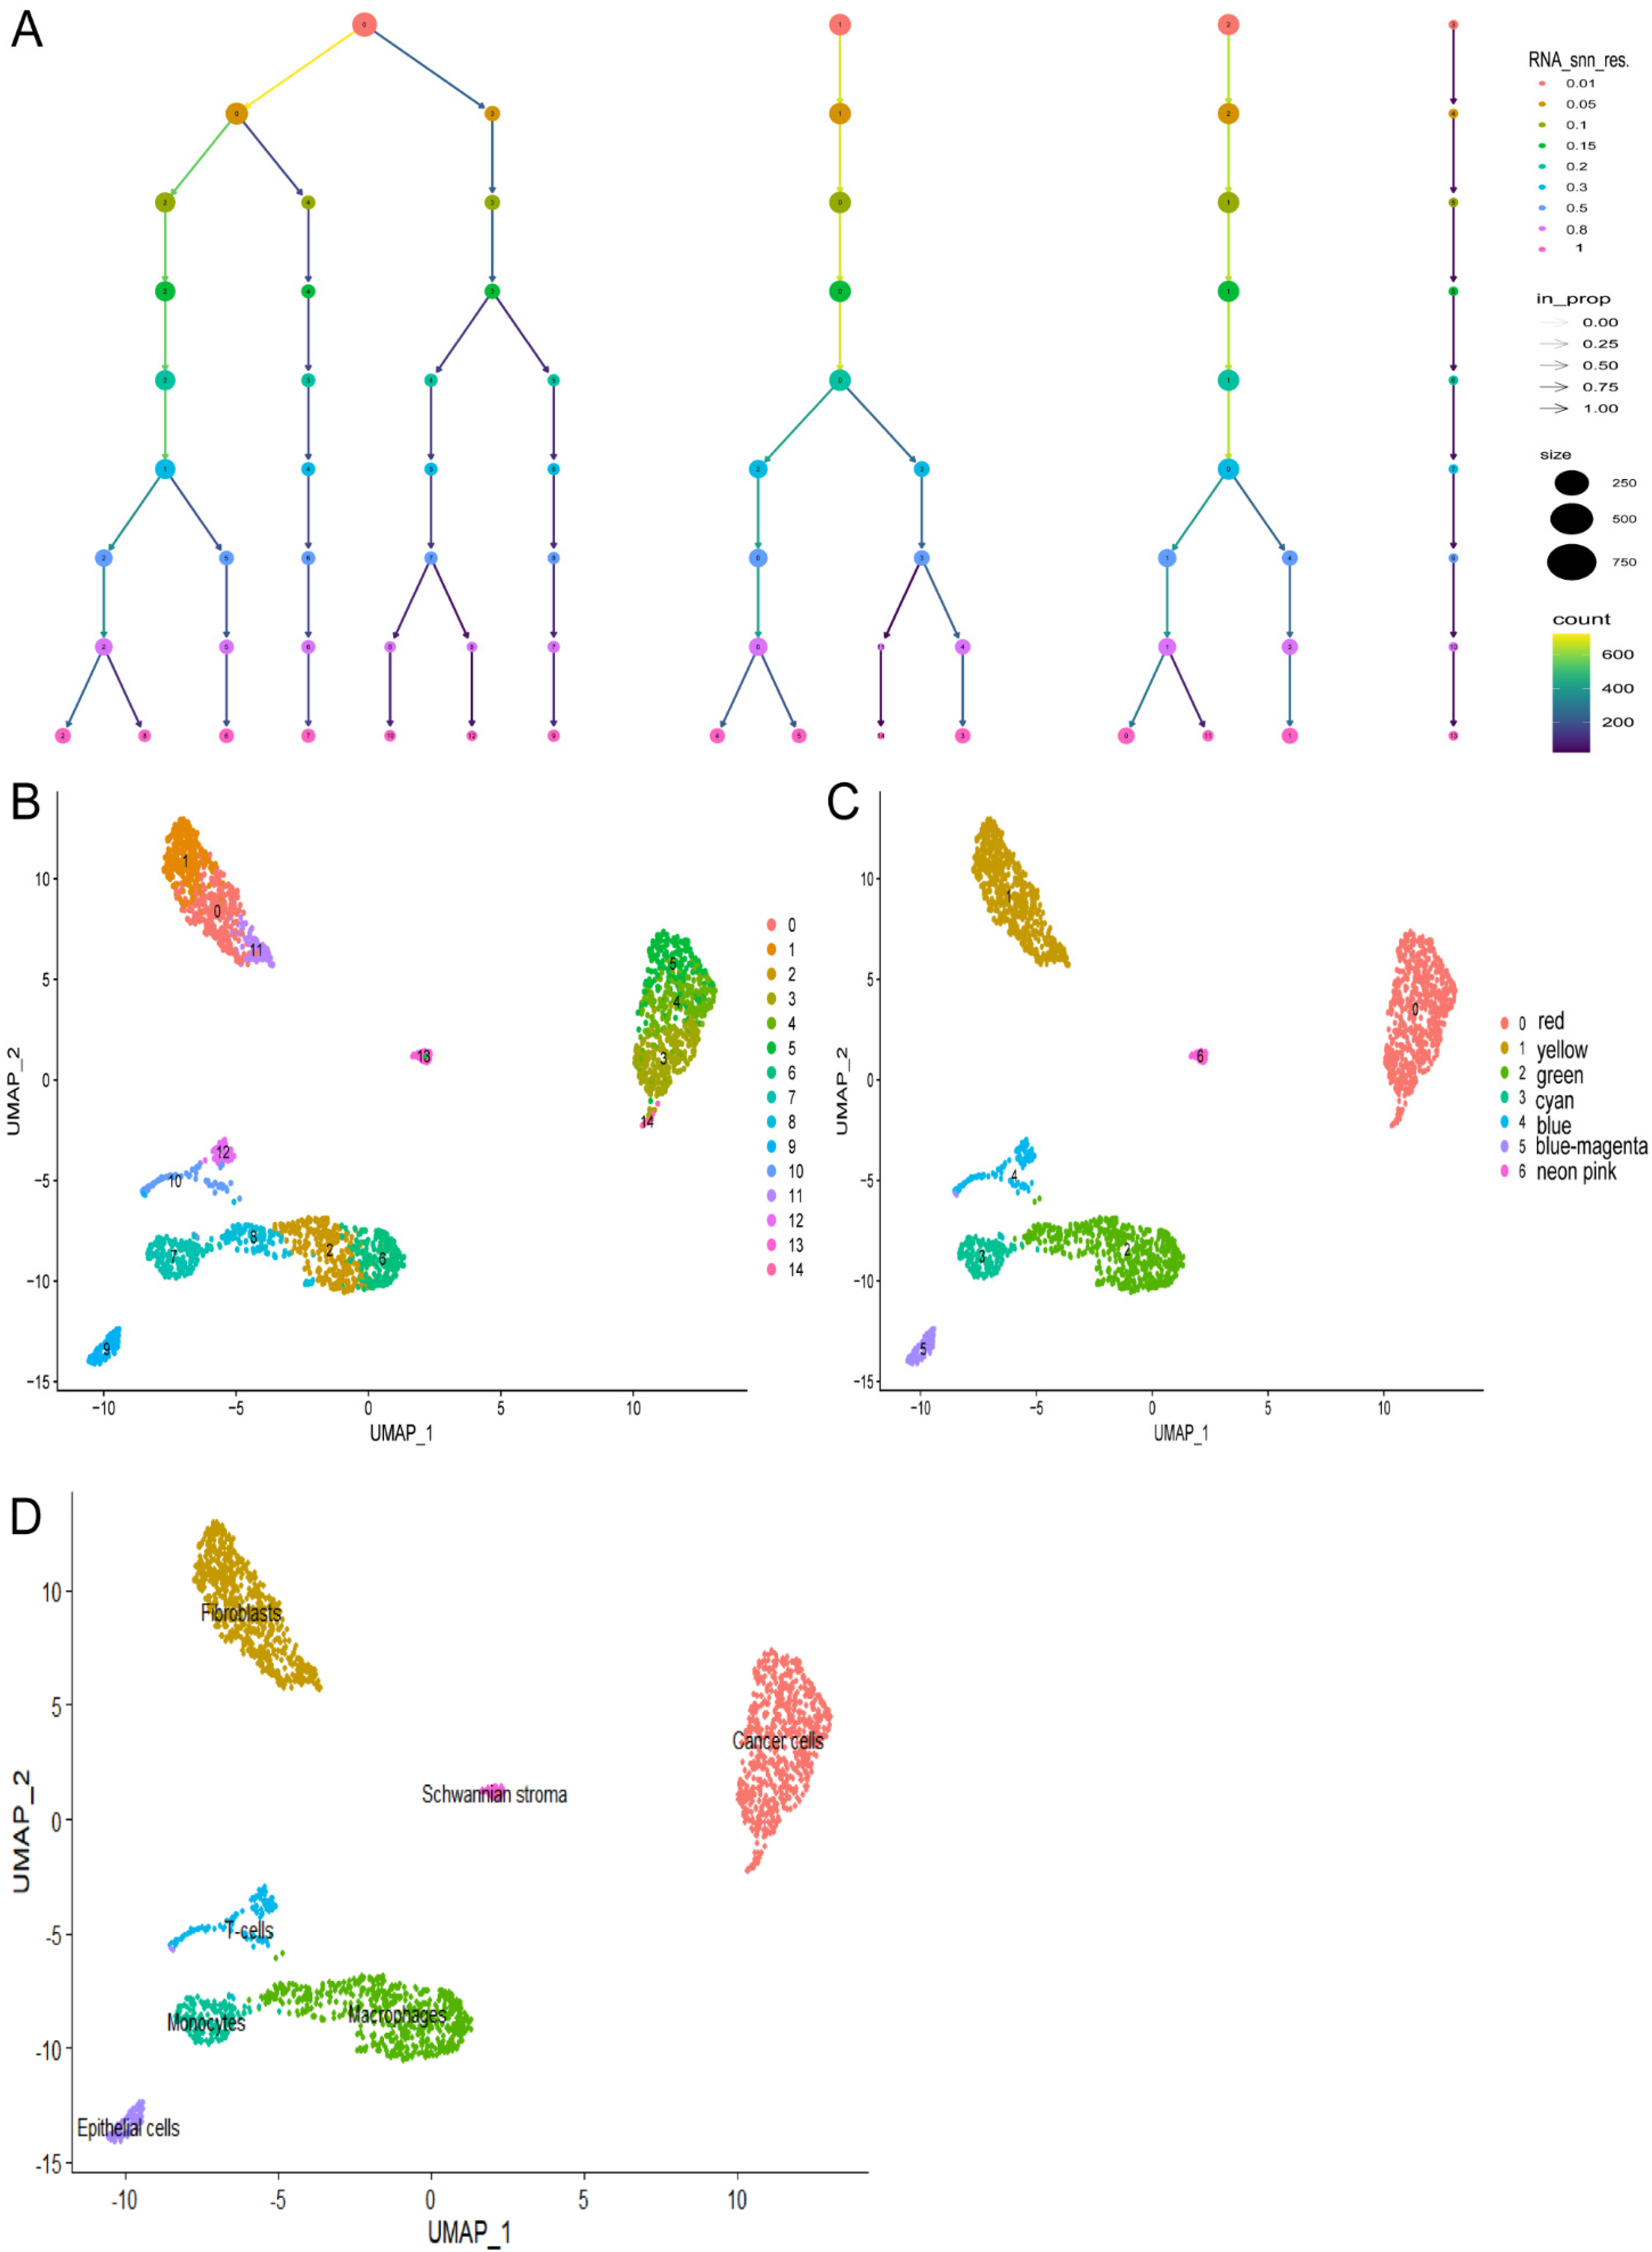
The subtyping and dimensionality reduction clustering analysis of single-cell samples (A). The clustering results at different resolution parameters using Clustree (B). The t-SNE algorithm based on the important components available in PCA, with a resolution of 1, results in the classification of 2315 cells into 15 cell clusters (C). The classification of 7 cell clusters at a resolution of 0.2 (D). The 7 clusters were assigned to 7 cell types: cancer cells (red), fibroblasts (yellow), macrophages (green), monocytes (cyan), T-cells (blue), epithelial cells (blue-magenta), and Schwannian stroma (neon pink).
The single-cell RNA sequencing data were imported into the software using the CellChat feature. Seven clustered cell types were then analyzed to compute the probabilities of intercellular communication, with a focus on events occurring in at least 10 cells. The findings revealed that fibroblasts within the neuroblastoma microenvironment exhibited significantly elevated levels of both the frequency and strength of cell interactions, highlighting their active role in the neuroblastoma microenvironment (Figure 4A). Bubble charts effectively illustrated the communication dynamics between fibroblasts and other cell types, including epithelial cells, cancer cells, macrophages, and T cells. The results indicated a tightly interconnected relationship mediated by specific ligand-receptor pairs between fibroblasts and these cell types (Figure 4B).
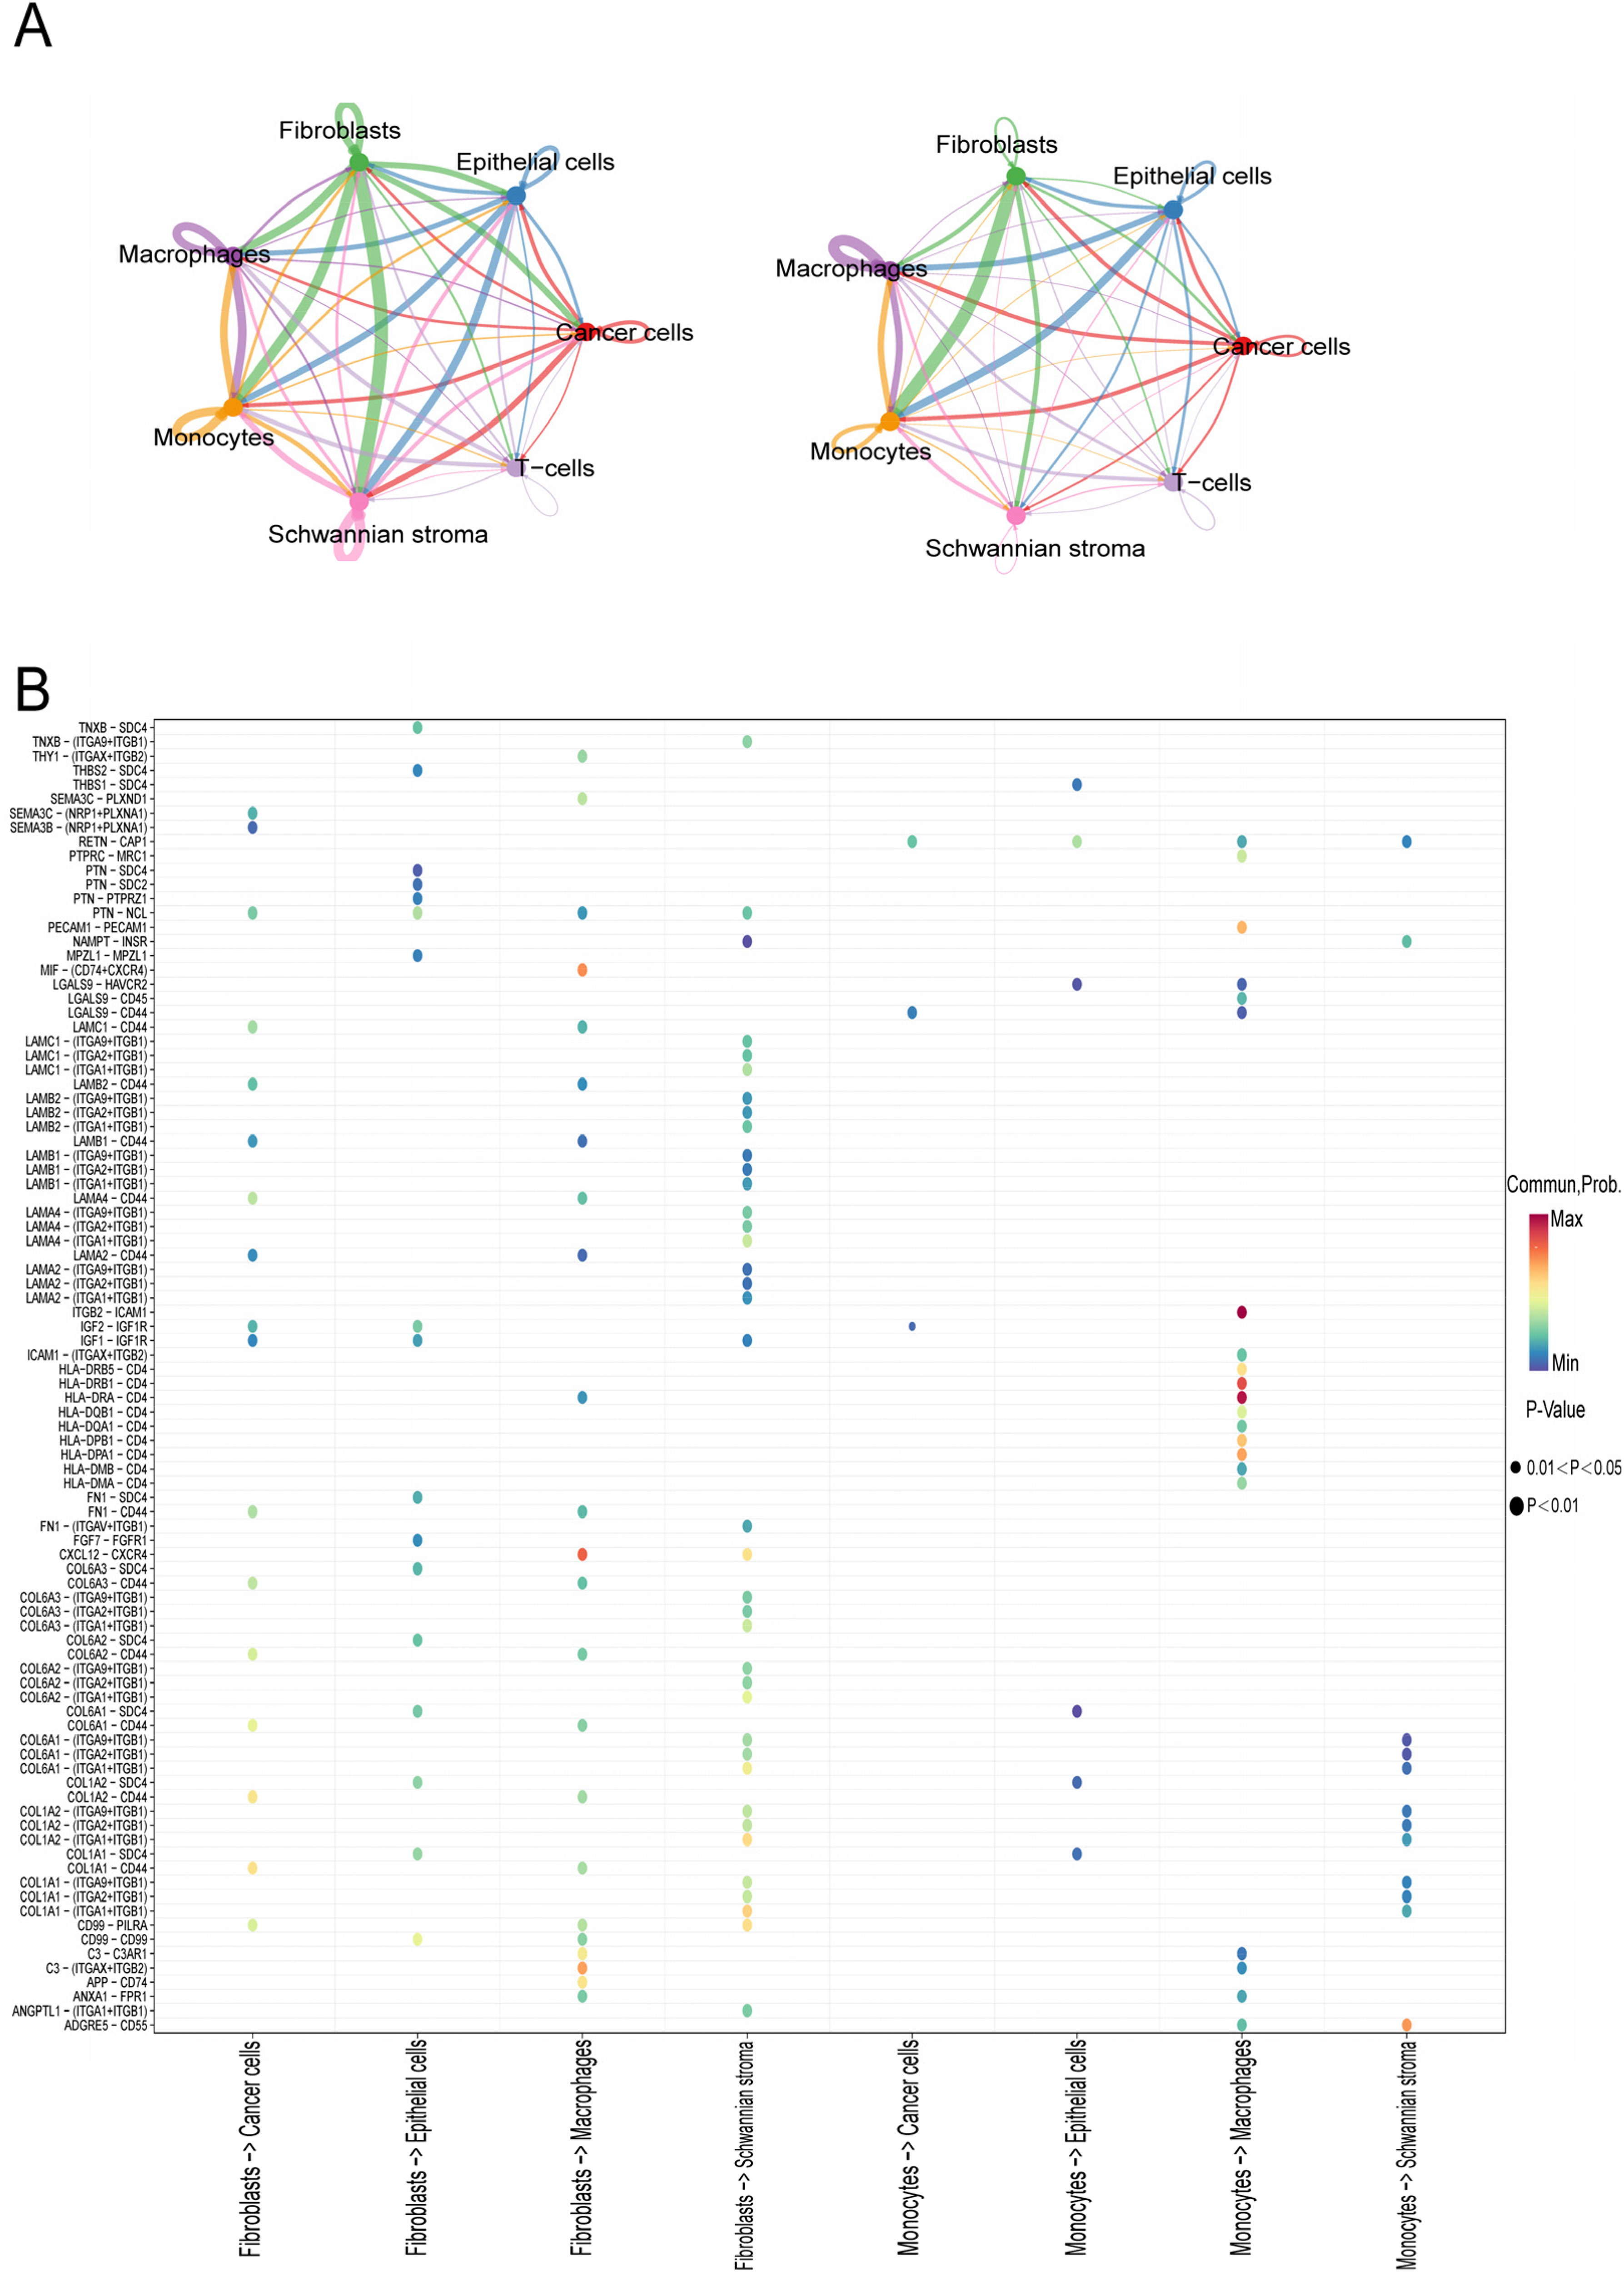
Communication analysis using the CellChat function (A). The number of interactions and their weights between different cells (B). The ligand-receptor interactions among cell nodes were visualized through bubble network visualization.
Differential gene analysis and enrichment analysis
The training dataset GSE49710 comprised samples from INSS stages 1 and 4, totaling 301 samples divided into two cohorts: 181 samples in stage 4 and 120 samples in stage 1. A differential gene expression analysis was conducted using a two-fold change criterion, identifying 1696 DEGs, including 131 upregulated and 1565 downregulated genes (Figure 5A-B). These DEGs were then intersected with 759 CAF-related genes obtained from GeneCards, resulting in the identification of 81 hub genes (Figure 5C).
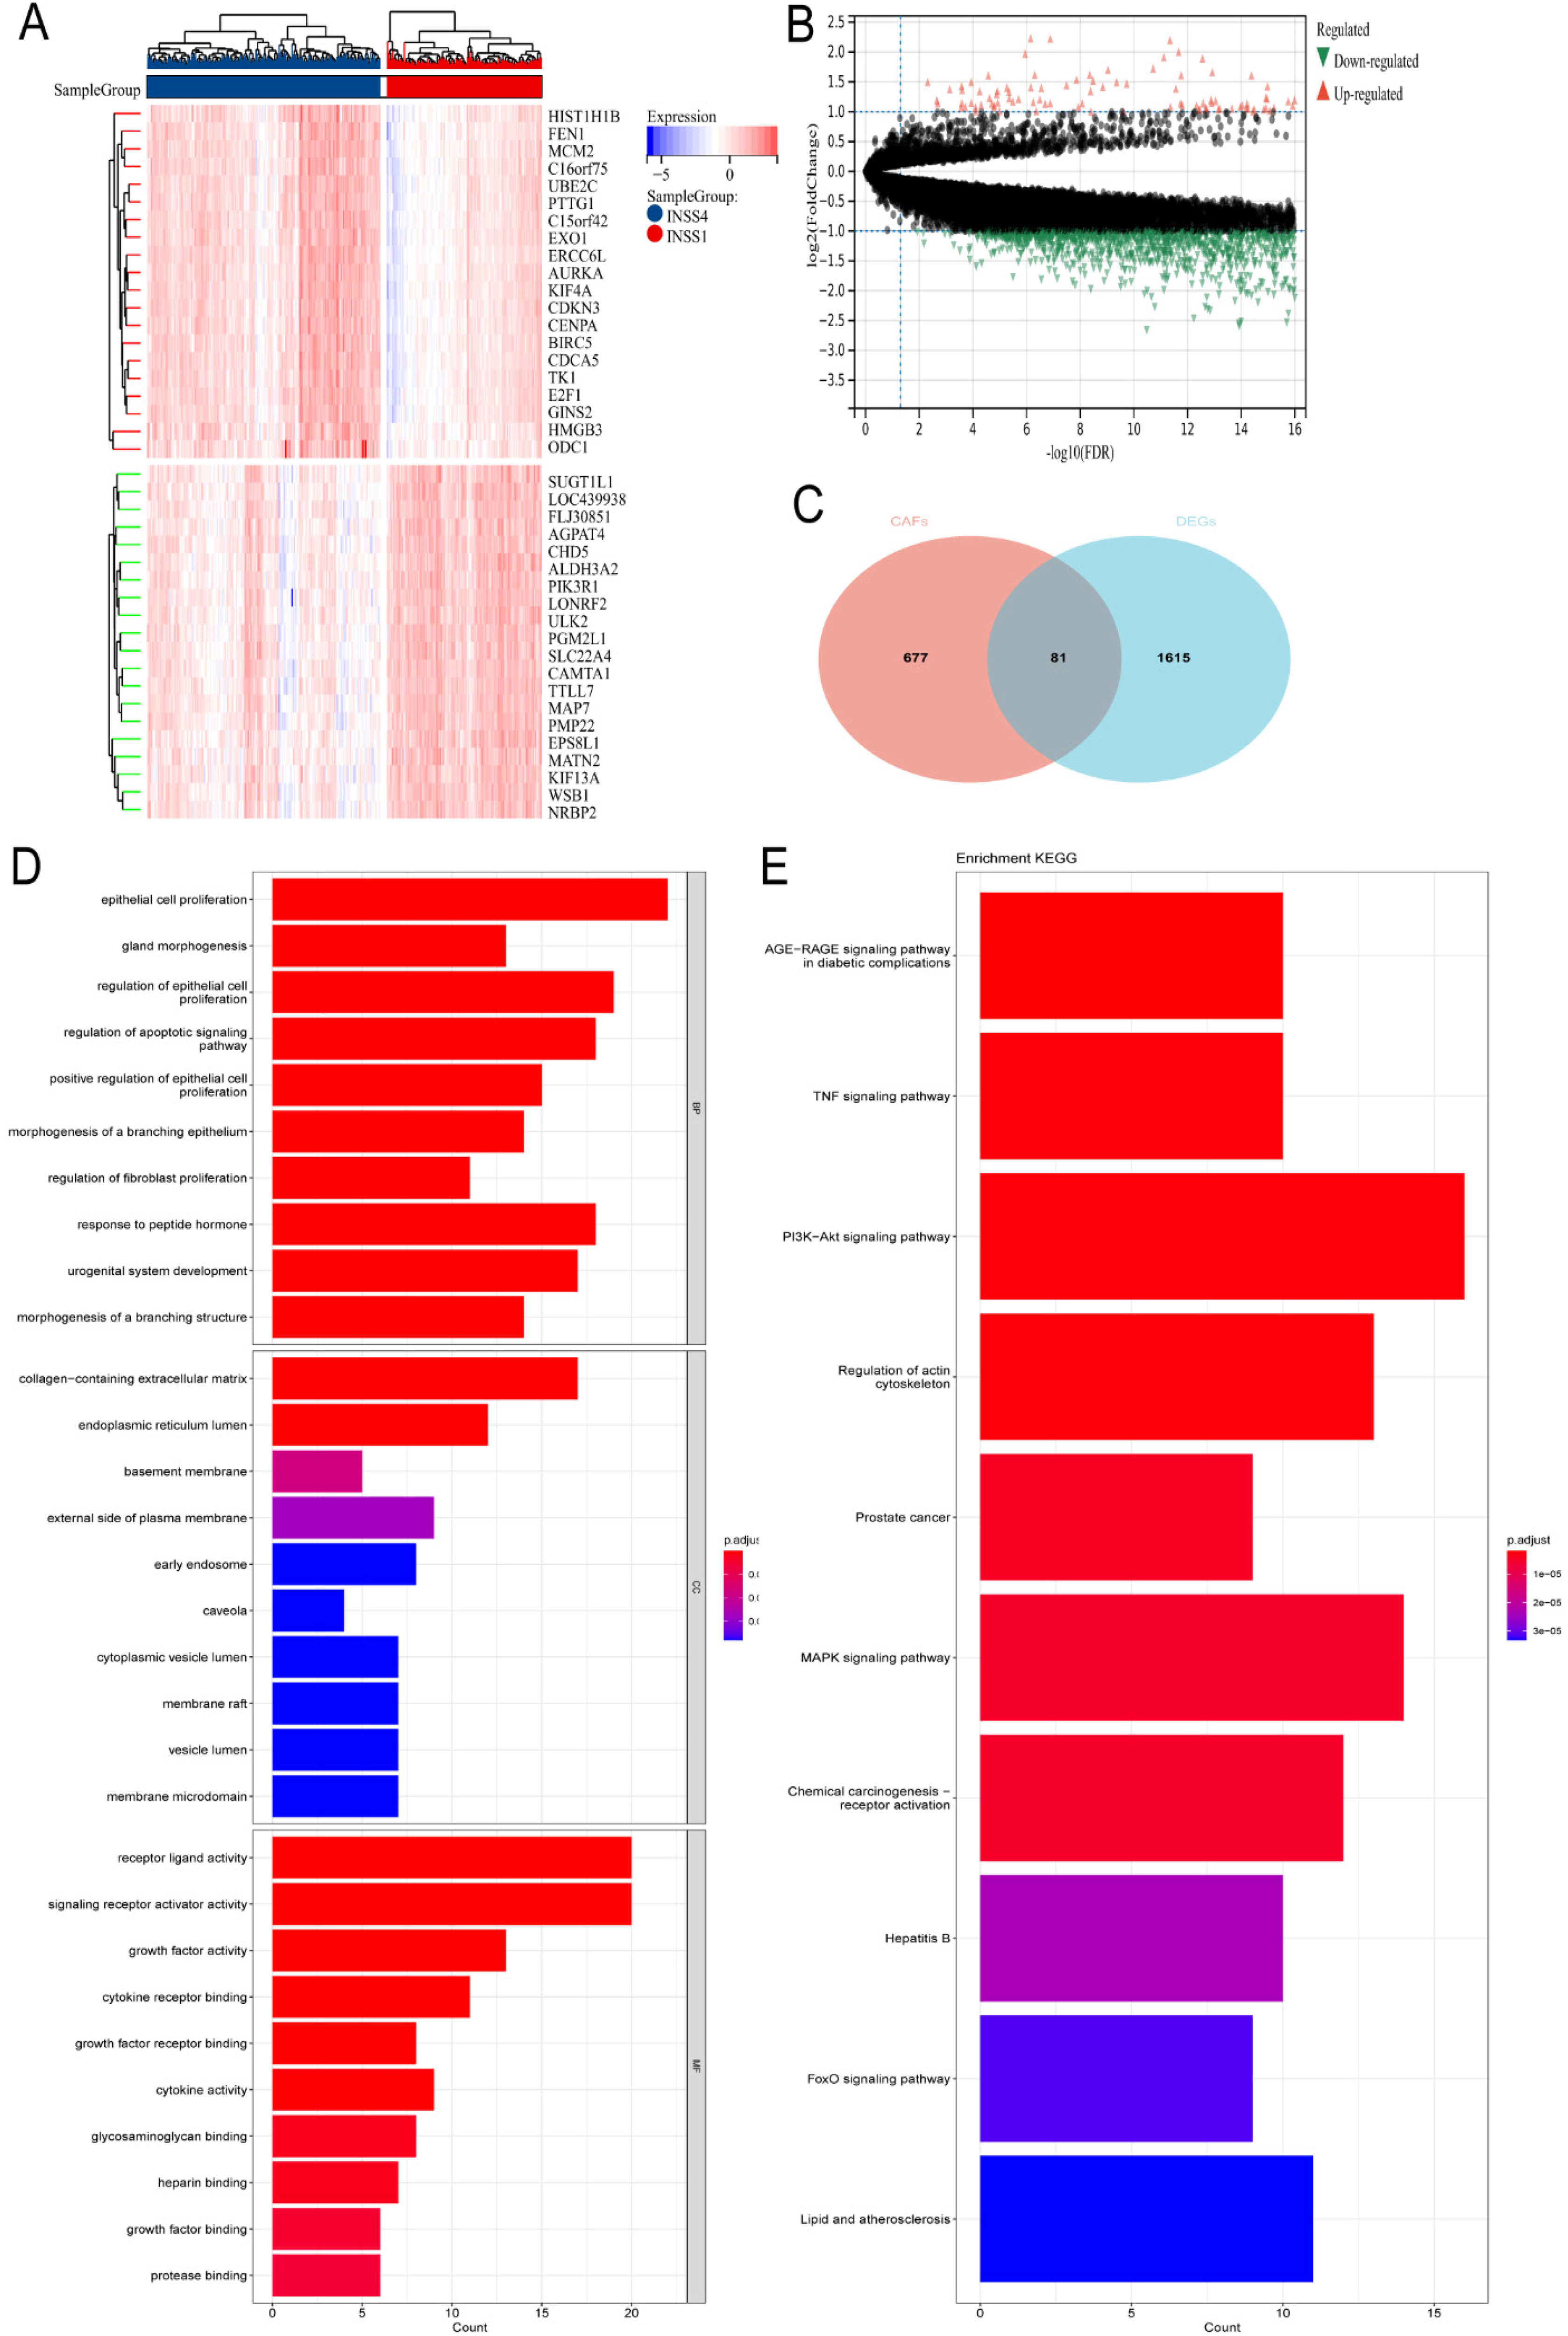
Differential genes analysis and enrichment analysis (A). Heatmap showed genes with a two-fold difference between INSS stage 1 and stage 4 (B). Volcano plot illustrated genes with a two-fold difference between INSS stage 1 and stage 4 (C). Venn diagram showed genes with a two-fold difference between INSS stage 1 and stage 4 that intersect with CAFs (D), (E). GO and KEGG enrichment analysis.
Go enrichment analysis showed significant enrichment in biological processes (BP), cellular components (CC), and molecular functions (MF) related to the regulation of proliferation in epithelial cells and fibroblasts, extracellular matrix containing collagen, and receptor-ligand activity (Figure 5D). Additionally, KEGG pathway analysis demonstrated that the hub genes were primarily associated with pathways such as the TNF signaling pathway, regulation of the actin cytoskeleton, and the PI3K-Akt signaling pathway (Figure 5E).
Construction of prognostic features of CAF-s genes
The predictive value of CAFs markers on survival outcomes of NB was explored using univariate Cox analysis to identify 81 prognostic-related genes. The selection criteria involved a significance threshold of p-value <0.05, and the top 20 most significant genes were identified for subsequent forest plot analysis (Supplementary Figure 1A). Following this, Least Absolute Shrinkage and Selection Operator (LASSO) regression analysis was applied to analyze the expression profiles of the CAF-related prognostic genes, resulting in the identification of 13 genes based on a λ value of 0.0309. These genes included FGF10, MMP9, PIK3R1, TWIST1, PTN, STEAP2, CDKN3, BMP7, CCNB1, NTRK1, BLM, and APOA1 (Supplementary Figure 1B).
After conducting random forest analysis, the optimal parameters and decision tree numbers for the 13 identified genes were determined. The analysis focused on genes with an importance ranking >0.7. Consequently, PIK3R1, CCNB1, MMP9, and STEAP2 were finally selected (Supplementary Figure 1C-D). Then, a multifactorial Cox method was employed to assess the prognostic significance of these four genes in GSE49710. The results revealed that PIK3R1 and MMP9 genes exhibit protective effects in NB, while CCNB1 and STEAP2 genes are associated with increased risk.
A risk scoring model was constructed based on the formula: Risk Score = -0.586PIK3R1 + 0.685CCNB1 - 0.150MMP9 + 0.109STEAP2 (Figure 6A). NB patients in the training set were divided into low-risk and high-risk groups according to the percentile (50%). Further analysis using the R package “survival” revealed significant differences in prognosis between the two groups, with a log-rank test demonstrating substantial prognostic distinctions between the sample groups (p = 9.7e-29) (Figure 6B). Analysis of the relationship between various risk scores and patient follow-up time, events, and changes in gene expression revealed that as the risk score increased, patient survival rates significantly decreased. Moreover, an escalation in risk scores correlated with reduced expression of the PIK3R1 and MMP9 genes, while the expression of CCNB1 and STEAP2 increased (Figure 6C). The diagnostic value of the risk model for predicting 1-year, 3-year, and 5-year survival rates in the GSE49710 dataset was found to be 0.88, 0.91, and 0.92, respectively (Figure 6D).
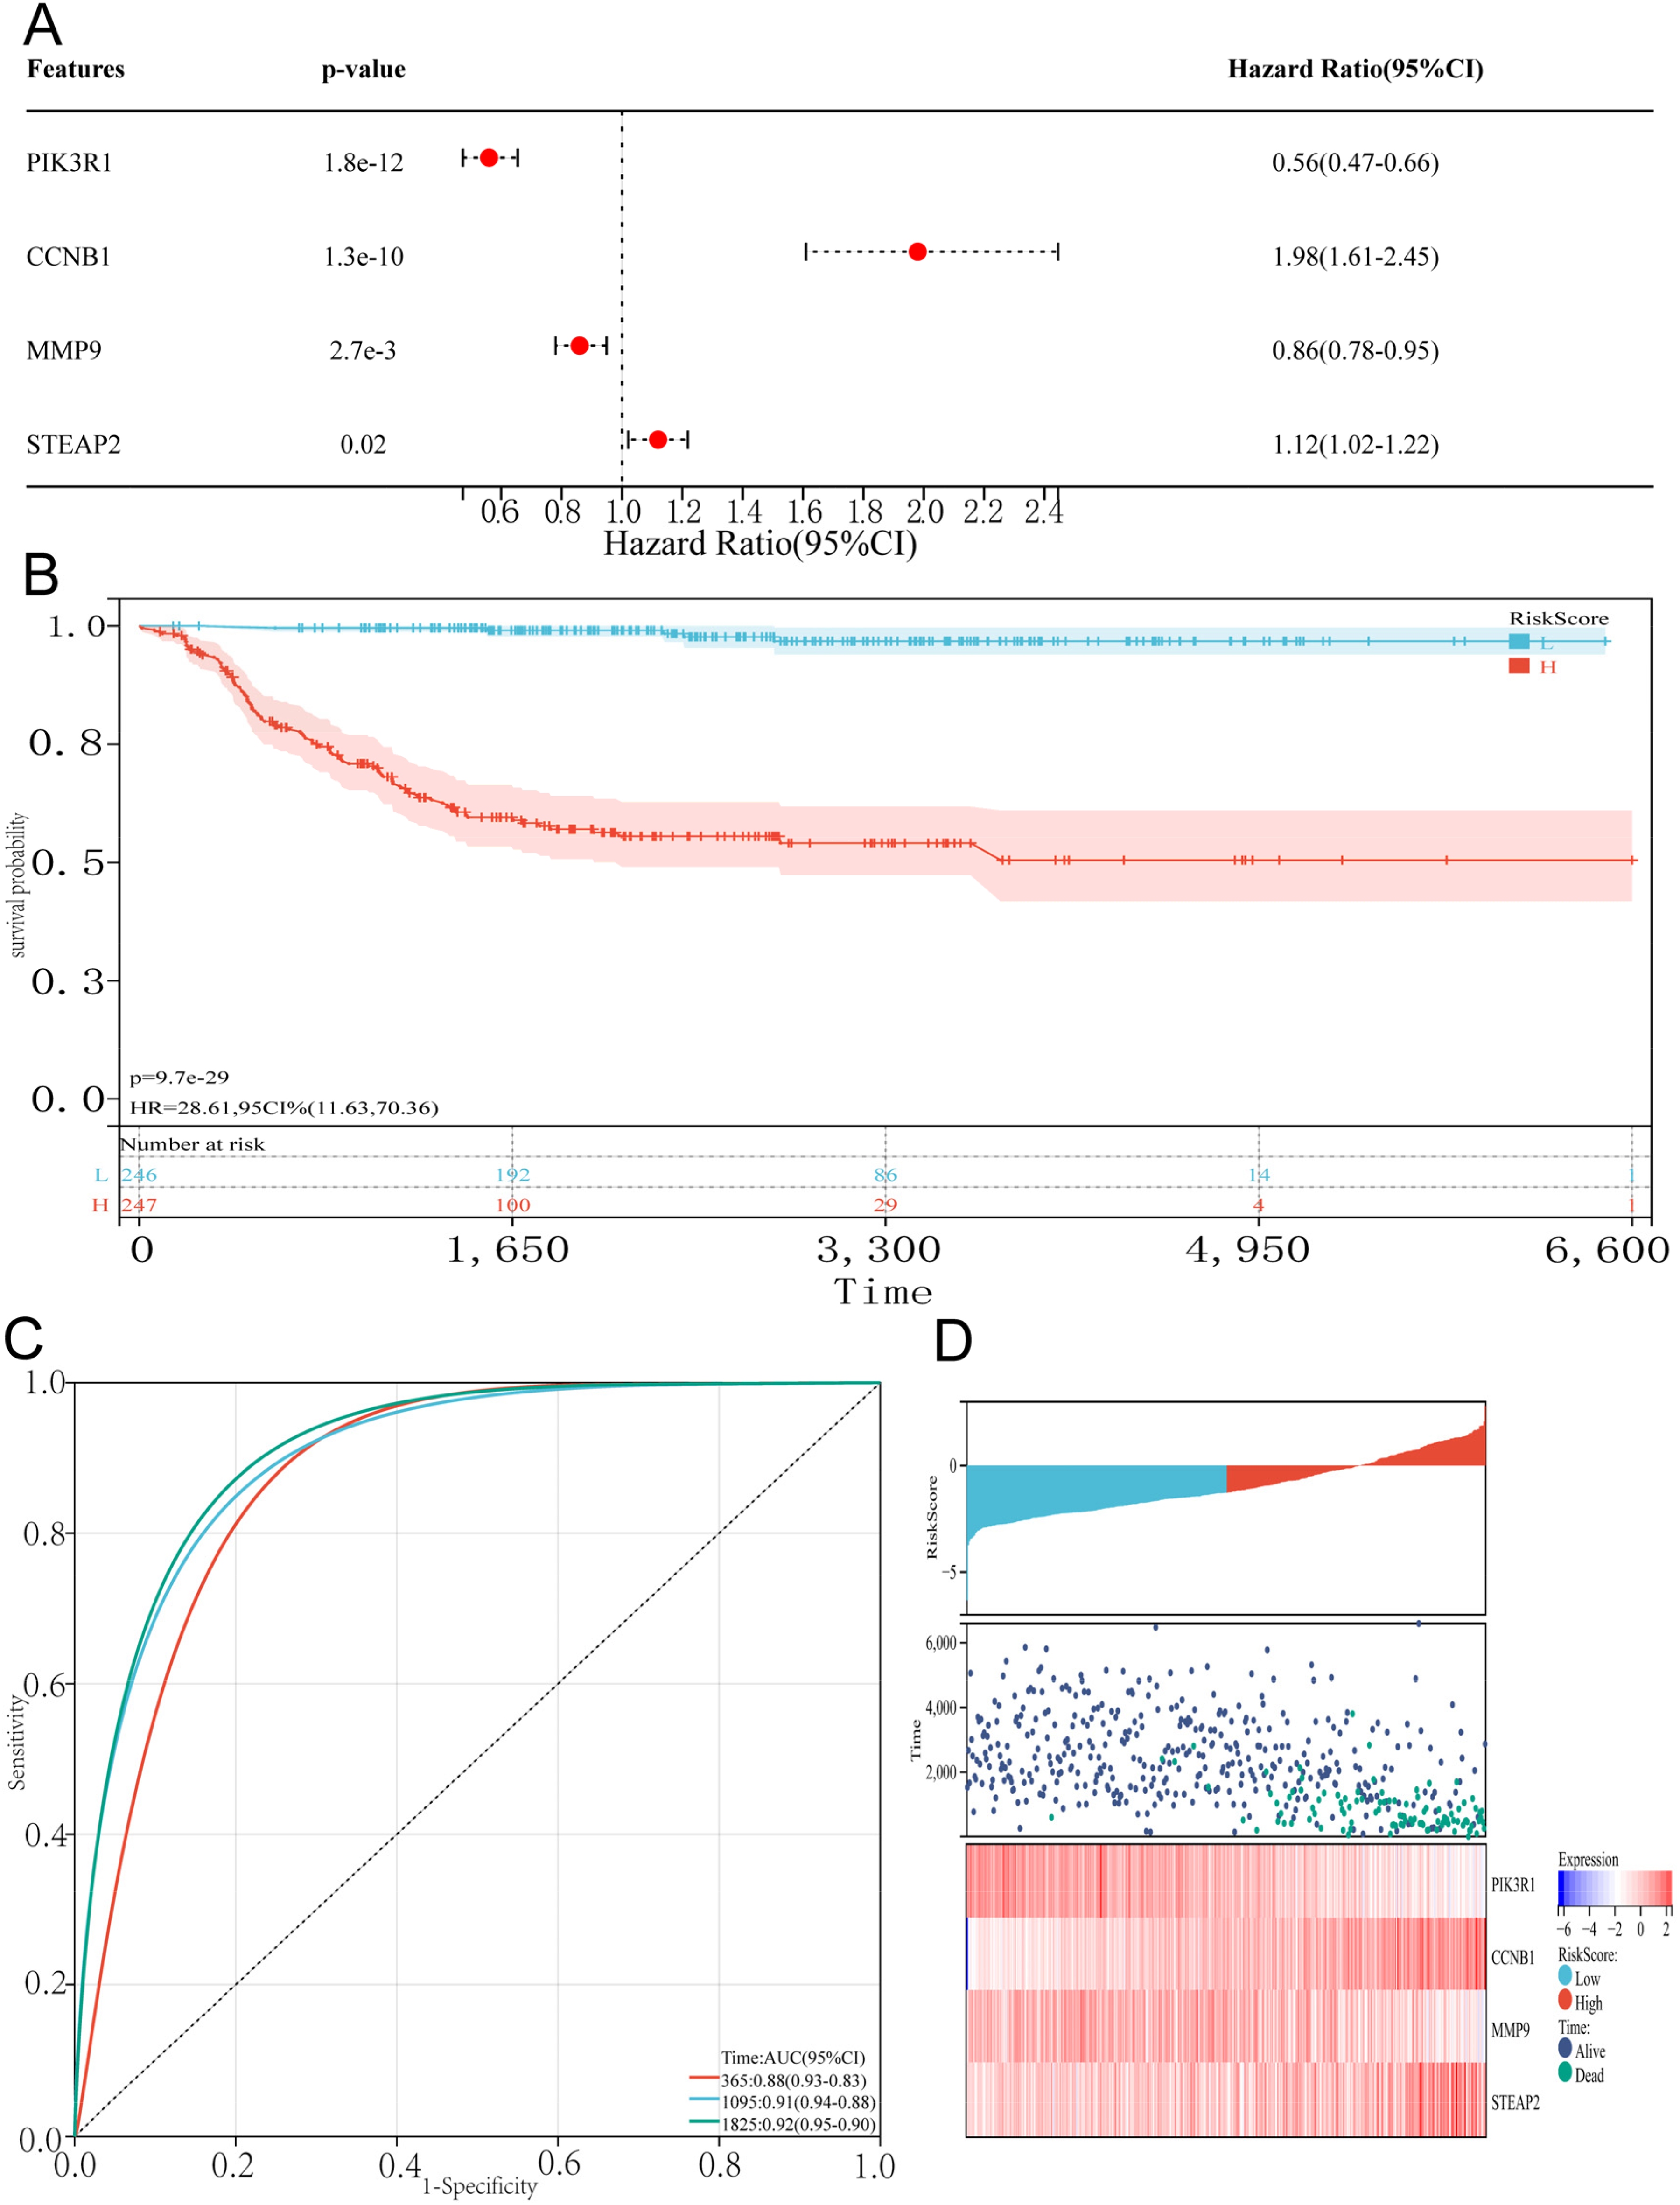
Construction of prognostic features of CAF-s genes (A). Multivariable Cox analysis was used to establish a prognostic model (B). Based on the median risk score, GSE49710 was divided into low-risk and high-risk groups, and Kaplan survival analysis was conducted to demonstrate the differences in overall survival between the two groups (C). A heatmap of gene expression was drawn based on risk score ranking, survival status, and prognostic analysis (D). Prognostic model ROC curves were created for 1, 3, and 5-year survival.
Validation of prognostic features of CAF-s genes
The validation process involved the analysis of gene expression data from two different datasets, E-MTAB-8248 and Target-NB. Tissues were categorized into high-risk and low-risk groups based on their risk scores, revealing that the high-risk group had lower overall survival rates compared to the low-risk group. The Receiver Operating Characteristic Curves (ROC) analysis further indicated a good diagnostic accuracy of the risk model, with Area Under the Curve (AUC) values of 0.73, 0.74, and 0.77 for predicting 1-year, 3-year, and 5-year survival rates in NB patients from E-MTAB-8248 (Figure 7A). Similarly, the validation using gene expression profiles from Target-NB also demonstrated lower survival rates in the high-risk group, with AUC values of 0.66, 0.64, and 0.63 for predicting 1-year, 3-year, and 5-year survival rates (Figure 7B). These results suggested that the risk model had strong prognostic predictive capabilities for NB patients.
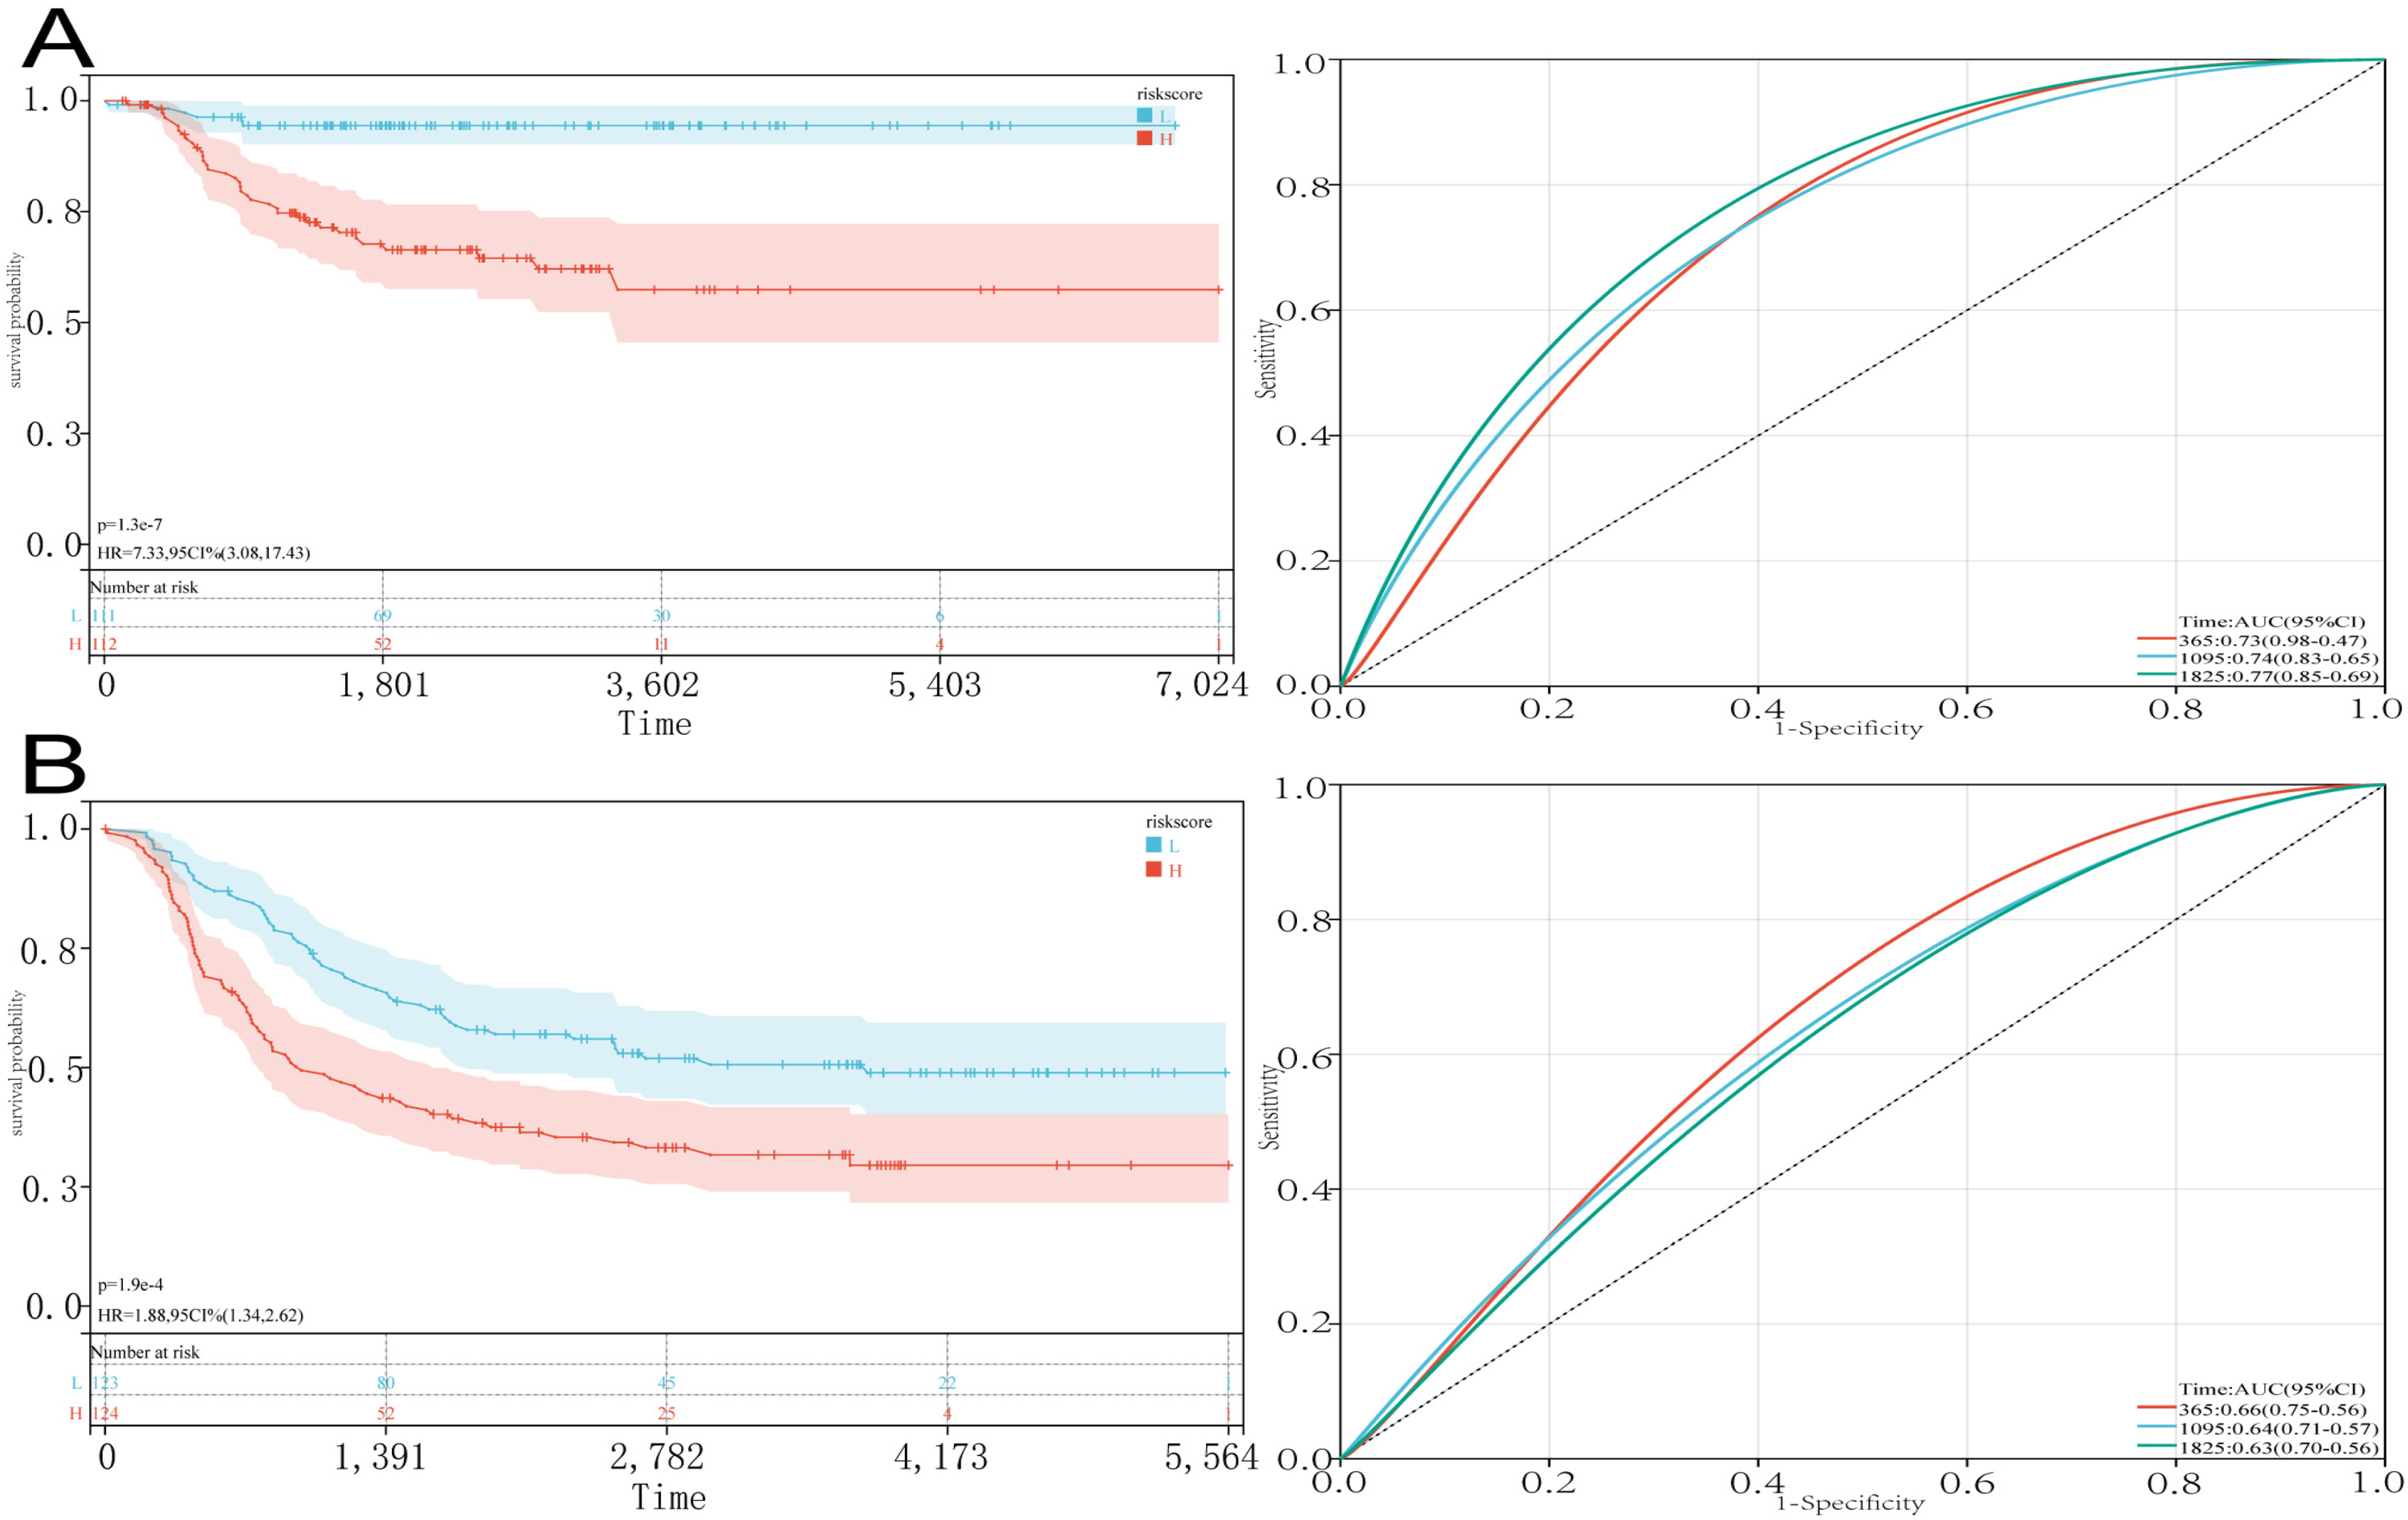
Validation of prognostic features of CAF-s genes (A). The test set E-MTAB-8248 was divided into low-risk and high-risk groups based on the median risk score for Kaplan survival analysis and ROC curves for 1, 3, and 5-year survival (B). the testing set Target-NB was divided into low-risk and high-risk groups based on the median risk score for Kaplan survival analysis, as well as ROC curves for 1, 3, and 5-year survival.
Construction of nomogram and correction curve
In the univariate Cox analysis, we found that all factors except gender were independent prognostic factors for NB (Figure 8A). The nomogram model was constructed using four factors: risk score, age, MYCN gene amplification status, and INSS stage (Figure 8B). The calibration graphs showed that the model has a high level of predicted accuracy (Figure 8C). Thus, our findings suggested that the nomogram was highly effective in predicting the overall survival for patients with NB.
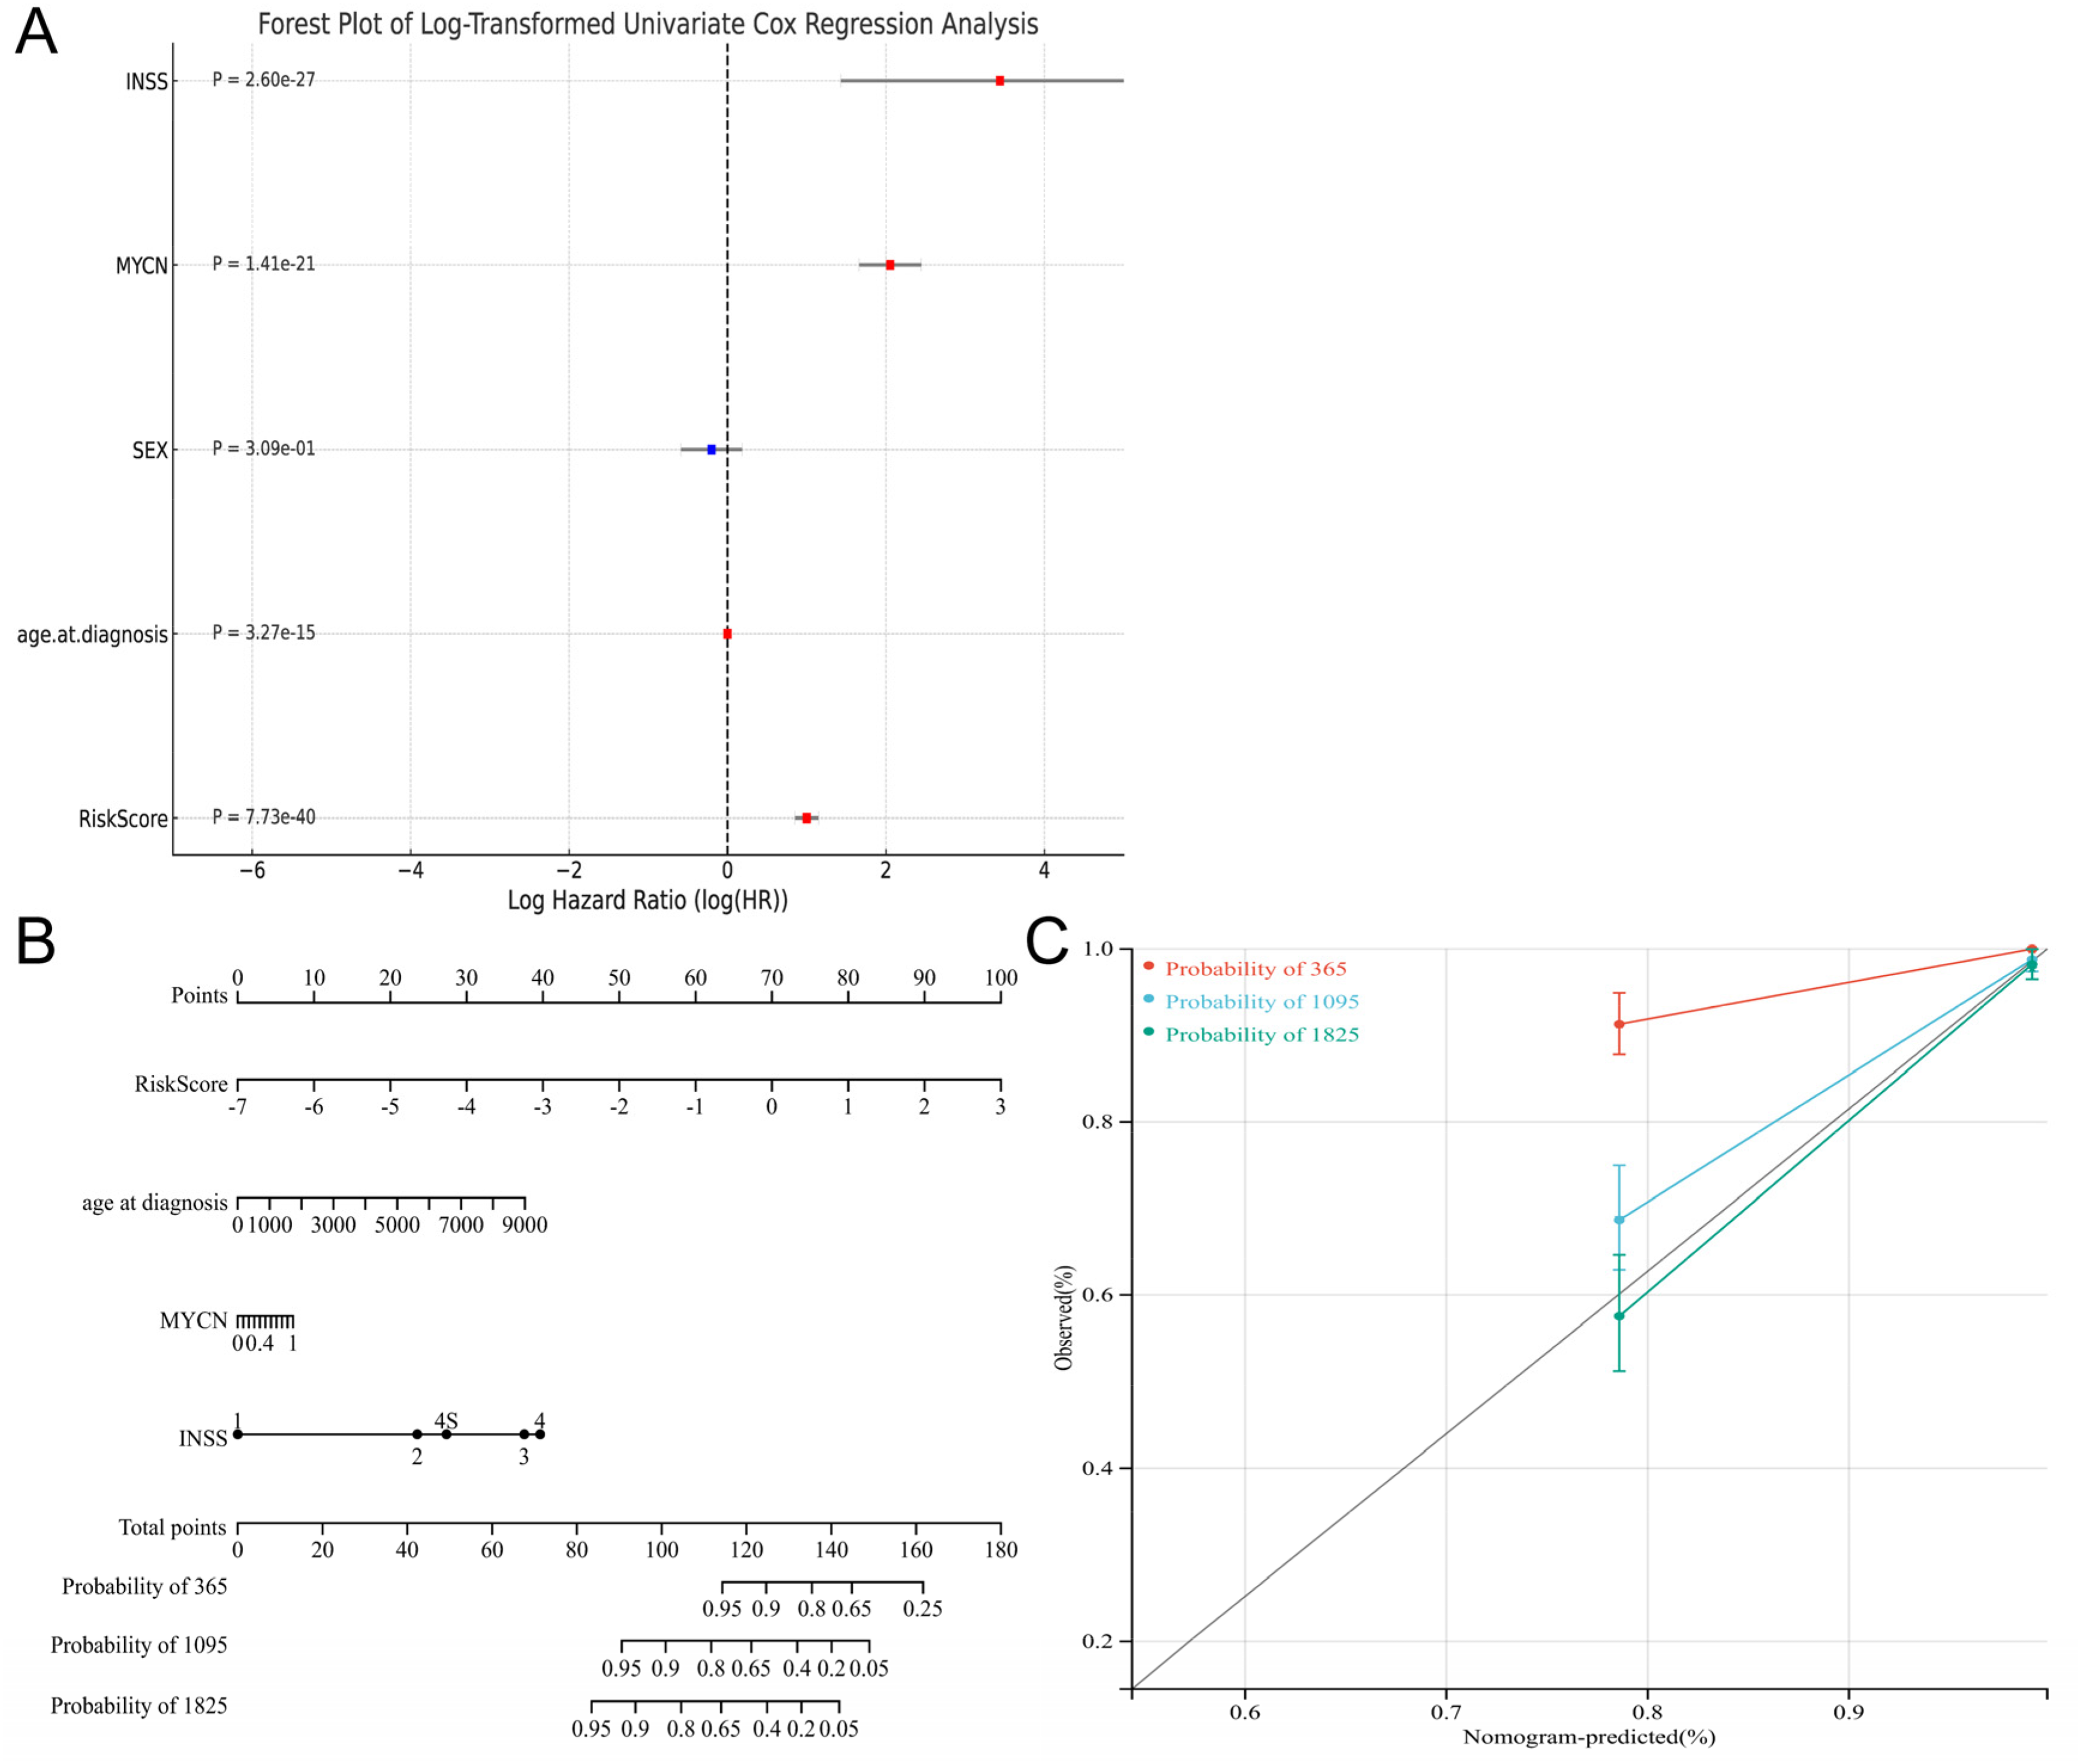
Multi-factor regression analysis based on GSE49710 (A). Univariate Cox analysis (B). The nomogram was drawn by integrating age, mycn amplification, INSS staging and risk scores (C). Correction curve of nomogram in 1-year, 3-year, and 5-year.
Analysis of immune cell infiltration
To compare immune cell infiltration and function across different risk groups, ssGSEA and ESTIMATE analyses were employed. The results revealed significant differences in immune cell infiltration scores and functional scores between the low-risk and high-risk groups. Specifically, the low-risk group exhibited higher levels of immune cell infiltration and superior immune cell functional scores (Figure 9A-B). Furthermore, the “Estimate” R package was utilized to assess the TME of high-risk and low-risk patients. The low-risk group demonstrated higher immuneScore, stromalScore, and estimateScore values, indicating a greater abundance of immune and stromal components within the TME. In contrast, the high-risk group showed lower scores in these metrics but had higher tumor purity (Figure 9C-D).
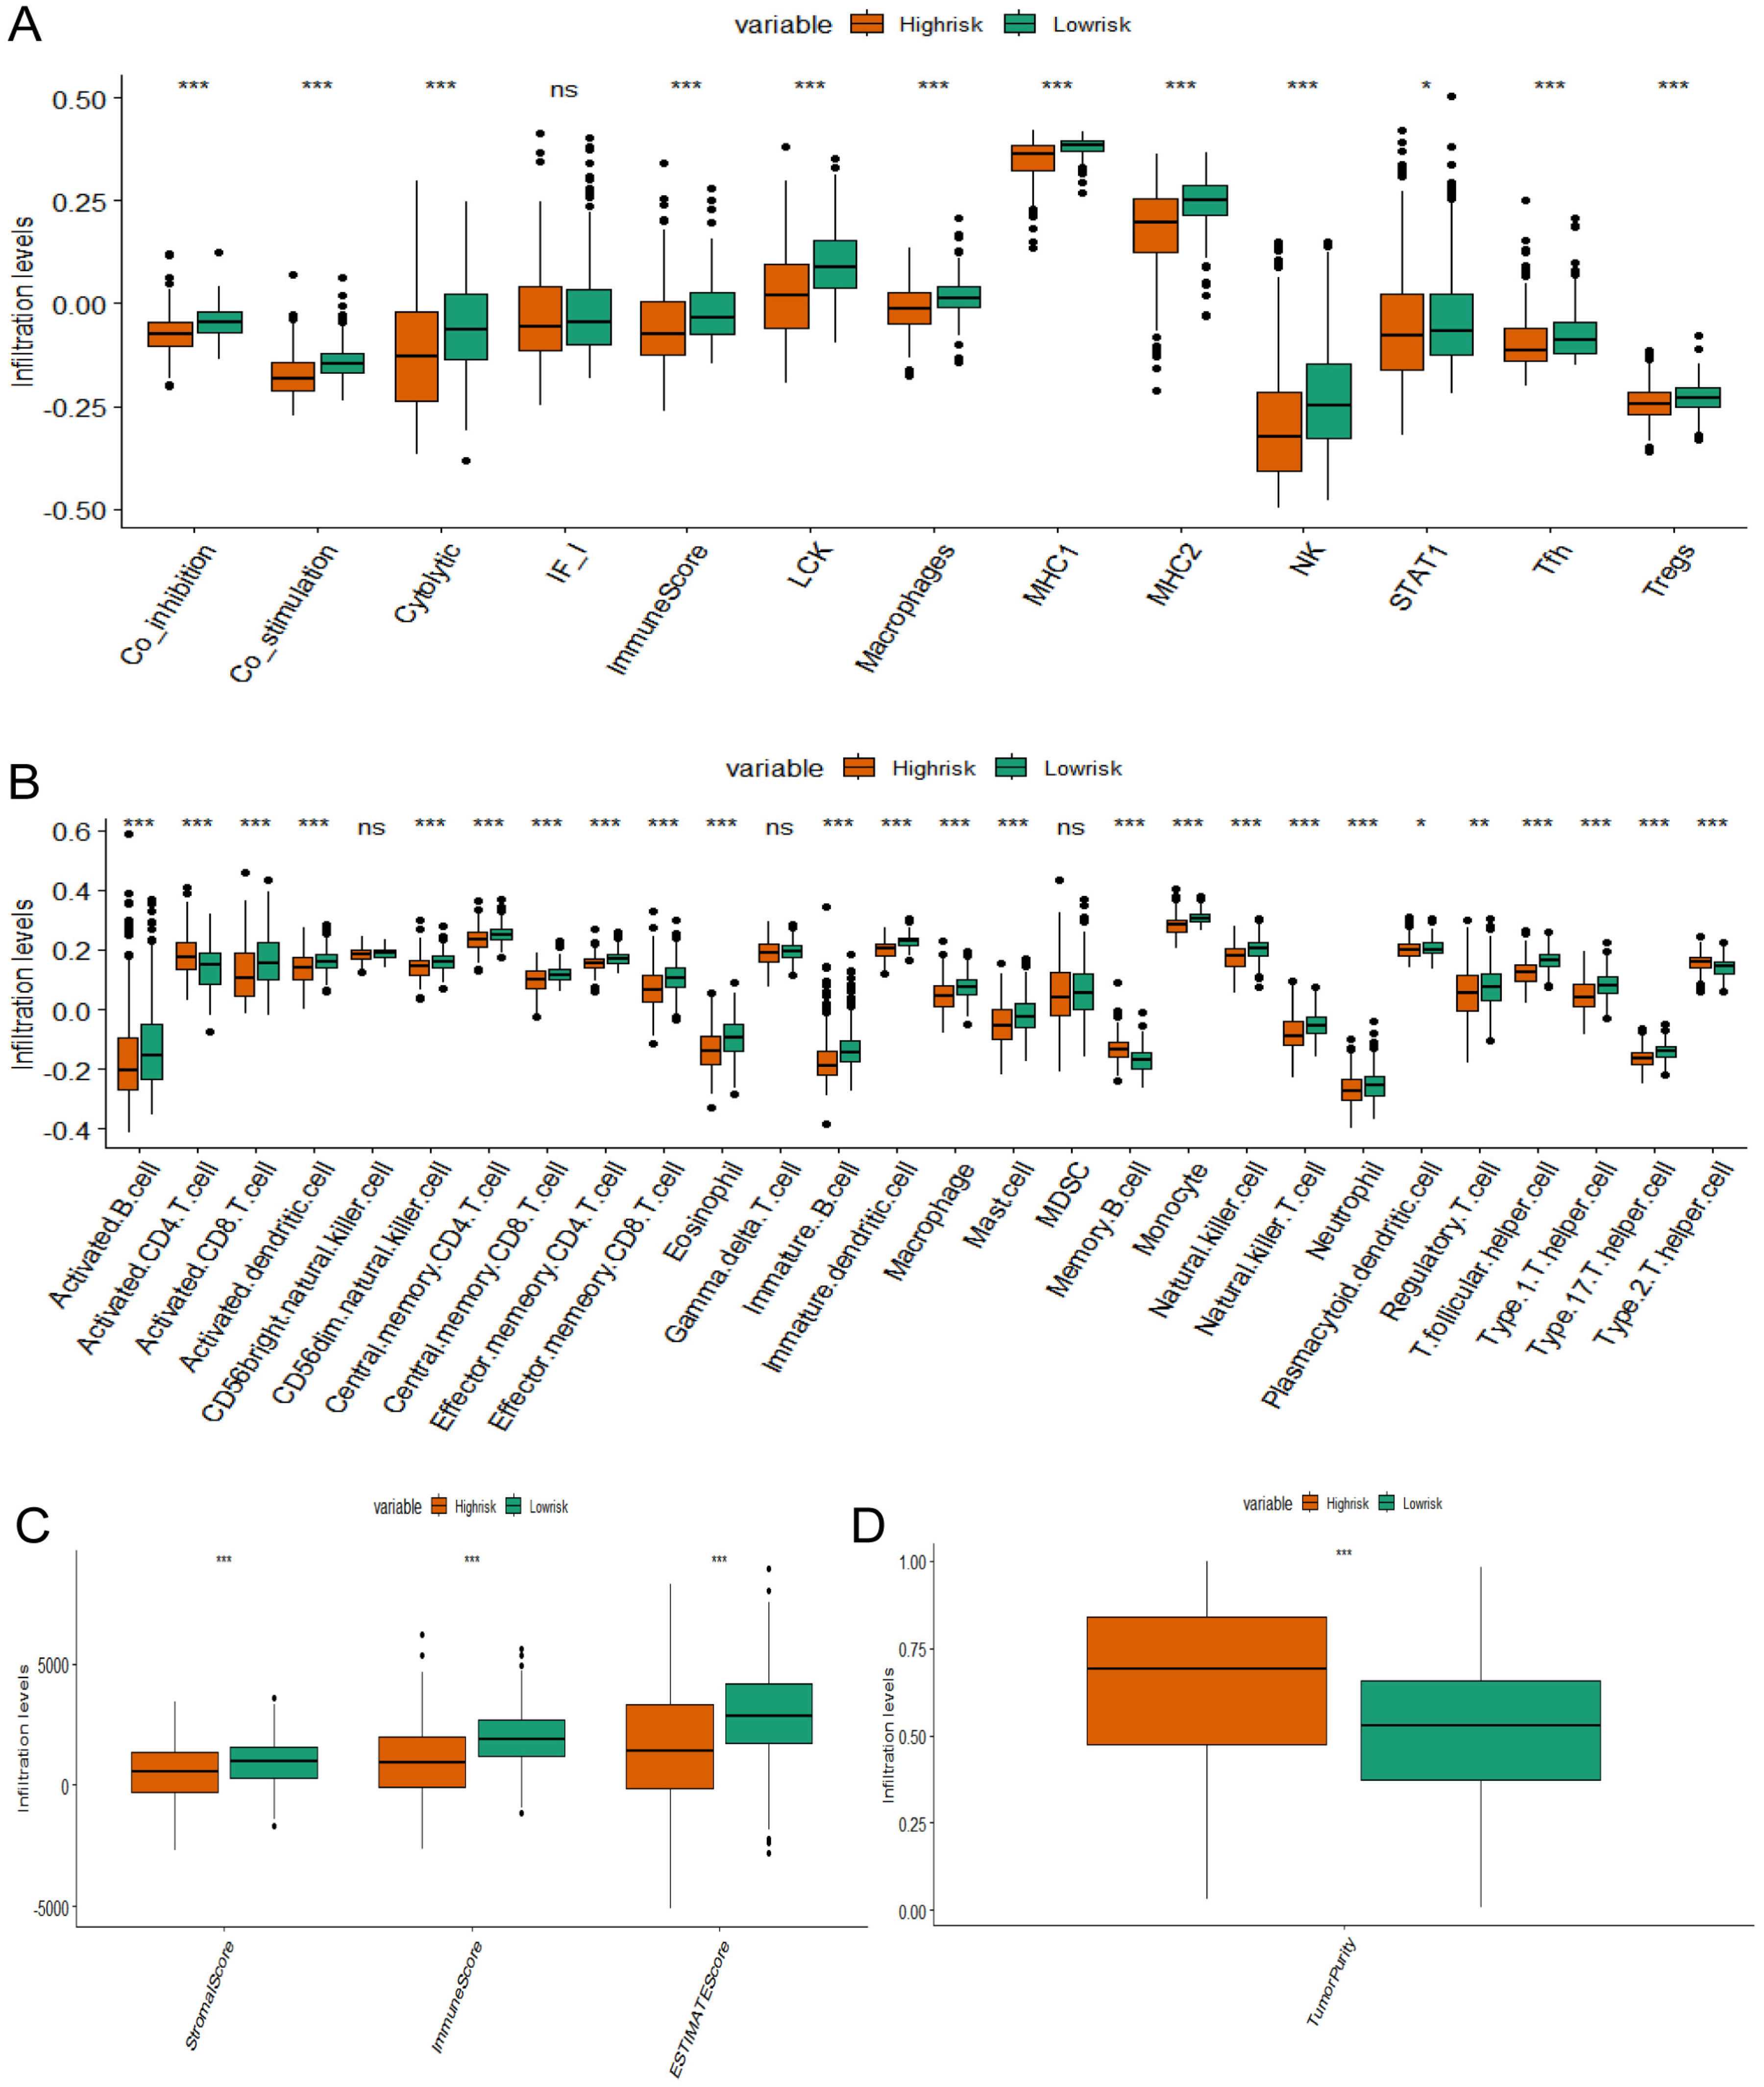
Analysis of immune cell infiltration in different risk groups (A). 13 characteristic genes of immune cells were obtained from the literature (PMID: 28428277). The ssGSEA method was utilized to calculate cell scores between high-risk and low-risk groups (B). The characteristics of 28 immune cells were obtained from the literature (PMID: 28052254). The ssGSEA method was utilized to calculate cell scores between high-risk and low-risk groups (C), (D). The ESTIMATE algorithm was used to predict immune scores.
Analysis of the relationship between chemotherapy risk score and sensitivity
The GDSC2 cancer cell line database and the OncoPredict algorithm were employed to compute the drug sensitivity of each patient. In our subgrouping model, it was discovered that 63 drugs exhibited superior treatment effects for the low-risk group, among which 14 had “tinib” in their names (Figure 10A). There were 49 “non-tinib” drugs (Figure 10B), and the average IC50 of “tinib” drugs and “non-tinib” drugs for the low-risk group was presented using a boxplot (Figure 10C). In future, “tinib” drugs might play an important role in the treatment of NB.
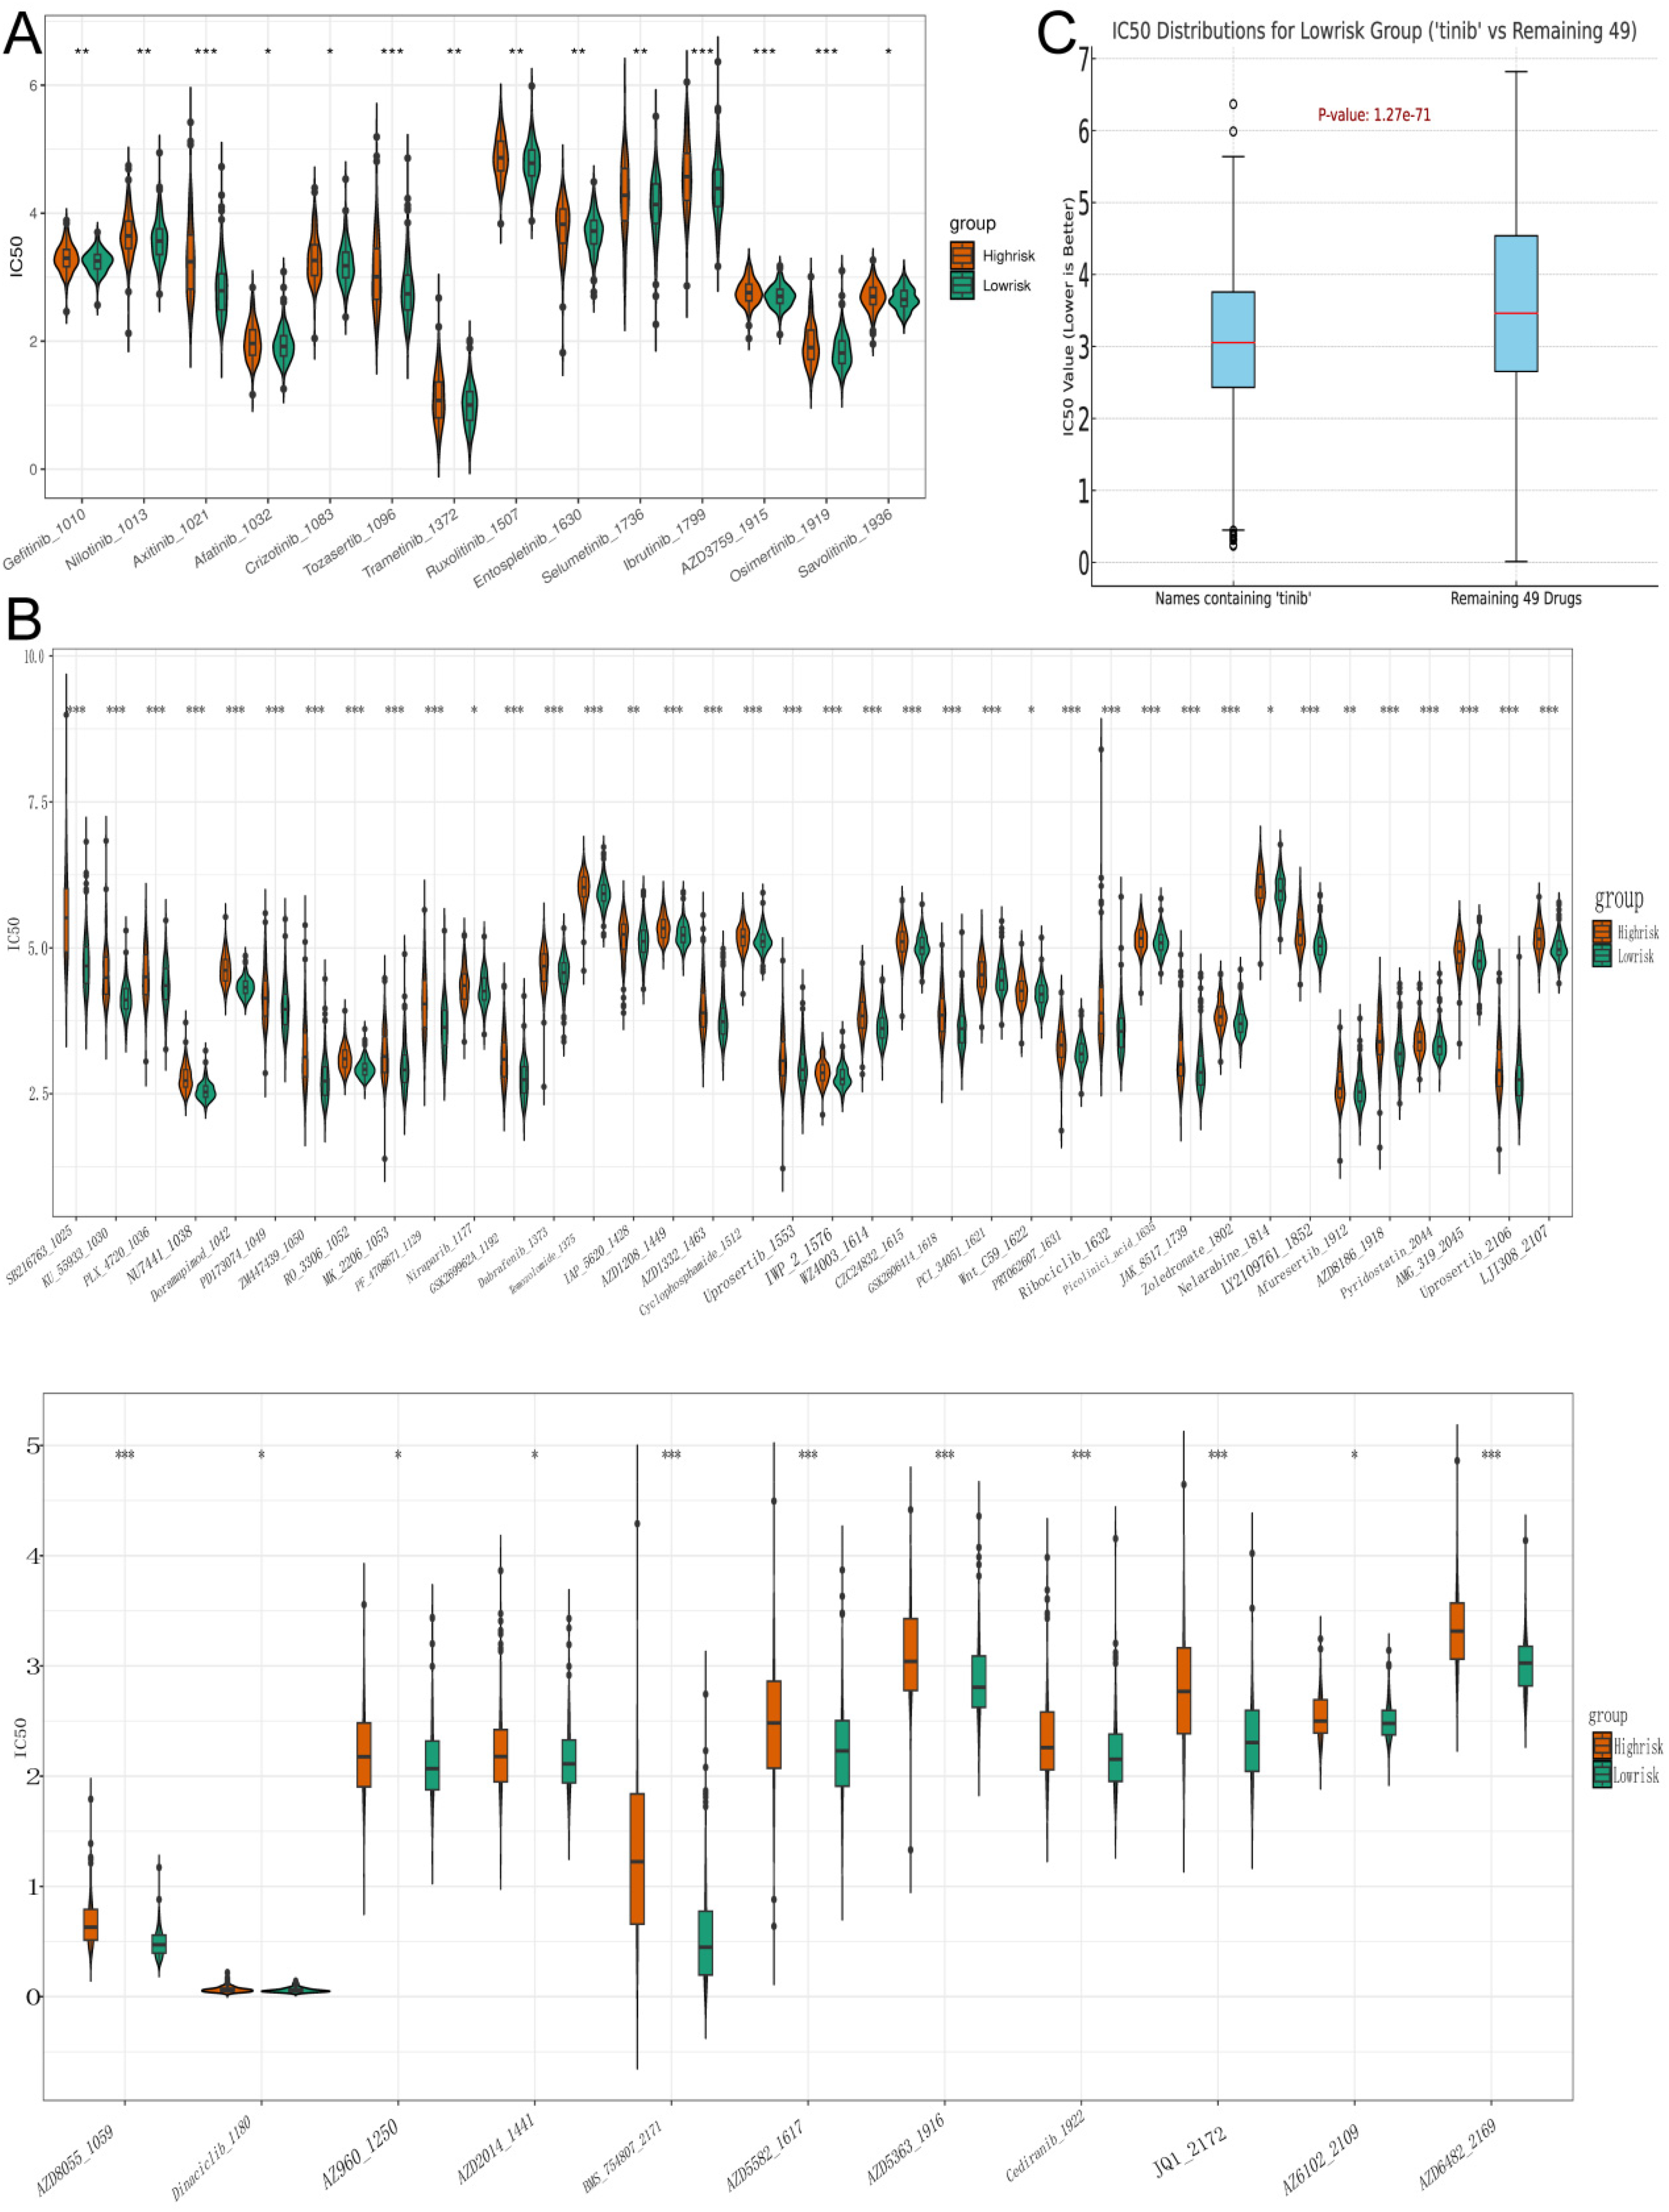
Drugs with better therapeutic effects for the low-risk group (A). The box plot showed the IC50 values of the high and low-risk groups of drugs with names containing “tinib” (B). The box plot showeed the IC50 values of the high and low-risk groups of other 49 drugs (C). The box plot showed the average IC50 values of “tinib” drugs compared to 49 other drugs in the low-risk group.
Pathway and functional enrichment analysis
Through Gene Set Enrichment Analysis (GSEA), a gene set associated with high-risk was identified. This gene set was primarily enriched in the MYC pathway and the following criteria were satisfied: gene set size ≥ 15, NES > 1.5, and a significance level of p < 0.05 (Figure 11A). In contrast, characteristics related to transplant rejection, TNF-α signaling via the NF-κB pathway, markers of inflammatory response, and markers of interferon-gamma response were predominantly associated with gene sets in the low-risk category (Figure 11B).
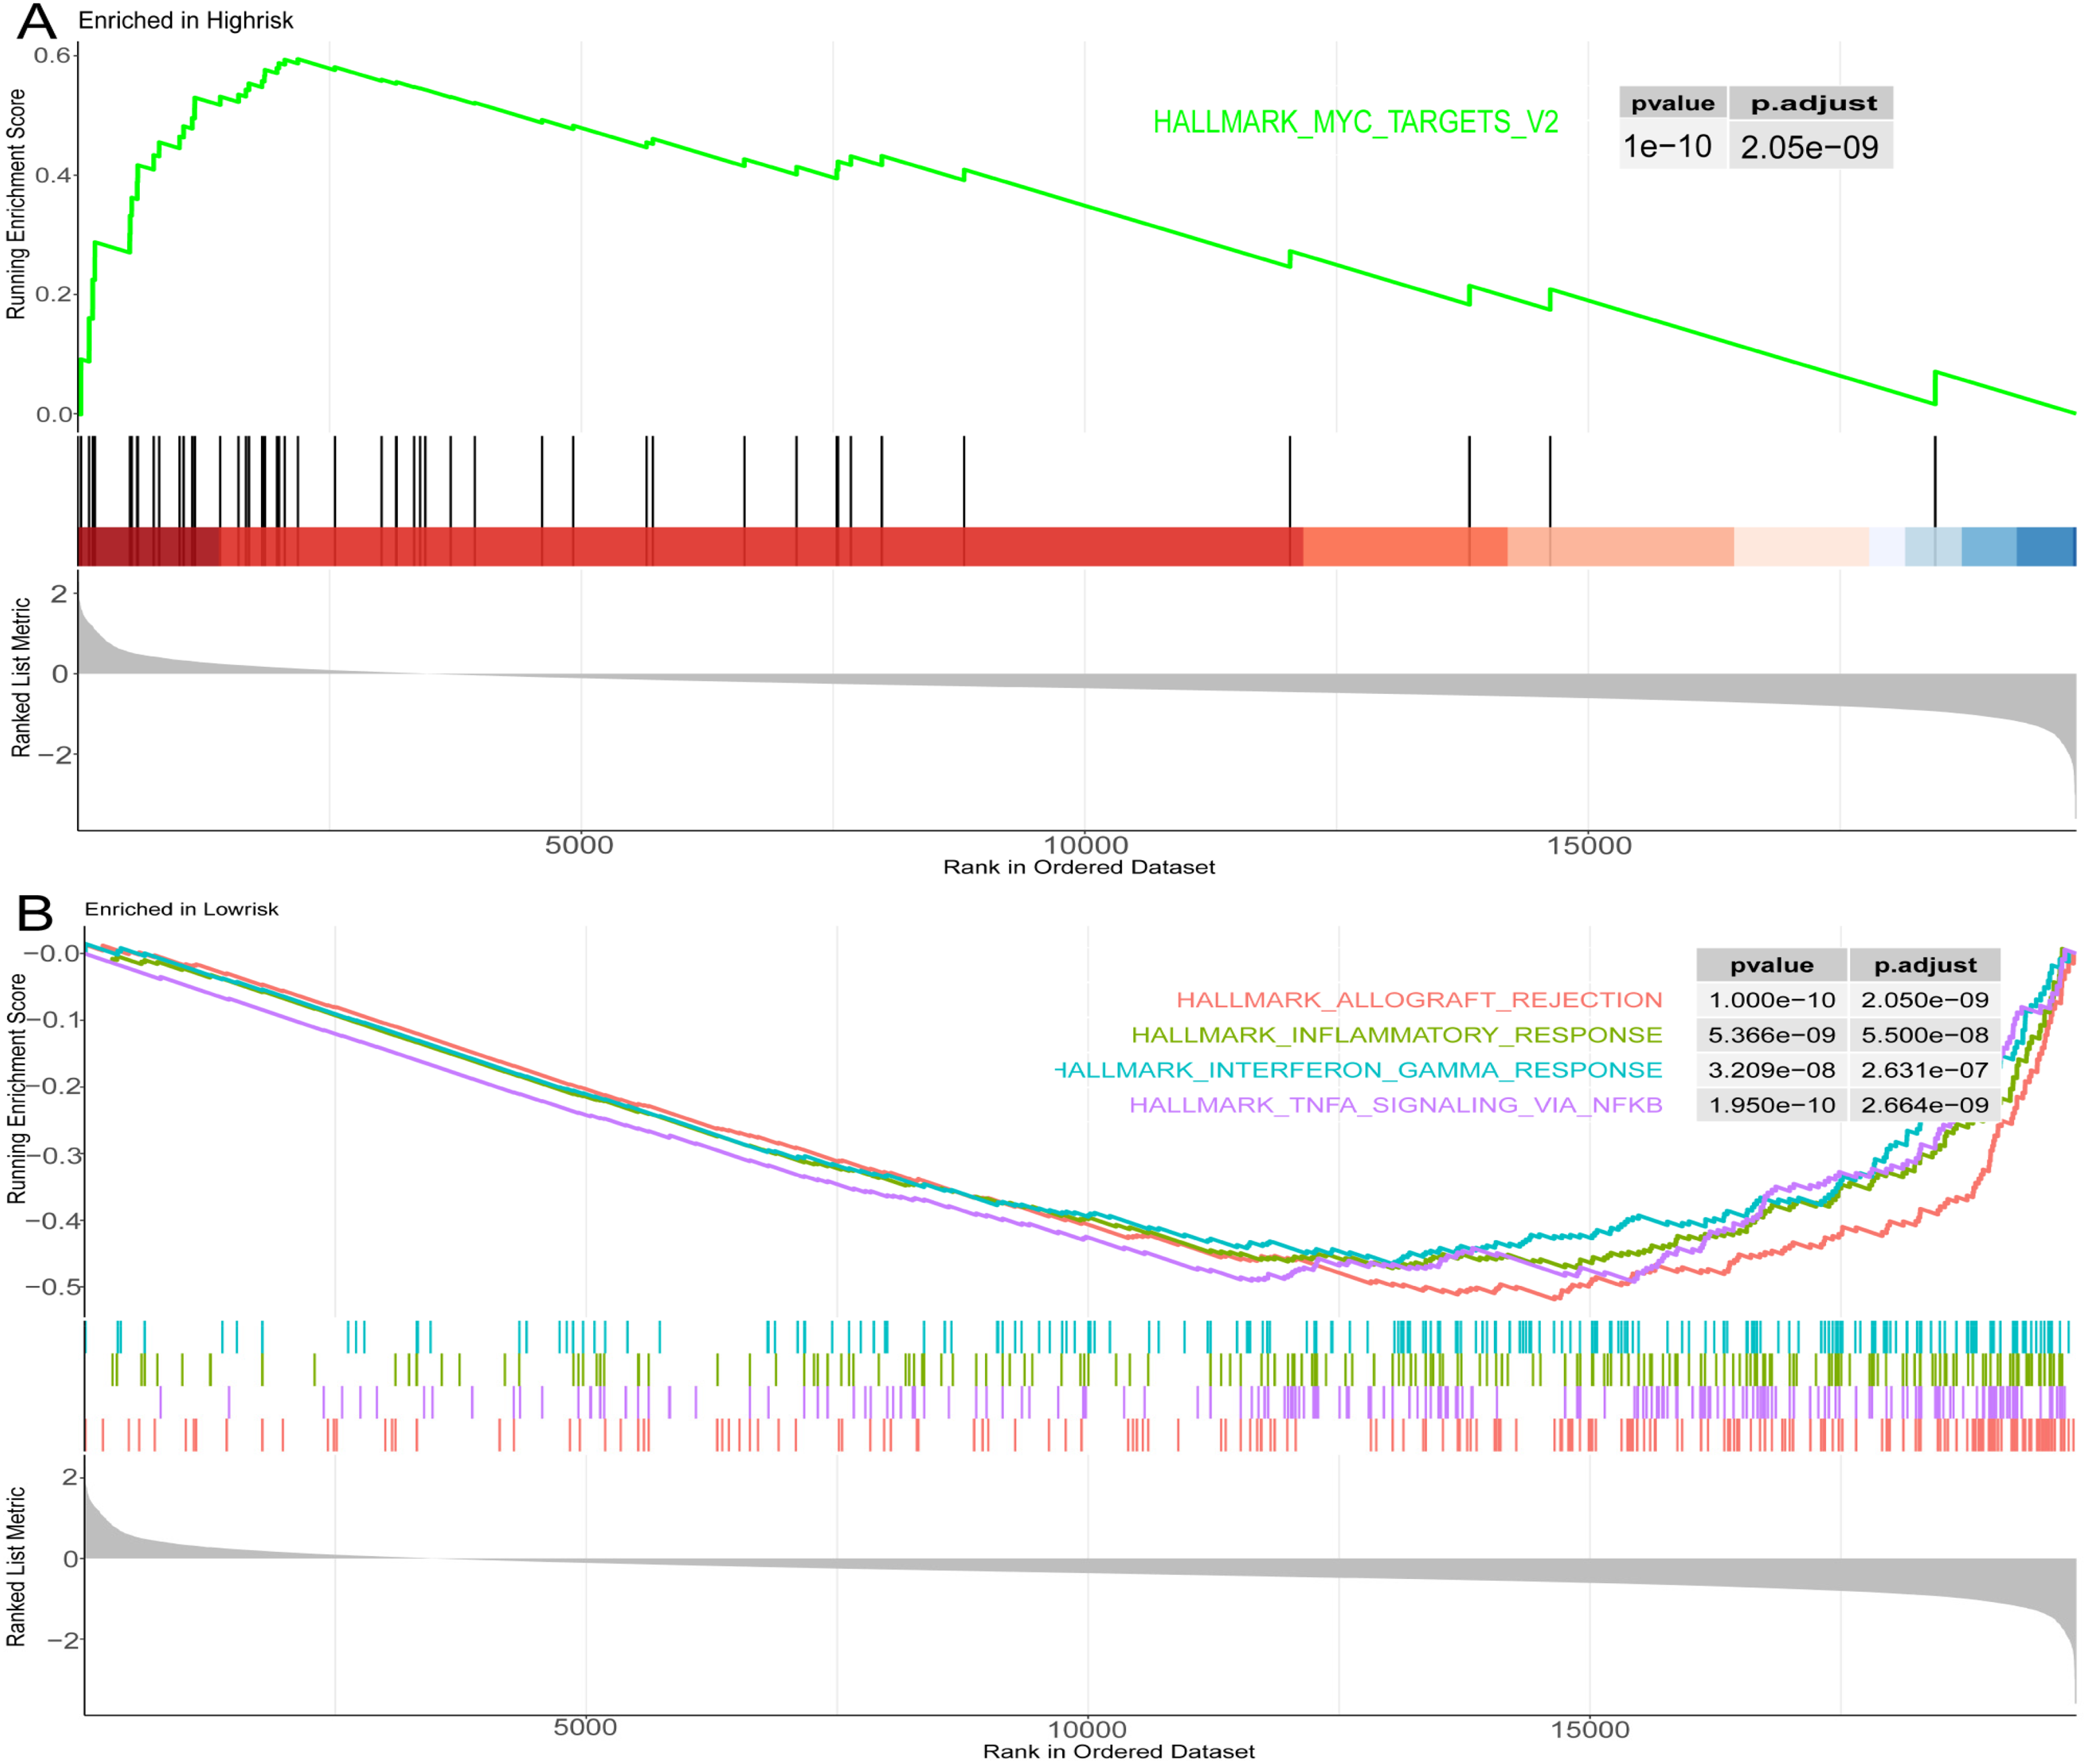
Pathway analysis and functional enrichment in high-risk and low-risk groups based on the hallMark dataset (A). Enrichment of pathways in high-risk groups (B). Enrichment of pathways in low-risk groups.
RT-PCR
The expression of differential genes was confirmed by RT-PCR in tissues. The results suggested that among 4 signature genes, STEAP2, CCNB1 were highly expressed in NB tissues, while MMP9 and PIK3R1 were lowly expressed in NB tissues (Figure 12A-D).
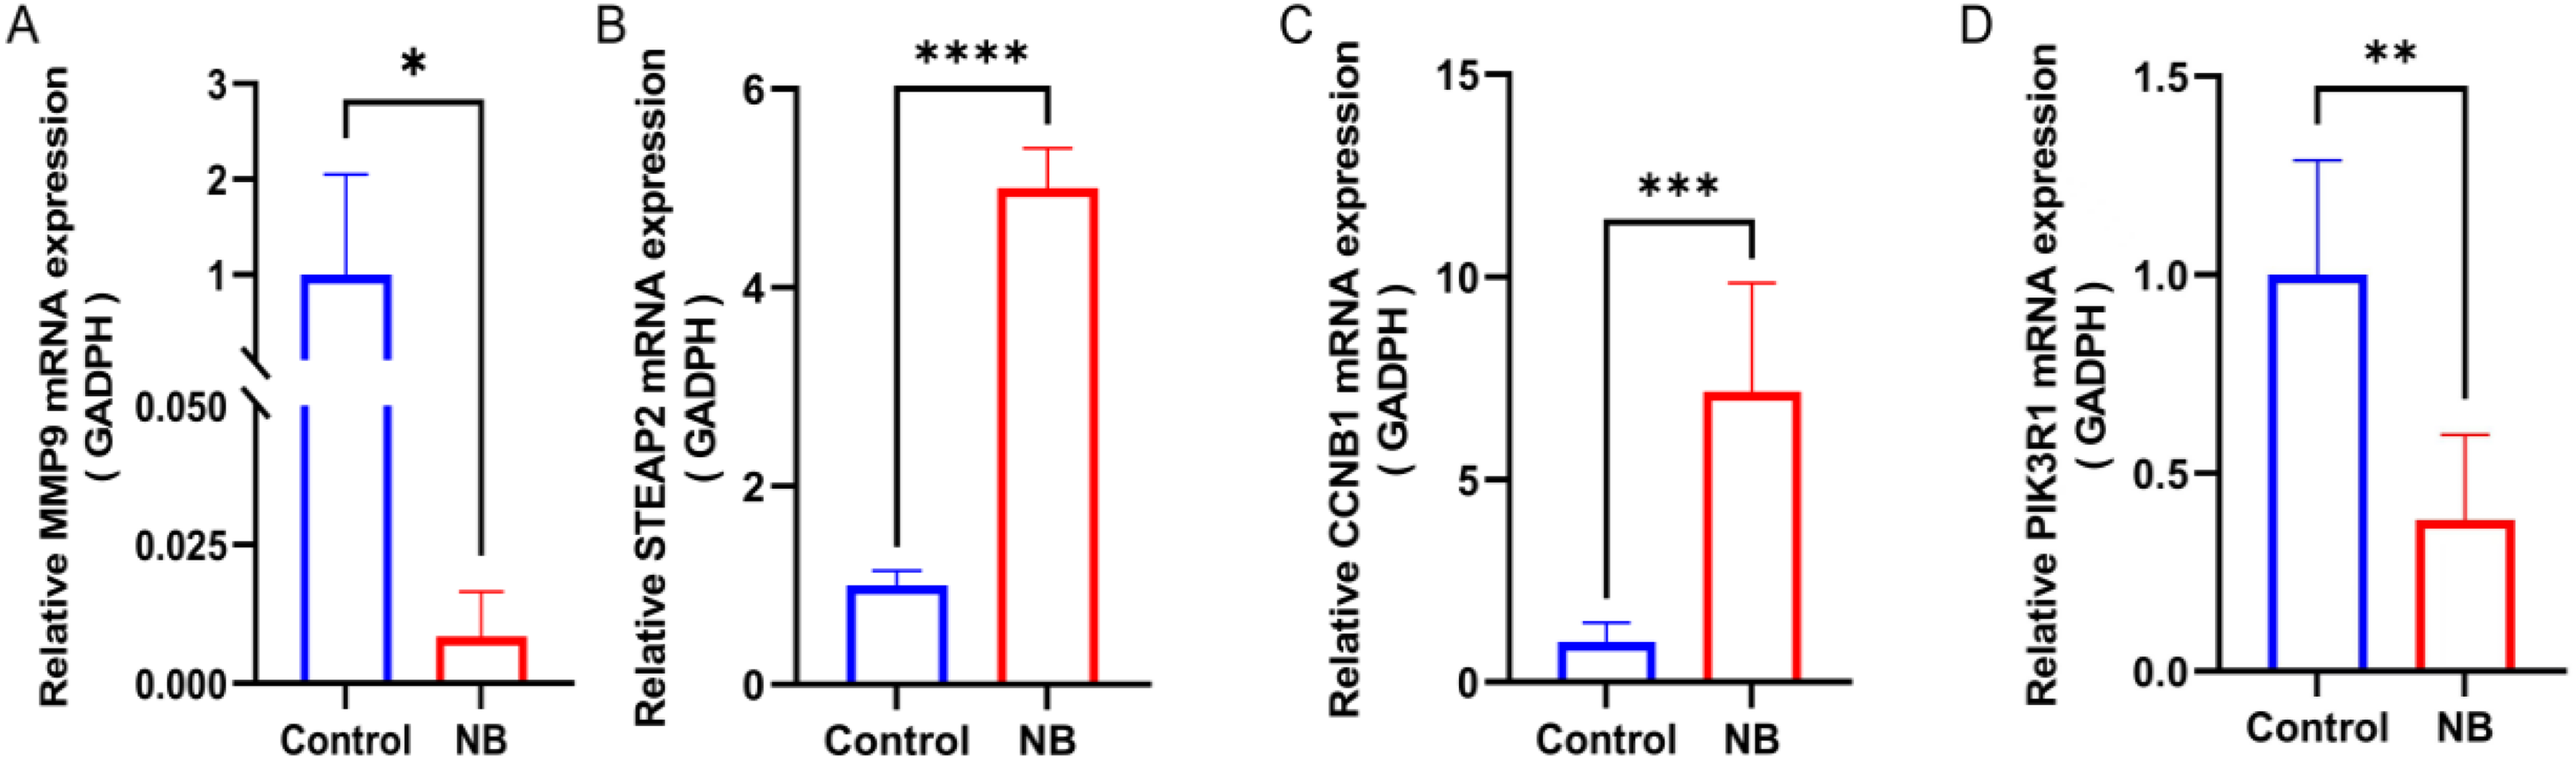
Different expressions of core genes in tissue samples were investigated by RT-PCR. (A). MMP9 (B). STEAP2 (C). CCNB1 (D). PIK3R1 *P < 0.05, **P < 0.01, ***P < 0.001, ****P < 0.0001.
Discussion
NB, originating from cells of the sympathetic nervous system, is the most common extracranial solid tumor in children and accounts for approximately 10% of all pediatric cancer-related deaths. 12 Due to advancements in comprehensive treatments such as surgery, radiation therapy, chemotherapy, and immunotherapy, the survival rate of NB patients has improved over the past decades. However, the long-term survival rate, particularly among high-risk patients, remains relatively low.
Cancer-associated fibroblasts (CAFs), an important component of the TME, were initially recognized as crucial for maintaining tissue homeostasis and preventing tumor initiation and progression. However, as the disease advances, CAFs paradoxically support tumor growth. 13 Research has demonstrated that in cancers such as pancreatic, breast, and ovarian cancer, CAFs contribute to tumor angiogenesis, metastasis, drug resistance, extracellular matrix remodeling, and the establishment of an immunosuppressive environment. These multifaceted roles make CAFs potential targets for cancer diagnosis and therapy. Zeine et al. 14 found that αSMA-positive fibroblasts are present in the more aggressive NB tumors, and their presence inversely correlates with the presence of Schwann cells seen in the more benign ganglion NB. Borriello et al. 15 have identified a different type of CAFs that expresses molecular markers of Mesenchymal Stem Cell (MSC), such as CD73, CD90, and CD105, in addition to αFAP, FSP-1, and variable expression of αSMA. However, studies on CAFs in NB are still limited. Therefore, gaining a deeper understanding of the CAFs’ role in NB on a broader scale would be useful.
In this study, single-cell RNA sequencing and bulk transcriptome RNA sequencing obtained from the public dataset GEO were used to study CAFs in NB. The results of single-cell RNA sequencing indicated that fibroblasts were highly active, 13 which was consistent with the study by Ye et al. in ovarian cancer, and the extensive interaction between CAFs and different cells in the TME. 16 The analysis of bulk transcriptome RNA sequencing verified that CAF-related genes were expressed at varying levels in NB depending on the risk classification and stage. A set of 81 important genes associated with CAFs was pinpointed for investigating their functions in NB.
Using GO and KEGG analyses, we identified significant pathways related to the regulation of epithelial cell and fibroblast proliferation, collagen-containing extracellular matrix organization, and receptor-ligand interactions in biological processes, cellular components, and molecular functions, respectively. Key pathway analysis from KEGG highlighted hub genes clustering around the TNF signaling pathway, actin cytoskeleton regulation, and PI3K-Akt signaling pathway. The TNF signaling pathway and actin cytoskeleton regulation are implicated in cancer cell invasion, inhibition of immune cell infiltration, and promotion of tumor progression and drug resistance. 17 The PI3K-Akt signaling pathway contributes to tumorigenesis by reprograming cell metabolism and promoting invasion. 18 KEGG and GO analyses revealed that the key gene set is associated with tumor initiation and progression, as well as various components of the extracellular matrix.
LASSO regression, random forest, and multivariate Cox modeling were ultimately used to identify four CAFs genes, PIK3R1, CCNB1, MMP9, and STEAP2, which were closely related to the prognosis of NB. Among them, PIK3R1 and MMP9 genes were protective factors, while CCNB1 and STEAP2 genes were risk factors. All four genes are closely related to the occurrence and development of tumors.
Cyclin B1, encoded by the CCNB1 gene, serves as a regulatory subunit of the cyclin-dependent kinase complex (CDK1), governing the transition from the G2 phase to the M phase in the cell cycle. Disruption of CCNB1 gene expression is an early marker of malignant cell transformation.19,20 Silencing CCNB1 can effectively inhibit cancer cell division by regulating its upstream and downstream targets, thereby controlling tumor growth.21,22 CCNB1 plays an important role in NB, and Akimov et al. 23 found that silencing CCNB1 can slow down the division of NB cells, making CCNB1 a potential therapeutic target for NB. This study, from a bioinformatics perspective, further confirmed that CCNB1 was a risk factor for NB, consistent with previous research findings.
The STEAP2 protein, which shares structural similarities with the epidermal growth factor receptor, is expressed in various tissues and plays a role in iron ion metabolism as well as the proliferation and migration of multiple cancer types. In prostate cancer, overexpression of STEAP2 promotes the migration and invasion of prostate epithelial cells, thereby contributing to disease progression. 24 Additionally, STEAP2 serves as a prognostic indicator for glioblastoma. Members of the STEAP family exhibit promising predictive potential for survival, immune microenvironment modulation, and treatment response in gliomas.25,26 Although the role of STEAP2 in neuroblastoma has not been previously reported, our study demonstrates that STEAP2 is a risk factor for neuroblastoma, consistent with its role in prostate cancer.
The PI3K/Akt signaling pathway acts as a protective factor and is involved in various biological processes. In hepatocellular carcinoma, the expression level of PIK3R1 is inversely correlated with tumor malignancy, consistent with findings that p85 inhibits tumor progression.27,28 Fransson et al. 29 investigated the role of PI3K/Akt signaling in primary neuroblastoma at both mRNA and protein levels, demonstrating that PIK3R1 mRNA expression is higher in stages 1–2 compared to stage 4. PI3K can enhance Akt phosphorylation via the p85 subunit, exerting anti-tumor effects. Furthermore, they found that the expression of three different p85α isoforms encoded by PIK3R1 was significantly reduced at both mRNA and protein levels in stage 4 tumors compared to stages 1–2. In a prognostic model for NB based on lipid metabolism, PIK3R1 was identified as a protective factor. Our results are consistent with these conclusions. 30
MMP9 can promote tumor growth, invasion, and metastasis. 31 In NB, MMP9 can promote angiogenesis and tumor progression. Drugs or inhibitors suppressing MMP9-related pathways have been shown to reduce the growth and invasiveness of NB cells.32–34 Notably, MMP-9 levels are higher in stage 4 NB patients compared to stages 1 and 2. 35 However, Fukuzawa et al. 36 demonstrated that MMP-9 expression in NB was not associated with clinical staging and prognosis.
A predictive risk model with four key genes was constructed to further evaluate the diagnostic value of screening genes and to assess its precision and reliability with an independent dataset. The outcomes suggested that this risk model effectively forecasts the prognosis of individuals with NB. Specifically, a higher risk score was correlated with a poorer prognosis, while a lower risk score was associated with a more favorable prognosis. The study involved comparing the differences in the microenvironment, drug target therapy, and enriched pathways between two risk groups through the analysis of immune infiltration, chemotherapy risk scoring, and sensitivity, as well as GSEA HallMark analysis. The results from ssGSEA and Estimate indicated that the low-risk group had higher infiltration of Central Memory CD8 T cells, Central Memory CD4 T cells, and activated CD8 T cells, suggesting a stronger immune response in the tumor microenvironment with better cytotoxic and regulatory capabilities. Moreover, the low-risk group showed a higher proportion of immune or stromal components in the tumor microenvironment, leading to lower tumor purity. These findings suggest a better prognosis for the low-risk group,37–40 providing crucial clues for further exploration of immune characteristics and personalized treatment strategies for patients in the high-risk group.
The GSEA analysis revealed that the high-risk group exhibited overactivation or abnormal expression of the MYC pathway, which is potentially associated with tumor development, progression, and treatment resistance. 41 This finding aligns with the established consensus that patients with N-MYC gene amplification in neuroblastoma have a poor prognosis. In contrast, gene sets in the low-risk group were primarily associated with features of transplant rejection reactions, TNF-α signaling via the NF-κB pathway, inflammatory response markers, and interferon γ response markers. These results suggest that immune regulation, inflammation, and interferon γ responses may play a critical role in the low-risk group, potentially contributing to the prevention of tumor development and enhanced immune surveillance.42–44
In our research, it was found that better therapeutic effects on the low-risk group were had by drugs with “tinib” in their names. Most of them were EGFR tyrosine kinase inhibitors, such as gefitinib_1010 and nilotinib_1013. In fact, the proliferation and survival of NB are involved in by the EGFR signaling pathway, and a poor prognosis is usually indicated. 45 In our model, compared with the IC50 of the other 49 drugs, a lower average IC50 of this type of drug for the low-risk group was found, which proved that the efficacy of this type of drug on the low-risk groupwas superior to that of other drugs, and the effectiveness of the high and low-risk group classification of the model was verified. Among the four genes, the difference in STEAP2 expression between tumor samples and normal tissue samples is the most significant. To date, no studies have investigated the association between STEAP2 and neuroblastoma, suggesting its potential as a novel biomarker. We developed a prognostic model for neuroblastoma using genes related to CAFs. The study also explored the relationship between risk factors and immune infiltration in tumors, providing a method to identify suitable drugs based on risk categories and assist clinicians in predicting patient outcomes. This approach facilitates the development of effective treatment plans using new scoring techniques. However, the study has limitations, including the need for additional patient samples and public datasets for validation, as well as the requirement to confirm the mechanisms of action of the four key genes in neuroblastoma through experimental studies. These challenges warrant further investigation.
Conclusion
The study introduces a new predictive model that uses CAF markers to forecast the prognosis of NB. Our results showed that PIK3R1 and MMP9 genes were protective factors, while CCNB1 and STEAP2 genes were risk factors in NB. Nevertheless, the precise mechanisms through how this gene influences the onset and progression of NB still require thorough understanding.
Supplemental Material
sj-docx-1-cbm-10.1177_18758592251317406 - Supplemental material for Identification of key genes related to cancer associated fibroblasts in neuroblastoma: A comprehensive bioinformatics approach
Supplemental material, sj-docx-1-cbm-10.1177_18758592251317406 for Identification of key genes related to cancer associated fibroblasts in neuroblastoma: A comprehensive bioinformatics approach by Zhao Qianyun, Wang Jianjun, Fan Kaisi, Li Jinhao, Chen Renhai, Ding Xiaoting, Li Yongteng, Yang Liucheng and Wu Kai in Cancer Biomarkers
Footnotes
Abbreviations
ORCID iD
Ethics approval and consent to participate
The research involving human participants was reviewed and approved by the Ethics Committee of Zhujiang Hospital of Southern Medical University.
Consent for publication
Not applicable.
Author contributions
Conception: Qianyun Zhao,Jianjun Wang,and Kaisi Fan.
Interpretation or analysis of data: Qianyun Zhao, Kaisi Fan.
Preparation of the manuscript: Kaisi Fan, Xiaoting Ding and Jinhao Li.
Revision for important intellectual content:Qianyun Zhao,Jianjun Wang, and Yongteng Li.
Supervision: Kai Wu,Liucheng Yang.
Funding
This study was supported by the Guangdong Basic and Applied Basic Research Foundation of China (2019A1515011086) and the Guangdong Medical Association Clinical Research Fund (A202302026).
Declaration of conflicting interests
The authors declared no potential conflicts of interest with respect to the research, authorship, and/or publication of this article.
Availability of data and materials
The datasets generated during the current study are available from GEO (https://www.ncbi.nlm. nih.gov/geo/) and TARGET (![]() ). More detailed data is available from the corresponding authors upon reasonable request.
). More detailed data is available from the corresponding authors upon reasonable request.
Supplemental material
Supplemental material for this article is available online.
References
Supplementary Material
Please find the following supplemental material available below.
For Open Access articles published under a Creative Commons License, all supplemental material carries the same license as the article it is associated with.
For non-Open Access articles published, all supplemental material carries a non-exclusive license, and permission requests for re-use of supplemental material or any part of supplemental material shall be sent directly to the copyright owner as specified in the copyright notice associated with the article.