
Abstract
This study aims to identify and validate potential endogenous biomarkers for triple-negative breast cancer (TNBC). TNBC microarray data (GSE38959, GSE53752) were retrieved from the Gene Expression Omnibus (GEO) database, and principal component analysis (PCA) was performed to evaluate the reliability of the data. The microarray datasets were merged, and differentially expressed genes (DEGs) were identified using R software. Functional enrichment analysis of the DEGs was conducted using Gene Ontology (GO) and Kyoto Encyclopedia of Genes and Genomes (KEGG) pathways. The most disease-relevant module was identified through Weighted Gene Co-expression Network Analysis (WGCNA), and genes within this module were intersected with the DEGs. The intersecting genes underwent Least Absolute Shrinkage and Selection Operator (LASSO) regression analysis to minimize errors and identify TNBC-specific genes. Sensitivity and survival analyses were performed on the identified specific genes. There were 10 TNBC-specific genes identified: RRM2, DEPDC1, FIGF, TACC3, E2F1, CDO1, DST, MCM4, CHEK1, and PLSCR4. RT-qPCR analysis showed significant upregulation of CDO1, MCM4, DEPDC1, RRM2, and E2F1 in MDA-MB-231, CAL-148, and MFM-223 compared to MCF-10A. Our findings provide new insights into TNBC pathogenesis and potential therapeutic strategies, with important clinical implications for further understanding TNBC mechanisms and developing innovative treatments.
Keywords
Introduction
Triple-negative breast cancer (TNBC) accounts for up to 20% of all breast cancer cases. It is characterized by the absence of estrogen receptors (ER), progesterone receptors (PR), and human epidermal growth factor receptor 2 (HER-2), and it poses a significant global threat to women's health due to its highly invasive nature. The high mortality rate associated with TNBC is partly attributable to the lack of highly sensitive and specific biomarkers, as well as the absence of dedicated screening methods. While studies have identified CXCL8 as a biomarker for brain metastasis in both TNBC and other breast cancers 1 , and Nectin-4 as a prognostic marker for TNBC 2 , the underlying mechanisms and regulatory pathways of TNBC remain unresolved. Thus, identifying novel biomarkers is crucial for improving early diagnosis, therapeutic strategies, and clinical outcomes for TNBC patients.
The primary aim of this study is to uncover new biomarkers and molecular pathways associated with TNBC by employing advanced bioinformatics approaches. Using microarray data and genomic sequencing, we aimed to identify genes differentially expressed between TNBC and normal breast tissue, focusing on co-expression networks and functional analysis to uncover disease-related mechanisms. A combination of differential gene expression analysis and Weighted Gene Co-expression Network Analysis (WGCNA) was applied to identify co-expressed genes specifically associated with TNBC. We then used Least Absolute Shrinkage and Selection Operator (LASSO) regression analysis to select potential biomarkers, followed by sensitivity analysis to assess their robustness. To evaluate the clinical relevance of these biomarkers, we utilized the Kaplan-Meier (KM) Plotter database to assess their prognostic value. Finally, the expression levels of these genes were validated in TNBC cell lines through RT-qPCR.
The novelty of this study lies in the integration of differential gene expression analysis and co-expression network analysis to identify biomarkers that have not been fully explored in the context of TNBC. By combining multiple bioinformatics tools, we aim to provide new insights into the molecular mechanisms underlying TNBC, with a focus on identifying biomarkers that could improve early screening and therapeutic outcomes for TNBC patients. Our findings could contribute to the development of more effective clinical strategies and open new avenues for personalized treatment approaches in TNBC.
Materials and methods
Data collection from GEO
The gene expression data analyzed in this study were retrieved from the Gene Expression Omnibus (GEO) database (https://www.ncbi.nlm.nih.gov/geo/). “Triple-negative breast cancer” was used as the search keyword, and the screening criteria included “Expression profiling by array,” “tissue,” and “Homo sapiens.” The normal tissue samples were assigned to the control group, while the tumor samples were assigned to the treatment group. Data processing was conducted using R software (Version 4.3.1). Principal component analysis (PCA) was performed on both sample groups to assess the reliability of the grouping. The datasets included in the analysis were filtered using the adjusted p-value and |logFC| as criteria, with genes exhibiting a corrected p-value < 0.05 and |logFC| ≥ 2 considered as significantly differentially expressed genes (DEGs) 3 . The detailed study pipeline is illustrated in Figure 1.
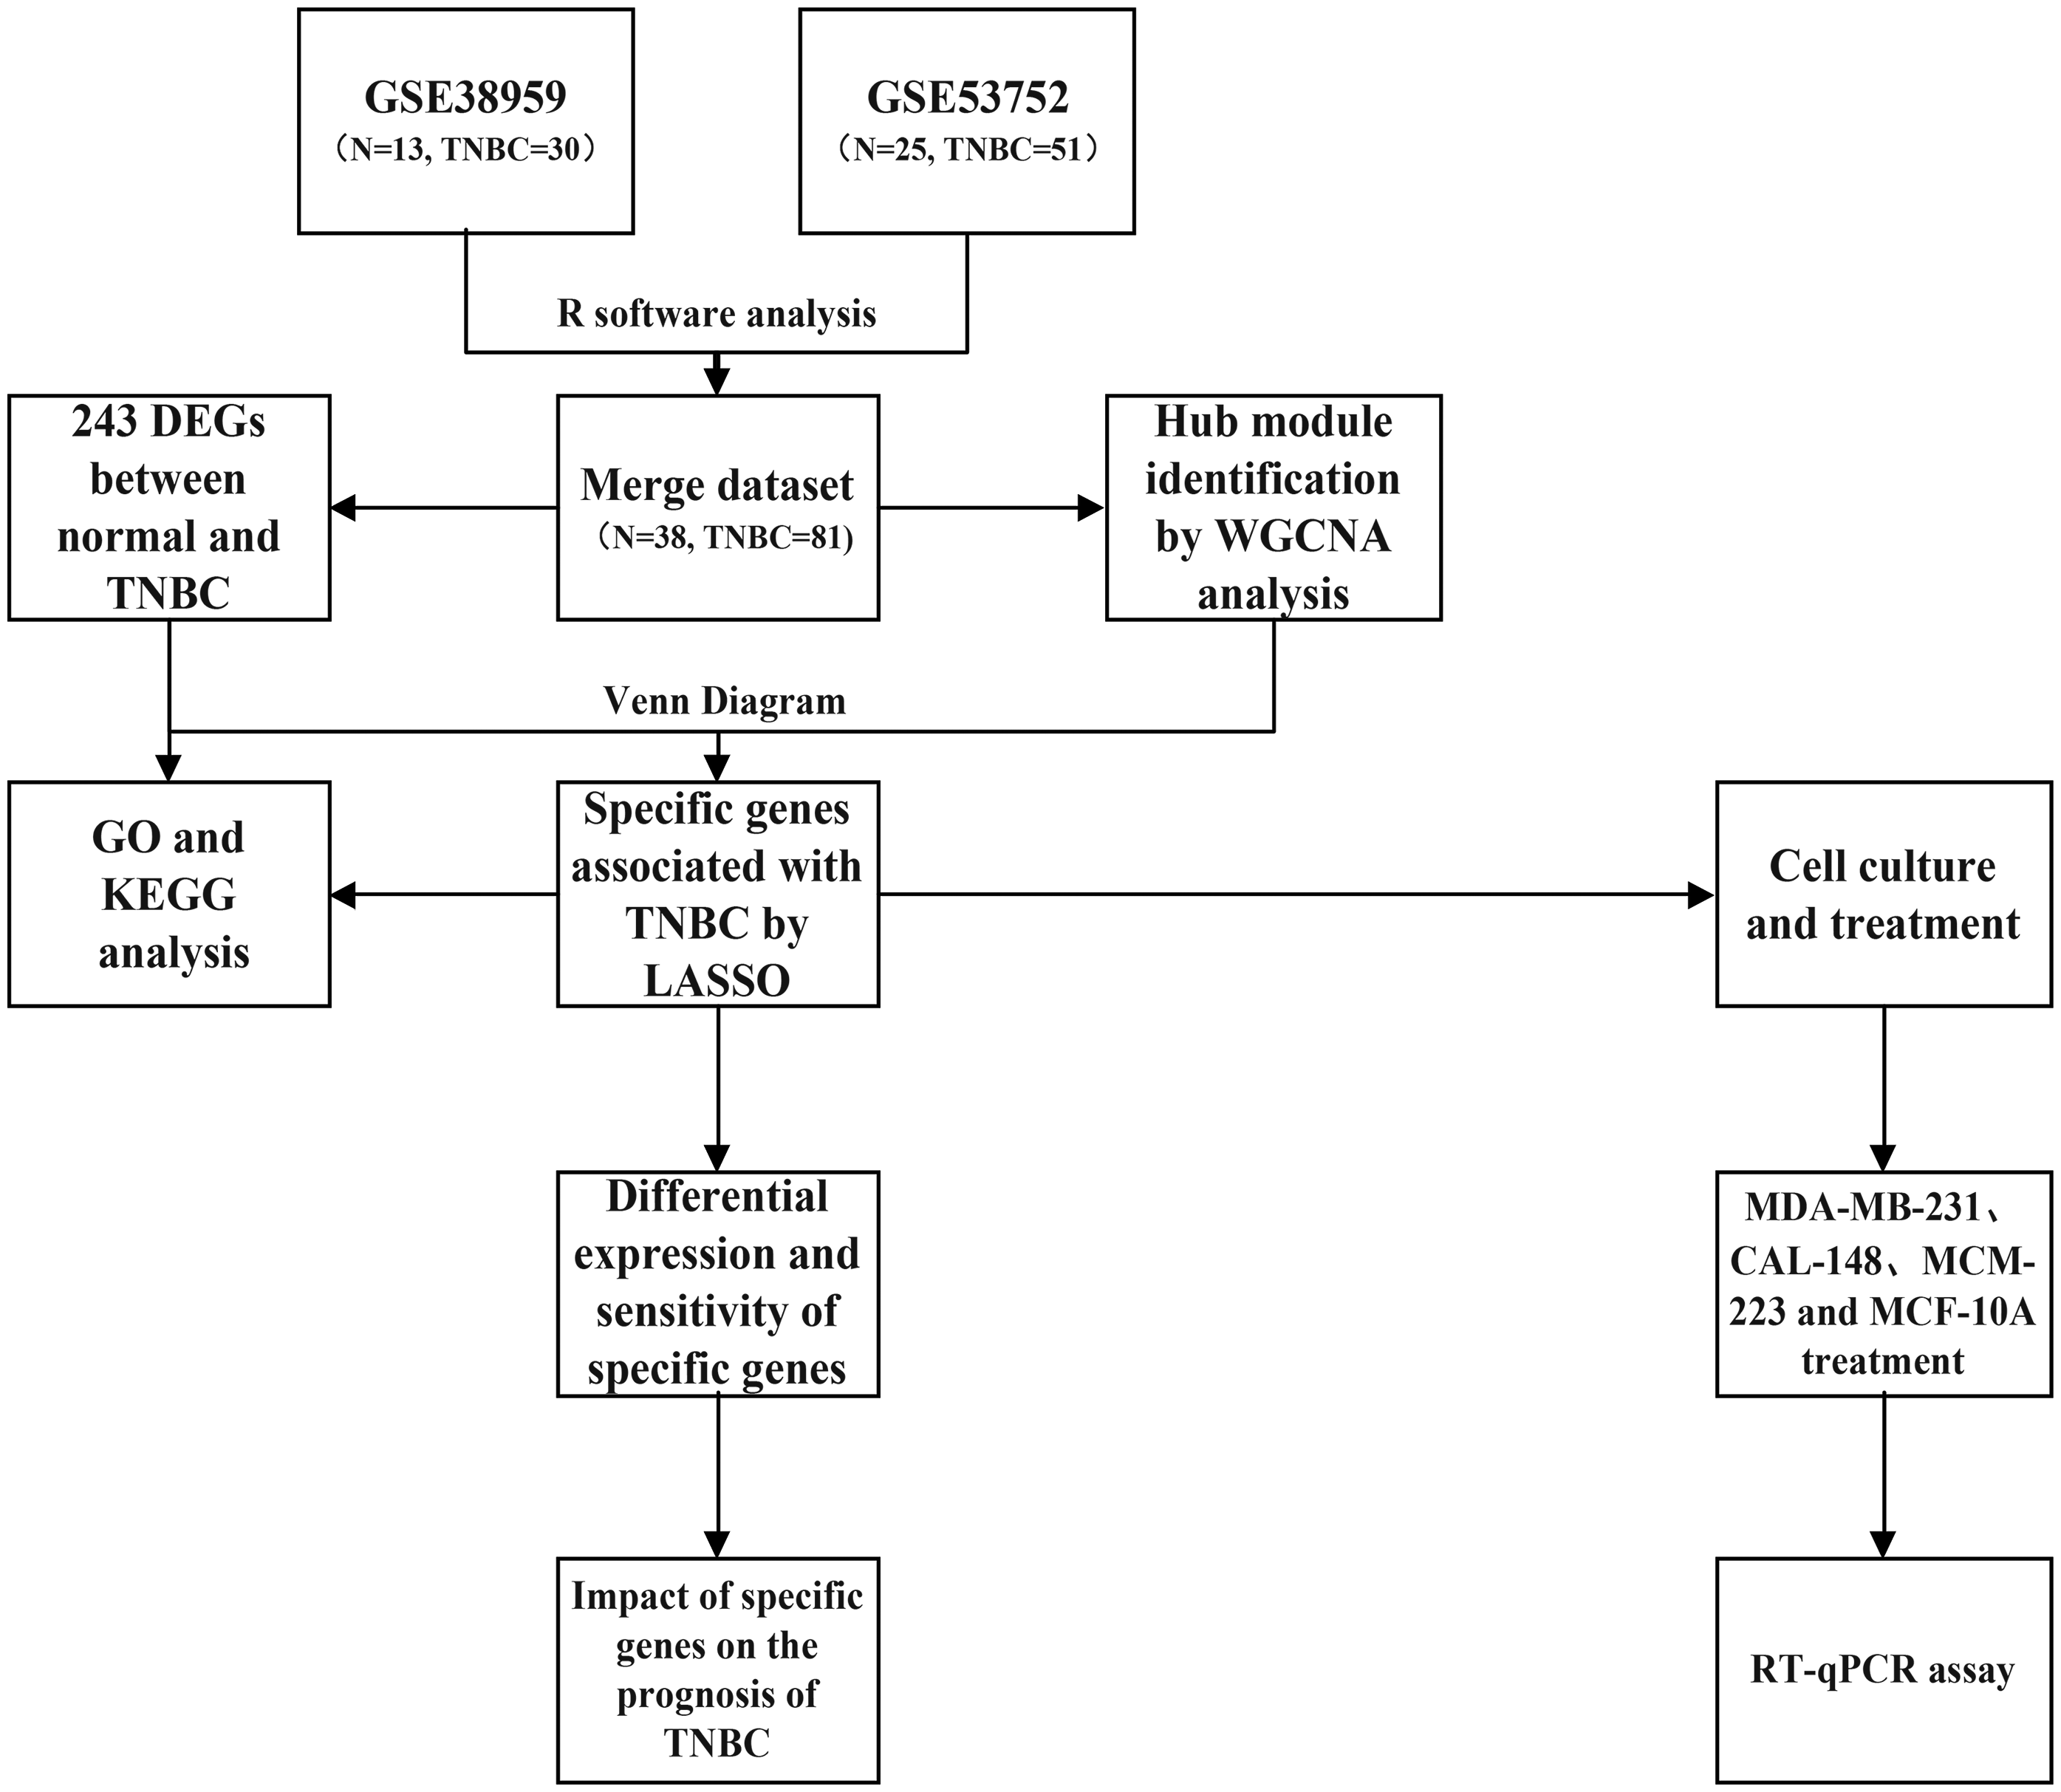
The overall design of this study.
Differential gene functional analysis
The Gene Ontology (GO) is an internationally standardized system for the classification of gene functions. It provides a continuously updated set of standardized vocabularies to describe, in a comprehensive manner, the attributes of genes and gene products within a biological organism. GO consists of three primary branches: Molecular Function (MF), Cellular Component (CC), and Biological Process (BP). These branches describe the molecular roles of genes, their localization within the cell, and their involvement in biological processes, respectively.
The Kyoto Encyclopedia of Genes and Genomes (KEGG) database is a systematic resource for analyzing gene functions and integrating genomic and functional information. It includes databases related to metabolic pathways, hierarchical classifications, genes, genomes, and more. KEGG is one of the most widely utilized public databases for the exploration of metabolic pathways.
To investigate the biological functions of the DEGs, we performed GO and KEGG enrichment analyses. Statistical significance was established at a threshold where both p < 0.05 and adjusted p < 0.05.4,5
Weighted gene co-expression network analysis
WGCNA is a systems biology approach used to characterize patterns of gene correlations across diverse samples. It helps identify gene sets that exhibit strong coordinated variations. By evaluating the interconnectedness within these gene sets and their associations with phenotypes, WGCNA can identify potential biomarker genes or therapeutic targets.
The WGCNA analysis was performed using the WGCNA package in R. Genes with low variance were filtered out. Genes with standard deviation (SD) less than 0.7 were excluded using the criterion. Modules with a dissimilarity greater than 0.25 were merged to reduce redundancy. Module-trait associations were calculated with a significance threshold of p < 0.05. The correlation between modules and clinical traits was calculated, with a significance threshold of p < 0.05. To evaluate the importance of genes within each module, Gene Significance (GS) and Module Membership (MM) were calculated. GS represents the correlation between gene expression and clinical traits, with genes showing |GS| > 0.5 considered significant for further analysis. MM reflects how well a gene is associated with the overall module, and genes with |MM| > 0.8 were identified as highly relevant to the module's function. Further analysis was performed on the genes within the module that exhibited the highest |MM| value among all modules. 6
Least absolute shrinkage and selection operator for selecting specific genes
The LASSO is a statistical method used for constructing generalized linear models while simultaneously performing variable selection. By intersecting the DEGs with the significant module genes identified through WGCNA, the resulting gene intersection was subjected to LASSO analysis. This additional step is intended to further reduce dimensionality and select genes specifically associated with TNBC characteristics. 7
The LASSO analysis was carried out using the glmnet package in R. The expression data of the intersecting genes were used as input, and the outcome variable was defined based on the experimental conditions (control vs. treatment), where the response variable (y) was binary. A 10-fold cross-validation was employed to determine the optimal regularization parameter λ (lambda), with the minimum deviance used as the model selection criterion.
Differential expression and sensitivity of specific genes
The expression levels of the selected genes were analyzed differentially between the control and treatment groups, followed by the generation of box plots to visualize the differences. The significance of the differences was assessed using p-value thresholds of p < 0.001, p < 0.01, p < 0.05, and ns (not significant). Sensitivity analysis was performed using ROC curve analysis to assess the diagnostic performance of the selected genes. For each gene, an ROC curve was plotted to evaluate its ability to distinguish between the control and treatment groups. The Area Under the Curve (AUC) was used as a measure of the sensitivity of each gene, with a larger AUC indicating higher sensitivity. Bootstrap resampling was applied to calculate the 95% confidence intervals (CI) for the AUC. An AUC value of 0.7 to 0.8 indicates moderate diagnostic performance, 0.8 to 0.9 indicates good performance, and greater than 0.9 indicates excellent performance. 8
Impact of specific genes on the prognosis of TNBC
Kaplan-Meier analysis (http://kmplot.com/analysis/) is an online tool used to evaluate the impact of gene expression on the survival of patients with breast cancer, ovarian cancer, lung cancer, and gastric cancer. In the breast cancer dataset, TNBC patients were divided into two groups—high expression and low expression—based on the median expression level of the specific gene. The prognostic significance of the gene for TNBC patients’ overall survival (OS) and progression-free survival (PFS) was evaluated. Additionally, the p-values from the prognostic analysis were adjusted using false discovery rate (FDR) correction. A log-rank p-value of < 0.05 was considered statistically significant. 9
Cell culture and treatment
MDA-MB-231, MFM-223, CAL-148 and MCF-10A, were obtained from the School of Pharmacy, Chongqing Medical University. The cell culture medium was prepared by 10% fetal bovine serum (Gibco, USA) and 1% penicillin-streptomycin solution (Gibco, USA) to RPMI-1640 (Gibco, USA) basic culture medium, and it was stored at 4°C. MDA-MB-231, MFM-223, CAL-148 and MCF-10A were cultured at 37°C, 5% CO2.
Real time-quantitative polymerase chain reaction assay
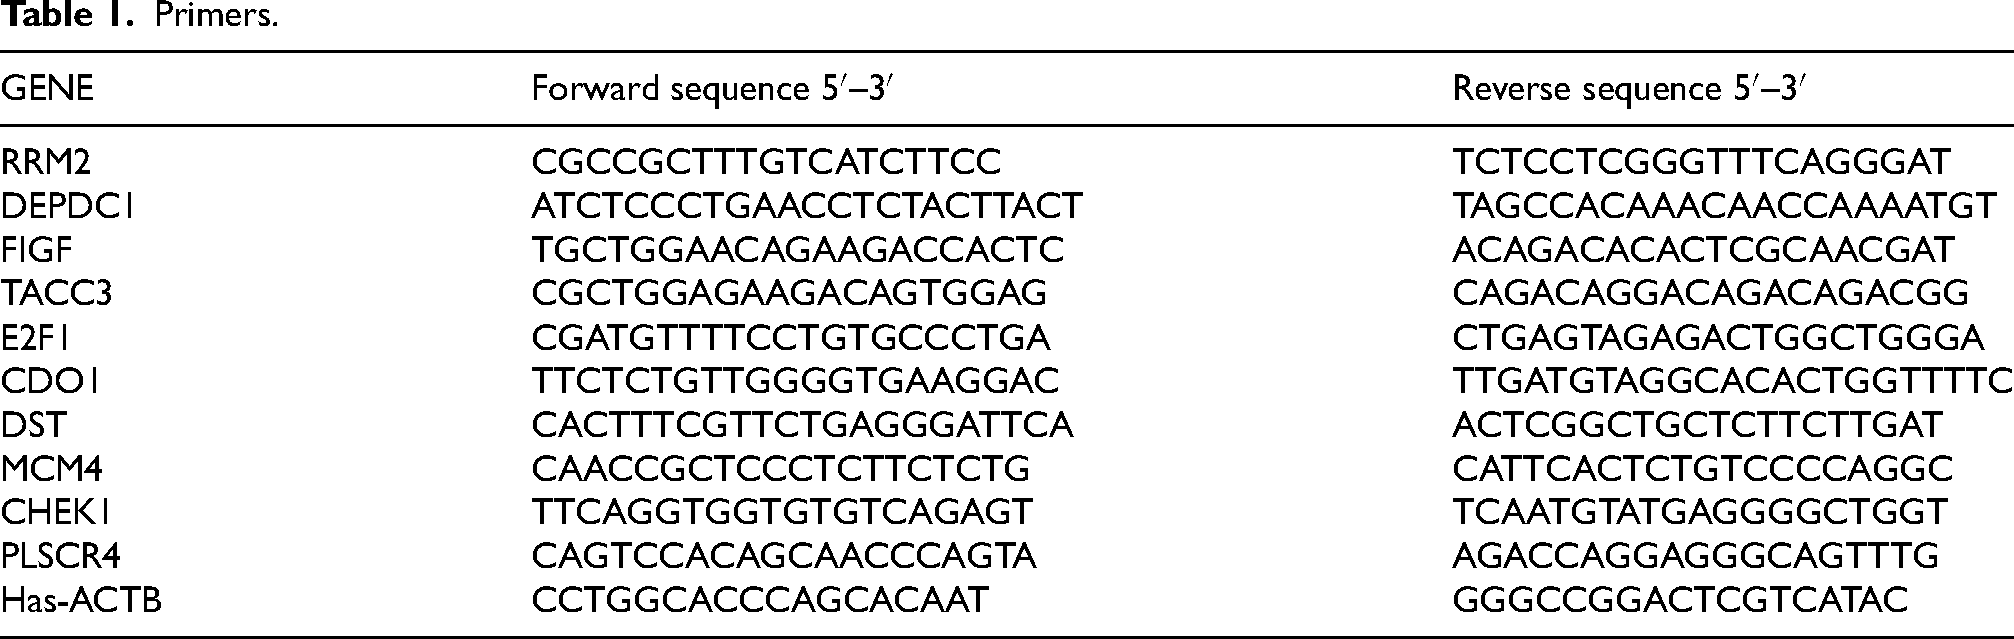
Total RNA was isolated from MDA-MB-231 MFM-223, CAL-148 and MCF-10A, Trizol (Vazyme, China, Nanjing) was used to extract total RNA according to the manufacturer's protocol. Nanodrop (Thermo Scientific, USA) Microspectrophotometer was used to determine the concentration of RNA, levels of RRM2, DEPDC1, FIGF, TACC3, E2F1, CDO1, DST, MCM4, CHEK1, PLSCR4 were measured by RT-qPCR. 1 μL total RNA, 2 μL Universal SuperMix (Bimake, China) and 7 μL of RNase-free H2O for the mRNA reverse transcription to get the cDNA template. RT-qPCR was processed in the following reaction: 0.25 μL of forward and reverse primer (5 μM), 4.5 μL of cDNA template, and 5 μL of SYBR green SuperMix (Bimake, Wuhan) at 95 °C for 30 s and then for 15 s, followed by 40 cycles of 60 °C for 15 s and 70 °C for 15 s. The primers were synthesized by Accurate Biotechnology (Hunan, China), as shown in Table 1 for details. The relative expression levels of RRM2, DEPDC1, FIGF, TACC3, E2F1, CDO1, DST, MCM4, CHEK1, PLSCR4 mRNA were depicted as 2(−△△CT).
Primers.
Statistical analysis
The datas are presented as the mean ± SD. Statistical significance was determined by t-test, GraphPad Prism 6.01 (GraphPad Software, USA) was adopted to statistical analysis, p < 0.05 was regarded as statistically significant.
Results
Identification of DEGs from GEO
A total of 75 microarray datasets were initially retrieved. After alignment, two gene expression profiles, GSE38959 and GSE53752, were selected for inclusion in the study. GSE38959 comprises 30 surgically resected TNBC tissues and 13 normal mammary ductal cells, while GSE53752 consists of 51 TNBC tissues and 25 normal breast tissues.
PCA revealed that the control and treatment group samples were dispersed between different groups but clustered within their respective groups, indicating that the chip grouping design used in the study was relatively reliable. Comparison of the datasets identified a total of 16,208 genes with altered expression. Of these, 243 genes showed significant differential expression changes, with 102 genes upregulated and 141 genes downregulated, as illustrated in Figure 2.
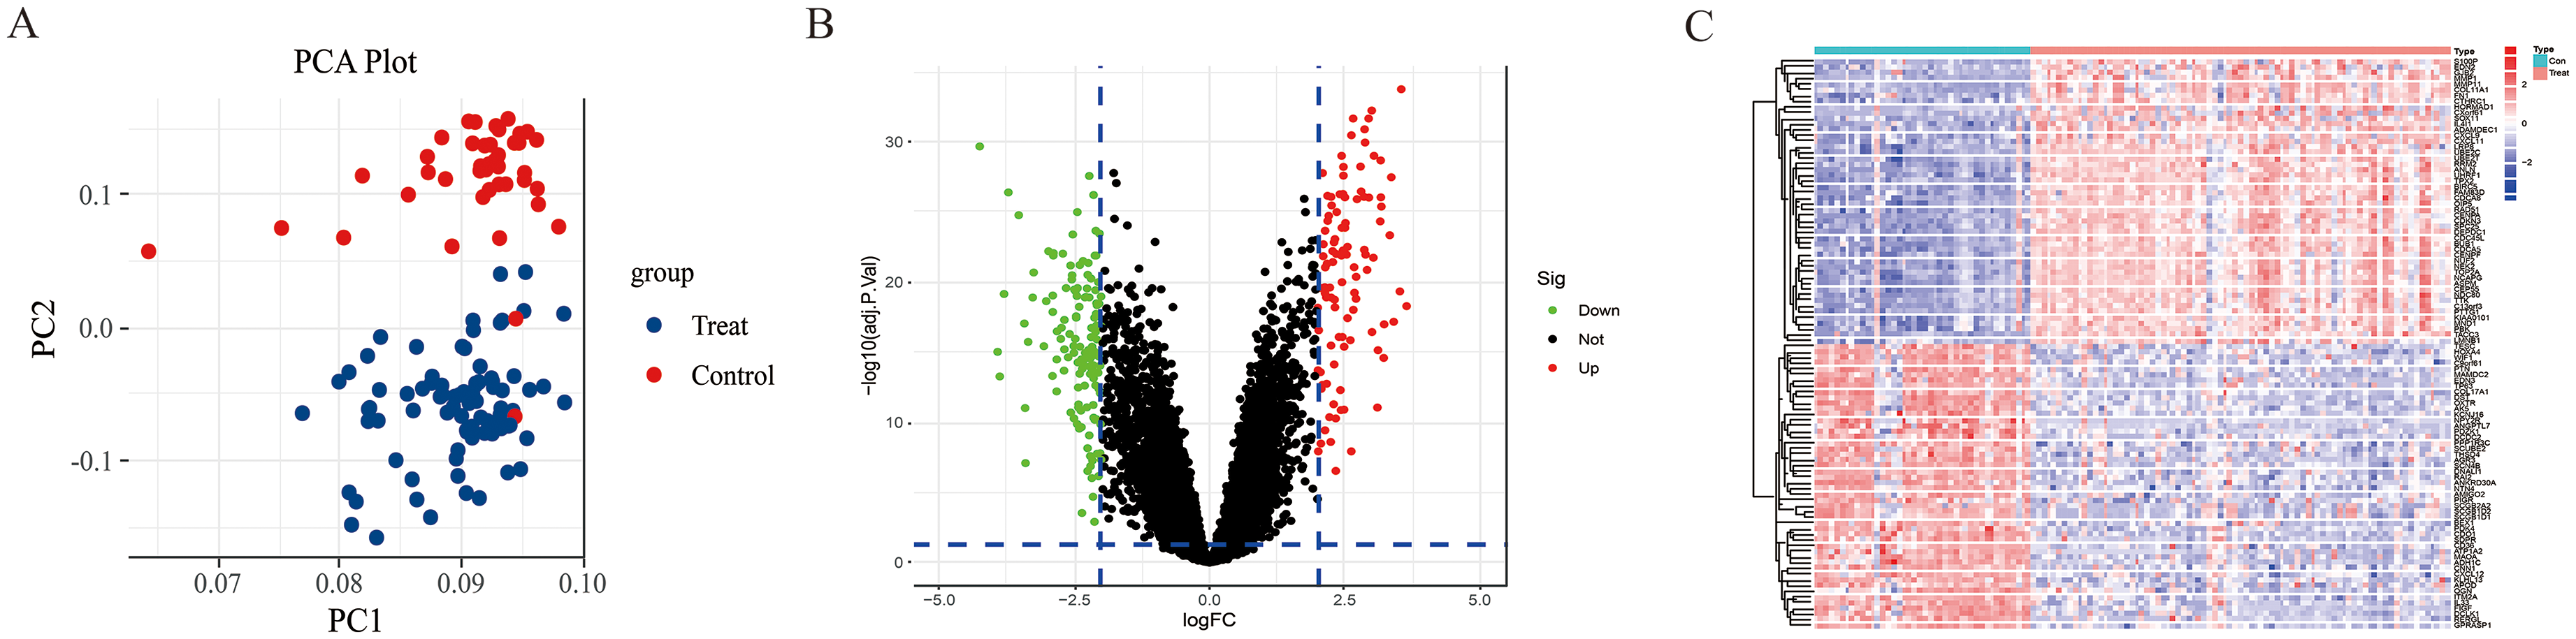
Significantly differentially expressed genes. A. PCA plot of the control and treat group. B. Volcano plot of 243 DEGs. C. Heatmap of control and treat group.
Functional and enrichment analysis of DEGs
GO and KEGG analyses were performed on the 243 DEGs. The circular graph displays the results, with the outermost layer representing GO/KEGG IDs. The second layer shows the number of genes associated with each GO/KEGG term. The third layer illustrates the number of DEGs enriched in each GO/KEGG term, with darker colors indicating a higher count in the second layer. The bar chart within each circle depicts the proportion of DEGs relative to the total.
In terms of BP, the highly ranked terms include nuclear division, chromosome segregation, and nuclear chromosome segregation. For CC, prominent terms are the collagen-containing extracellular matrix, chromosomal region, and spindle. Regarding MF, notable terms encompass receptor ligand activity, signaling receptor activator activity, and extracellular matrix structural constituent. The top enriched pathways include the PI3K-Akt signaling pathway, cell cycle, and cytokine-cytokine receptor interaction, as illustrated in Figure 3.
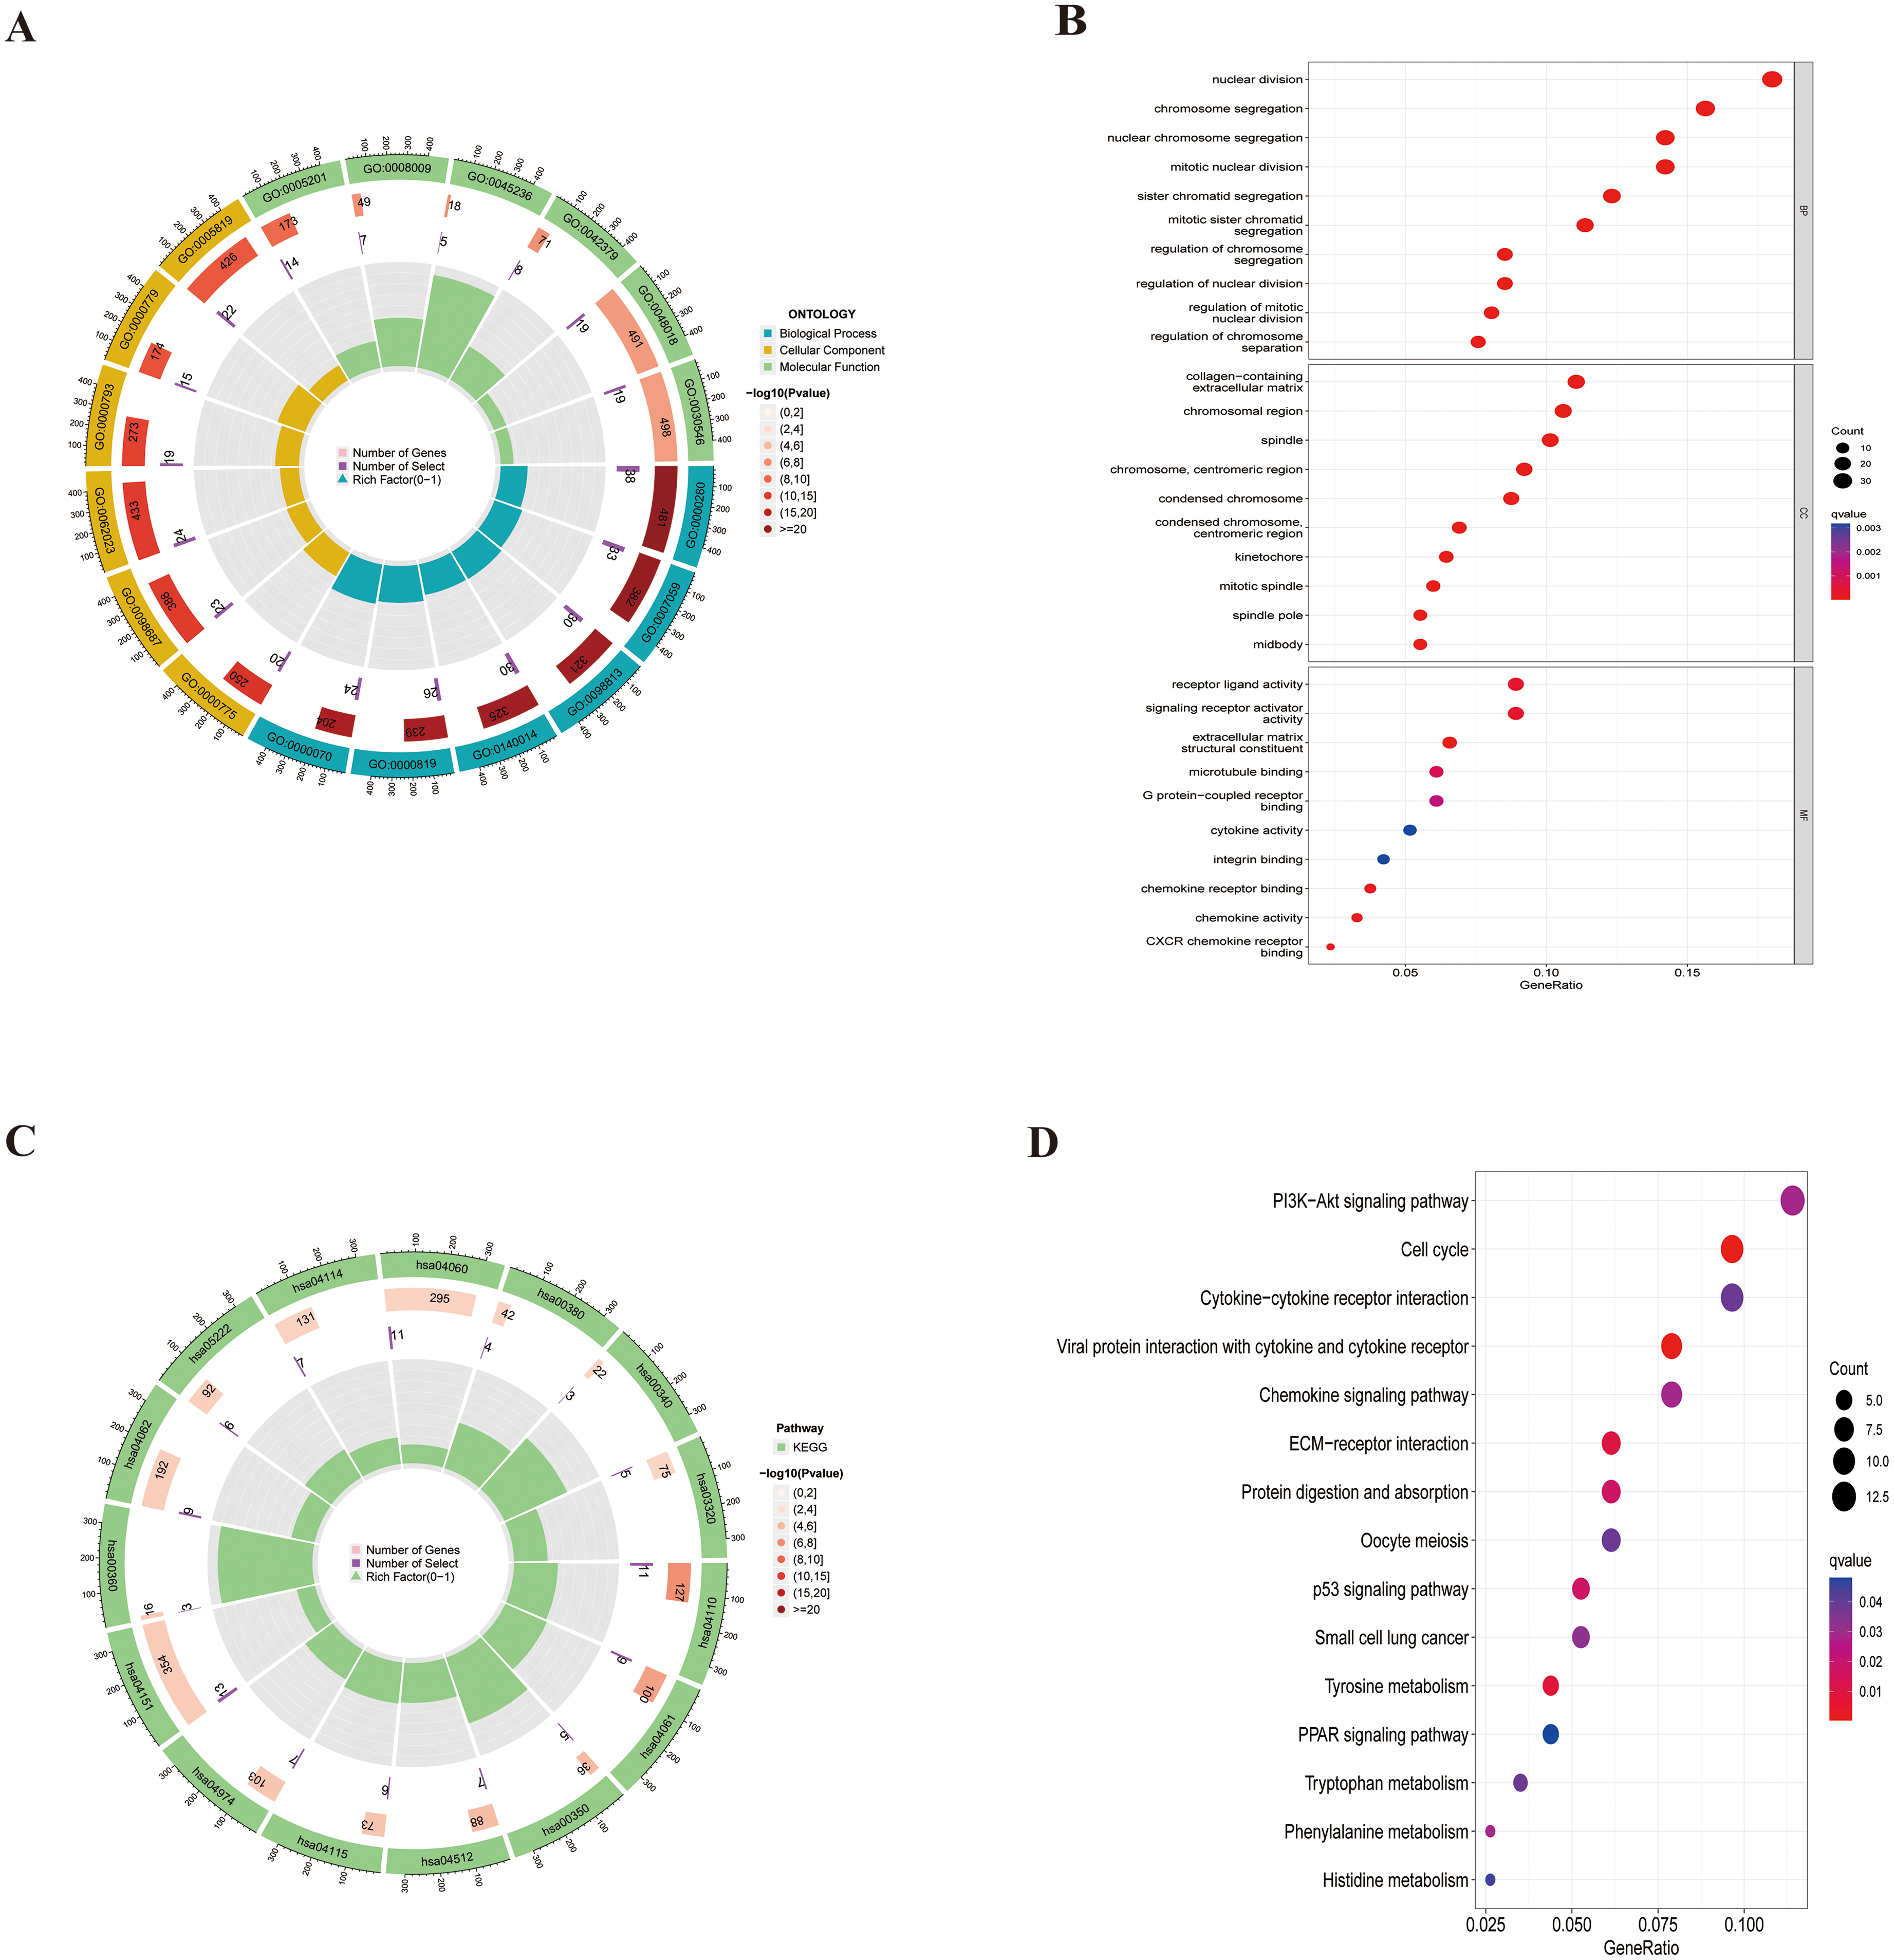
Differential gene enrichment analysis: A: Circular plot for GO enrichment of DEGs; B: Enrichment analysis of DEGs in BP, CC, and MF; C: Circular plot for KEGG pathway enrichment of DEGs; D: Enrichment analysis of DEGs in pathways.
WGCNA analysis to identify module genes
The 16,208 genes identified in section 3.1 underwent WGCNA to identify gene modules most strongly correlated with TNBC. Modules with a dissimilarity < 0.25 were merged, and genes that could not be categorized into any module were assigned to the grey module, which was excluded from further analysis. The results, shown in Figure 4, reveal a total of 10 modules. Among these, the blue module represents a negative correlation, while the red module indicates a positive correlation; darker colors denote higher correlation. The findings suggest that genes within the turquoise module exhibit the highest correlation with TNBC. The intersection of the 243 DEGs with the genes in the turquoise module (119 genes) shows an overlap of 80 genes.
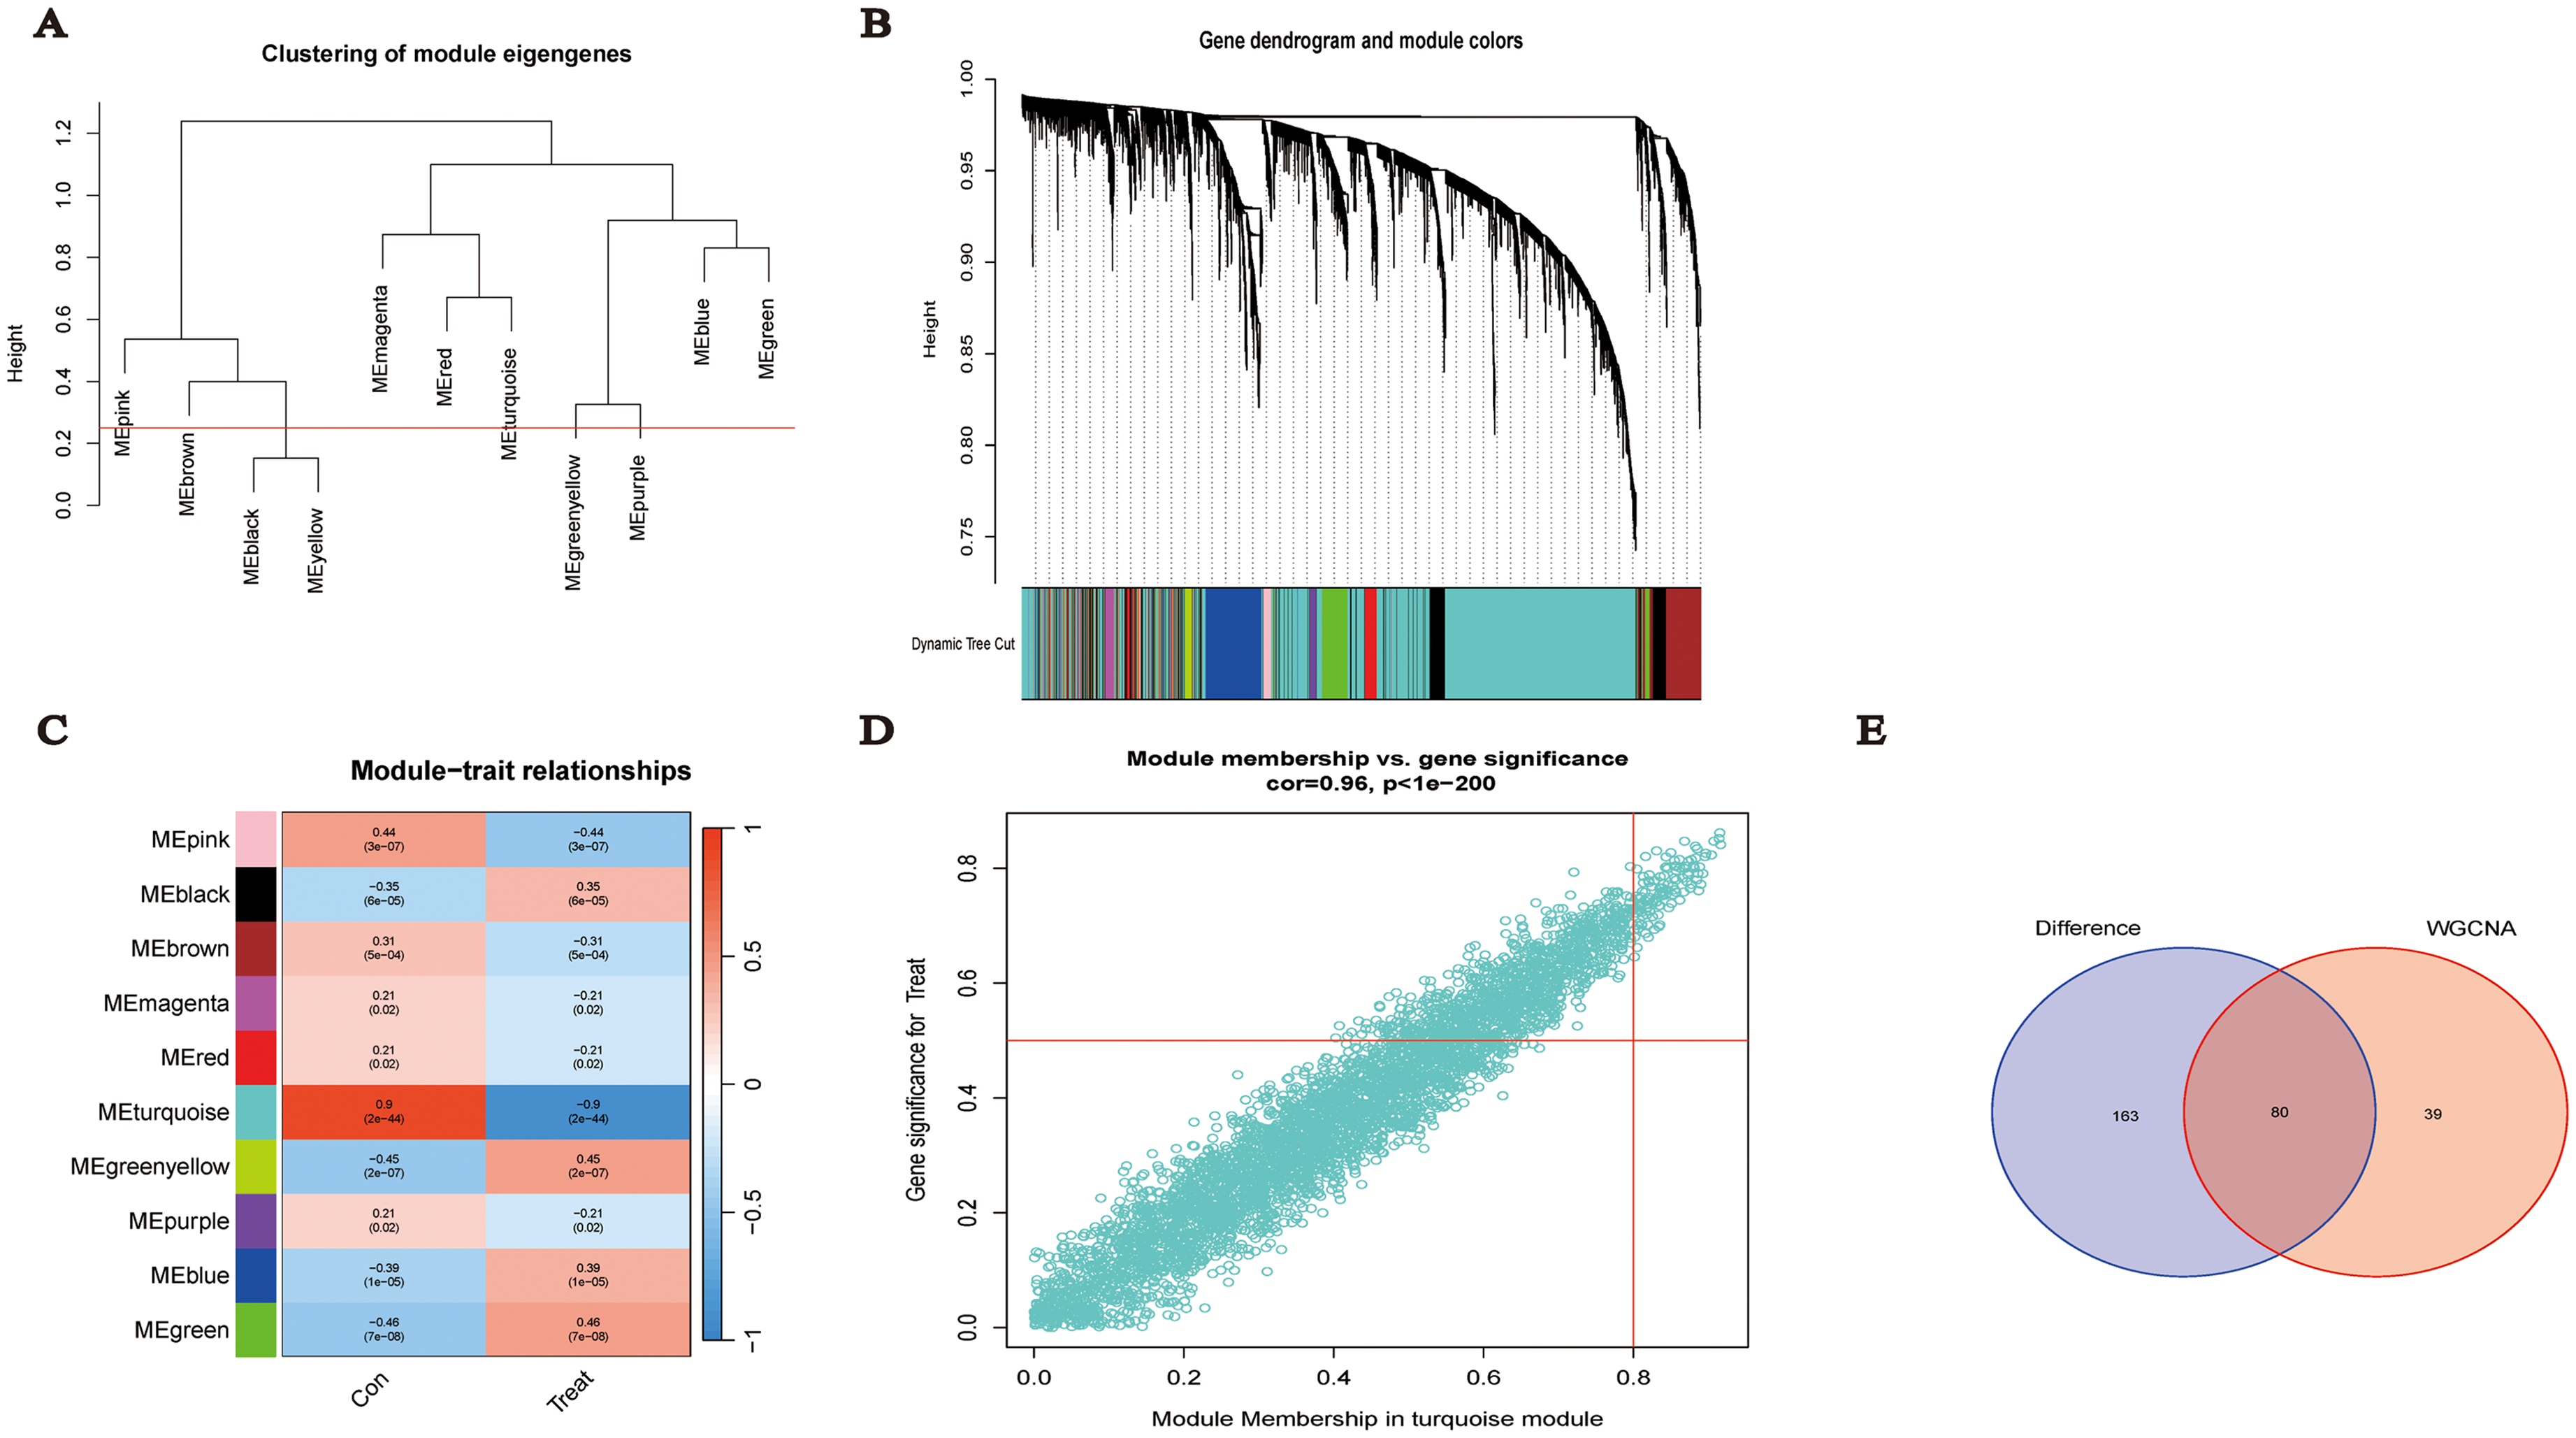
WGCNA analysis results A: Dendrogram of dissimilarity between modules. B: Gene dendrogram based on dissimilar (1-TOM) clustering. C: Correlation between modules and clinical features. D: Module membership and gene significance in turquoise module. E: Venn diagram of DEGs and WGCNA.
LASSO regression analysis to identify specific genes
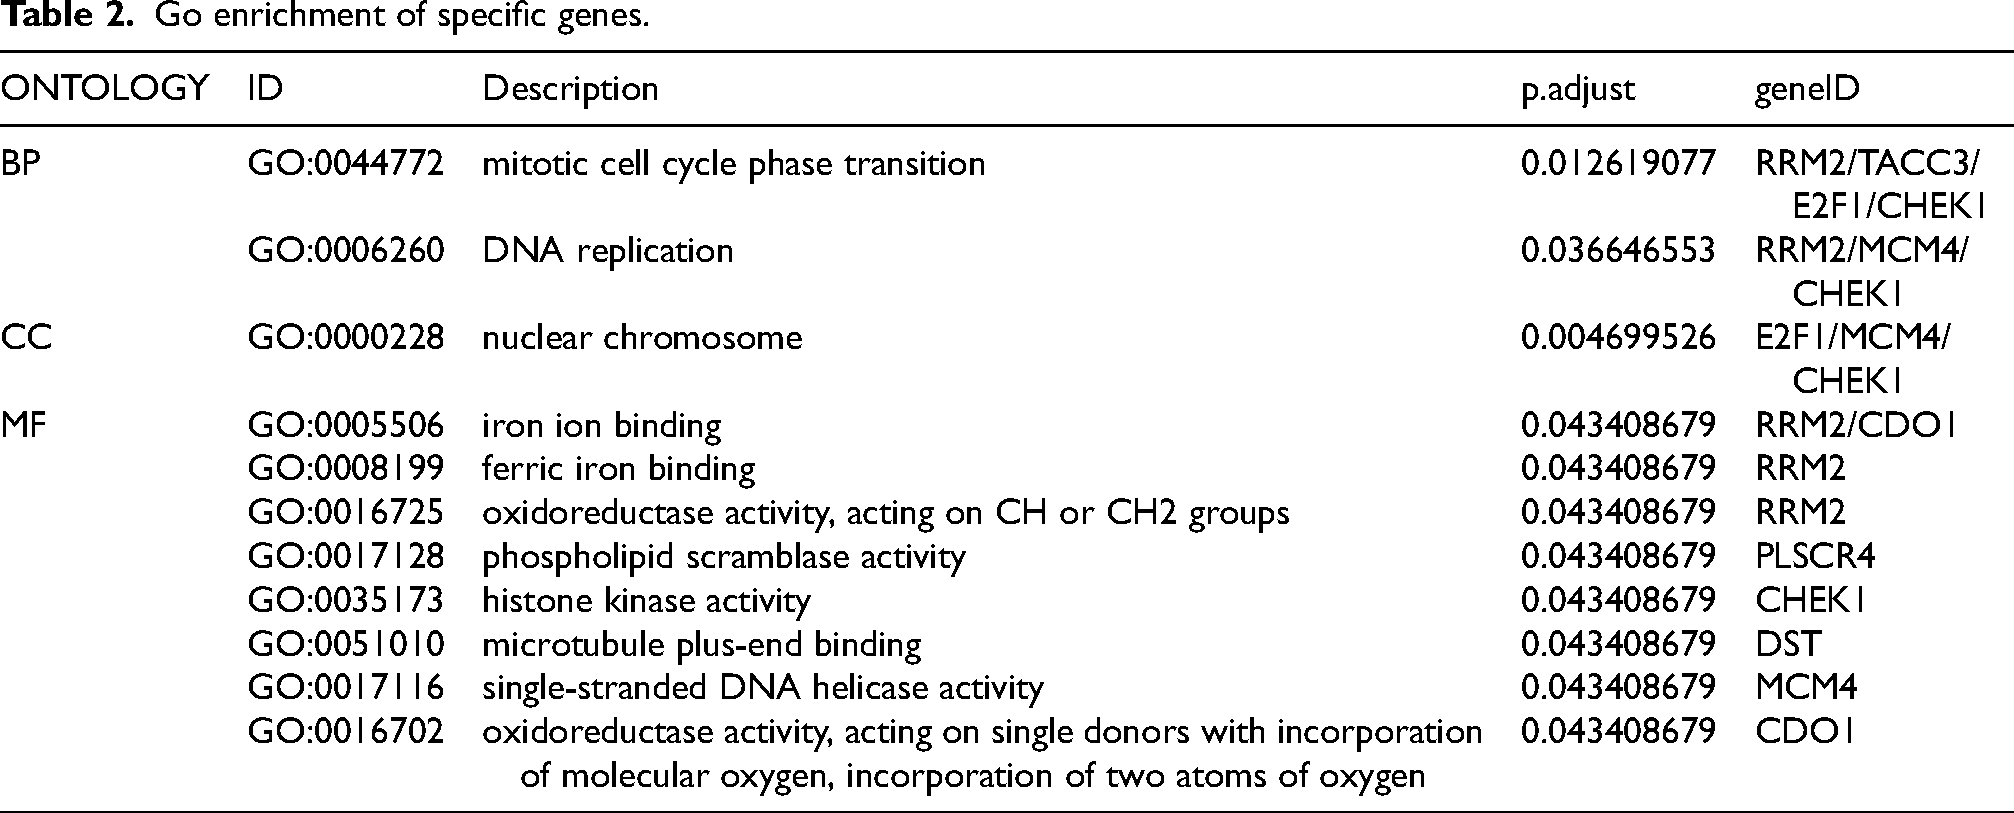
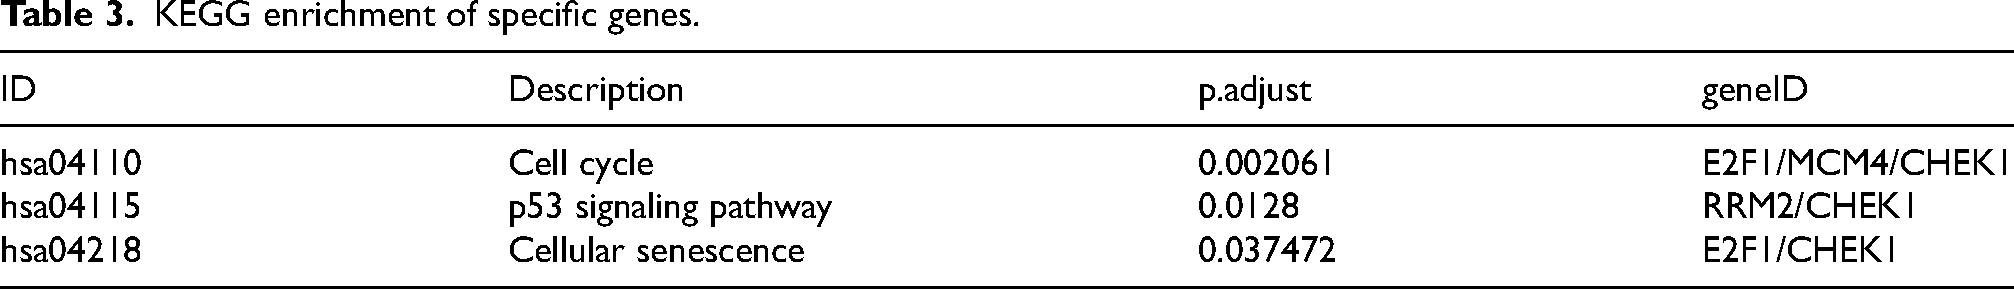
The 80 genes identified in section 3.3 underwent LASSO regression analysis, and genes with the smallest errors were selected for validation. Ultimately, 10 specific genes were identified: RRM2, DEPDC1, FIGF, TACC3, E2F1, CDO1, DST, MCM4, CHEK1, and PLSCR4, as shown in Figure 5. GO enrichment analysis indicated that the primary biological functions of these specific genes were associated with the mitotic cycle, nuclear chromosome organization, and iron ion binding. The regulatory pathways of these specific genes primarily include the cell cycle, p53 signaling pathway, and cell senescence pathway, as detailed in Tables 2 and 3.
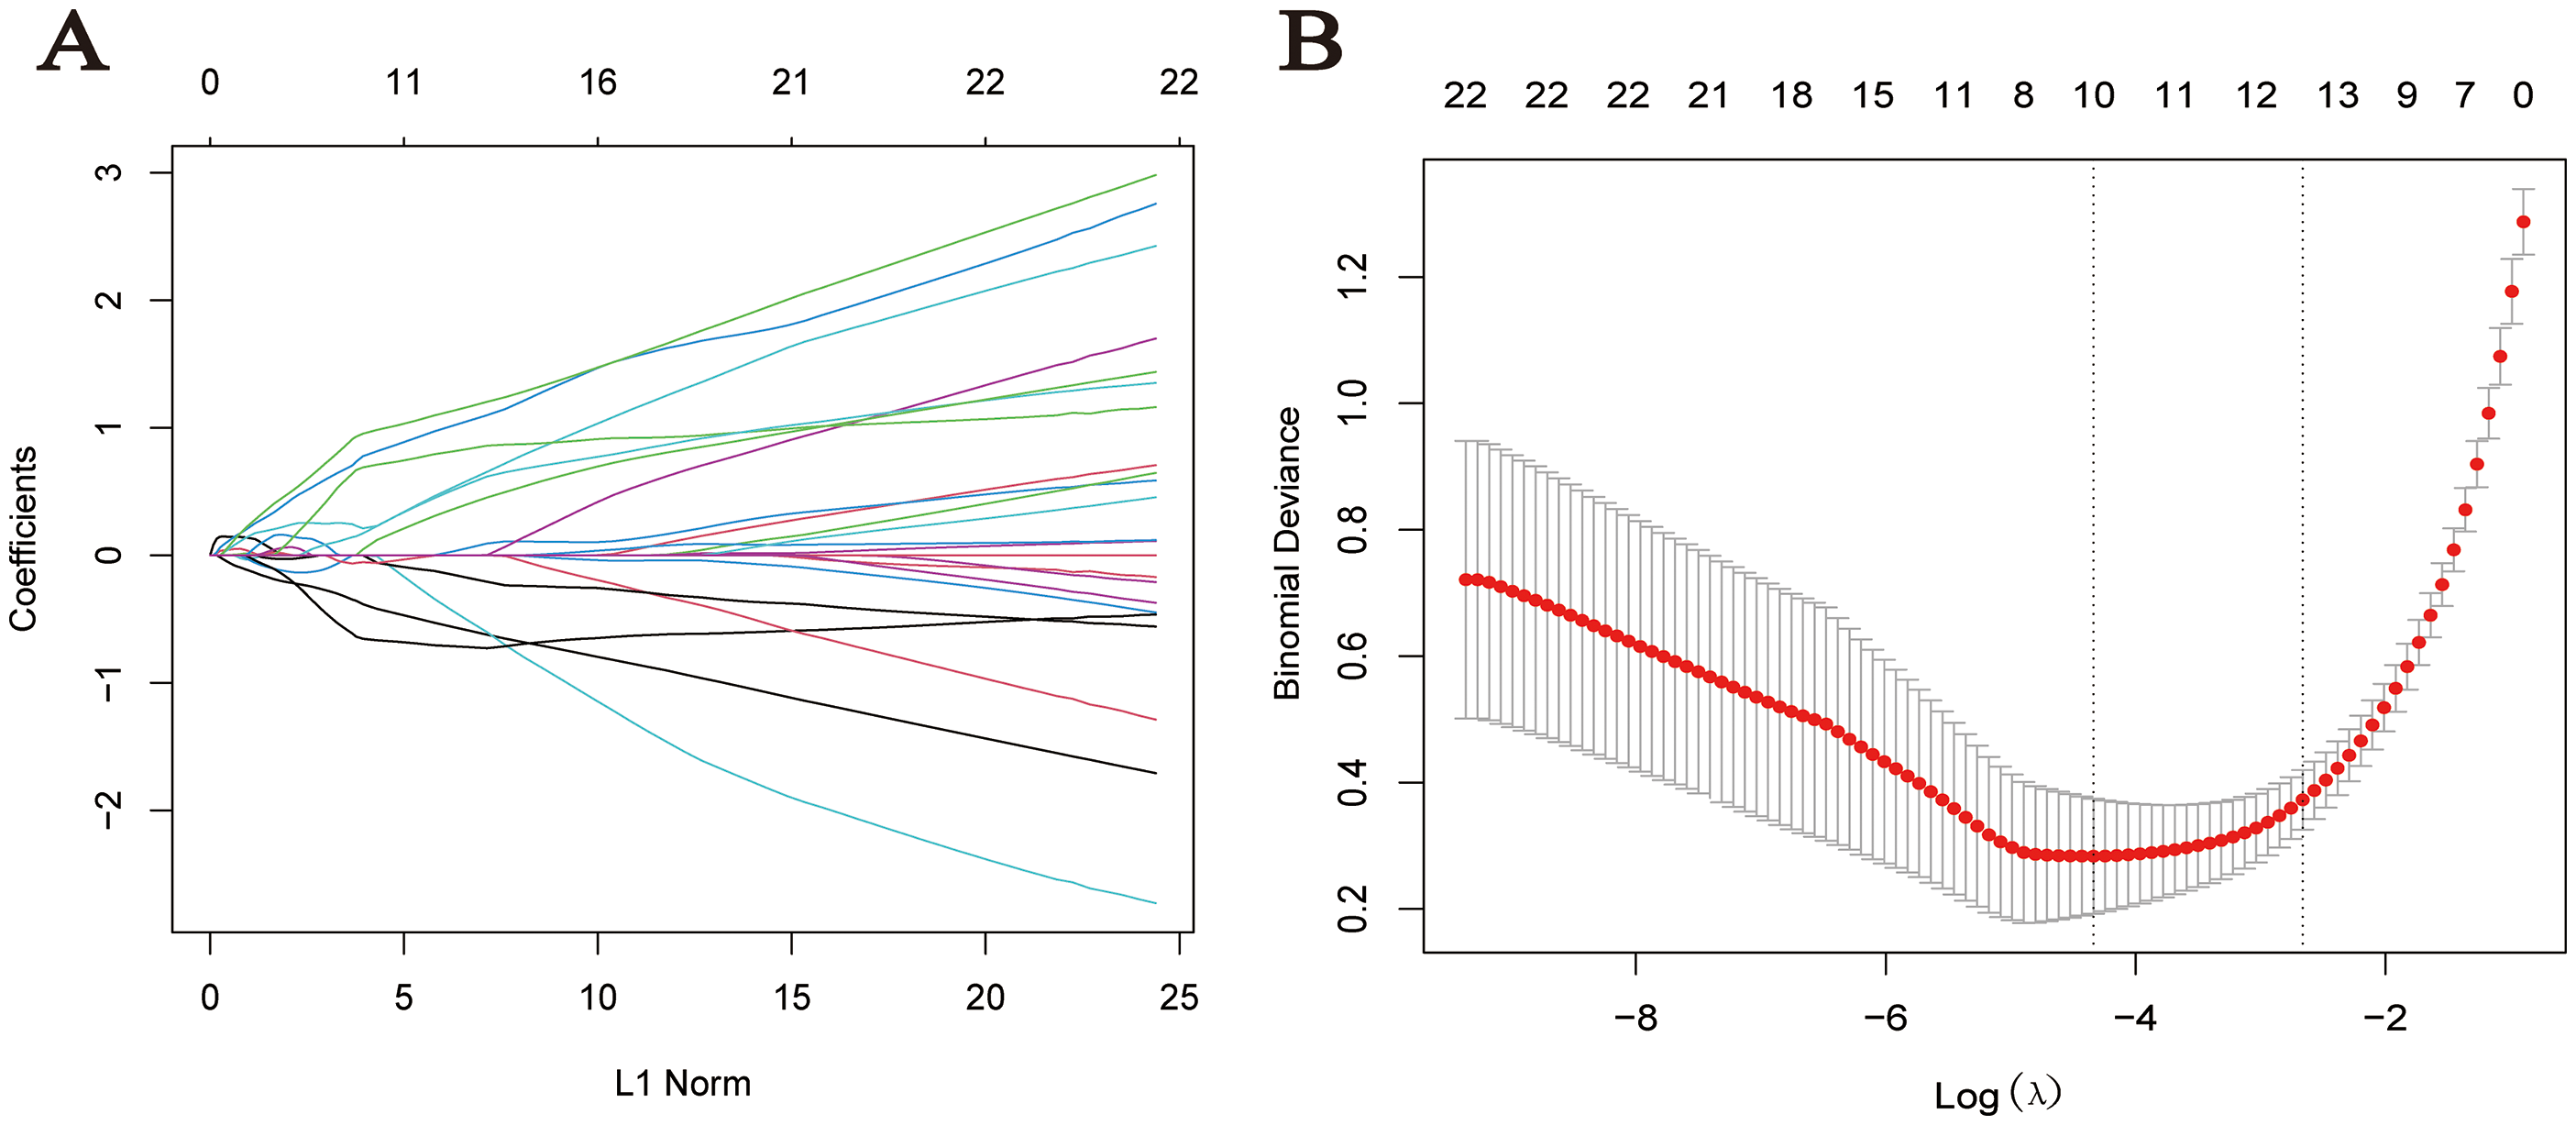
LASSO regression: A: Cross-validation curve; B: Coefficient distribution plot.
Go enrichment of specific genes.
KEGG enrichment of specific genes.
Inter-group expression and sensitivity validation of specific genes
The expression differences of the 10 genes between the control and treatment groups were depicted using box plots. The results show significant expression differences for all 10 genes, as illustrated in Figure 6-1.
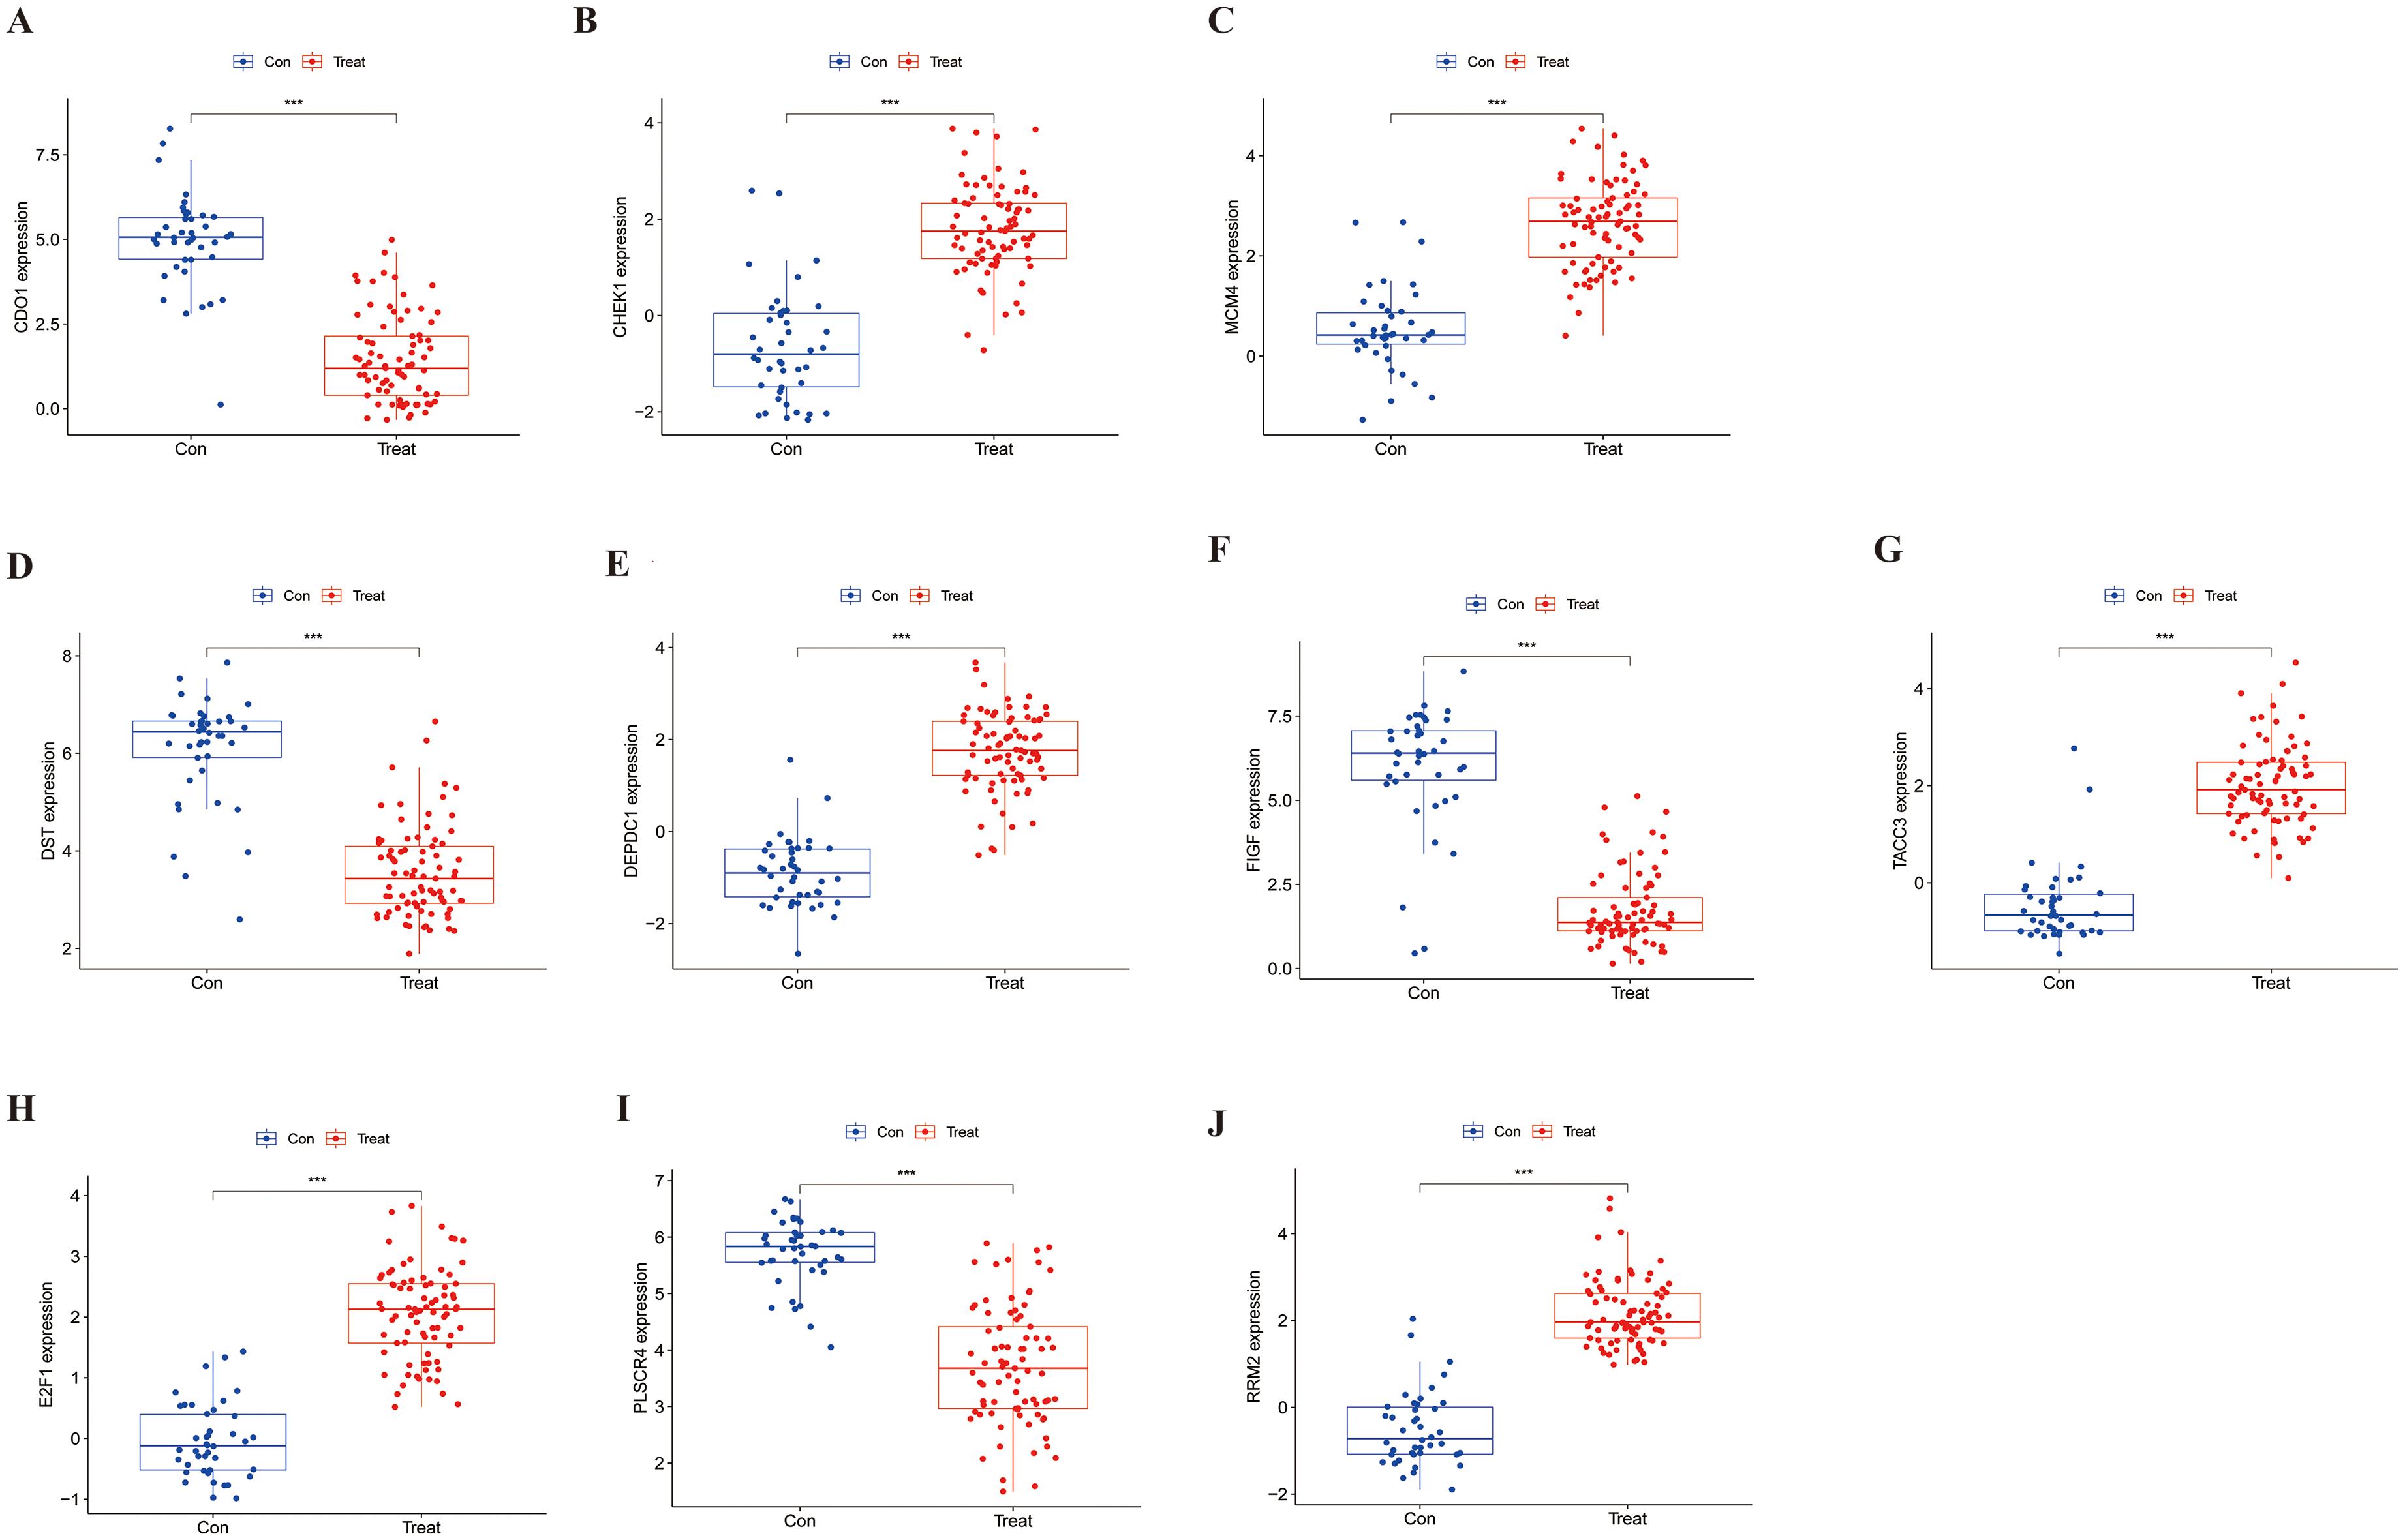
Box plots of specific gene expression: A. CDO1 B. CHEK1 C. MCM4 D. DST E. DEPDC1 F. FIGF G. TACC3 H. E2F1 I. PLSCR4 J. RRM2.
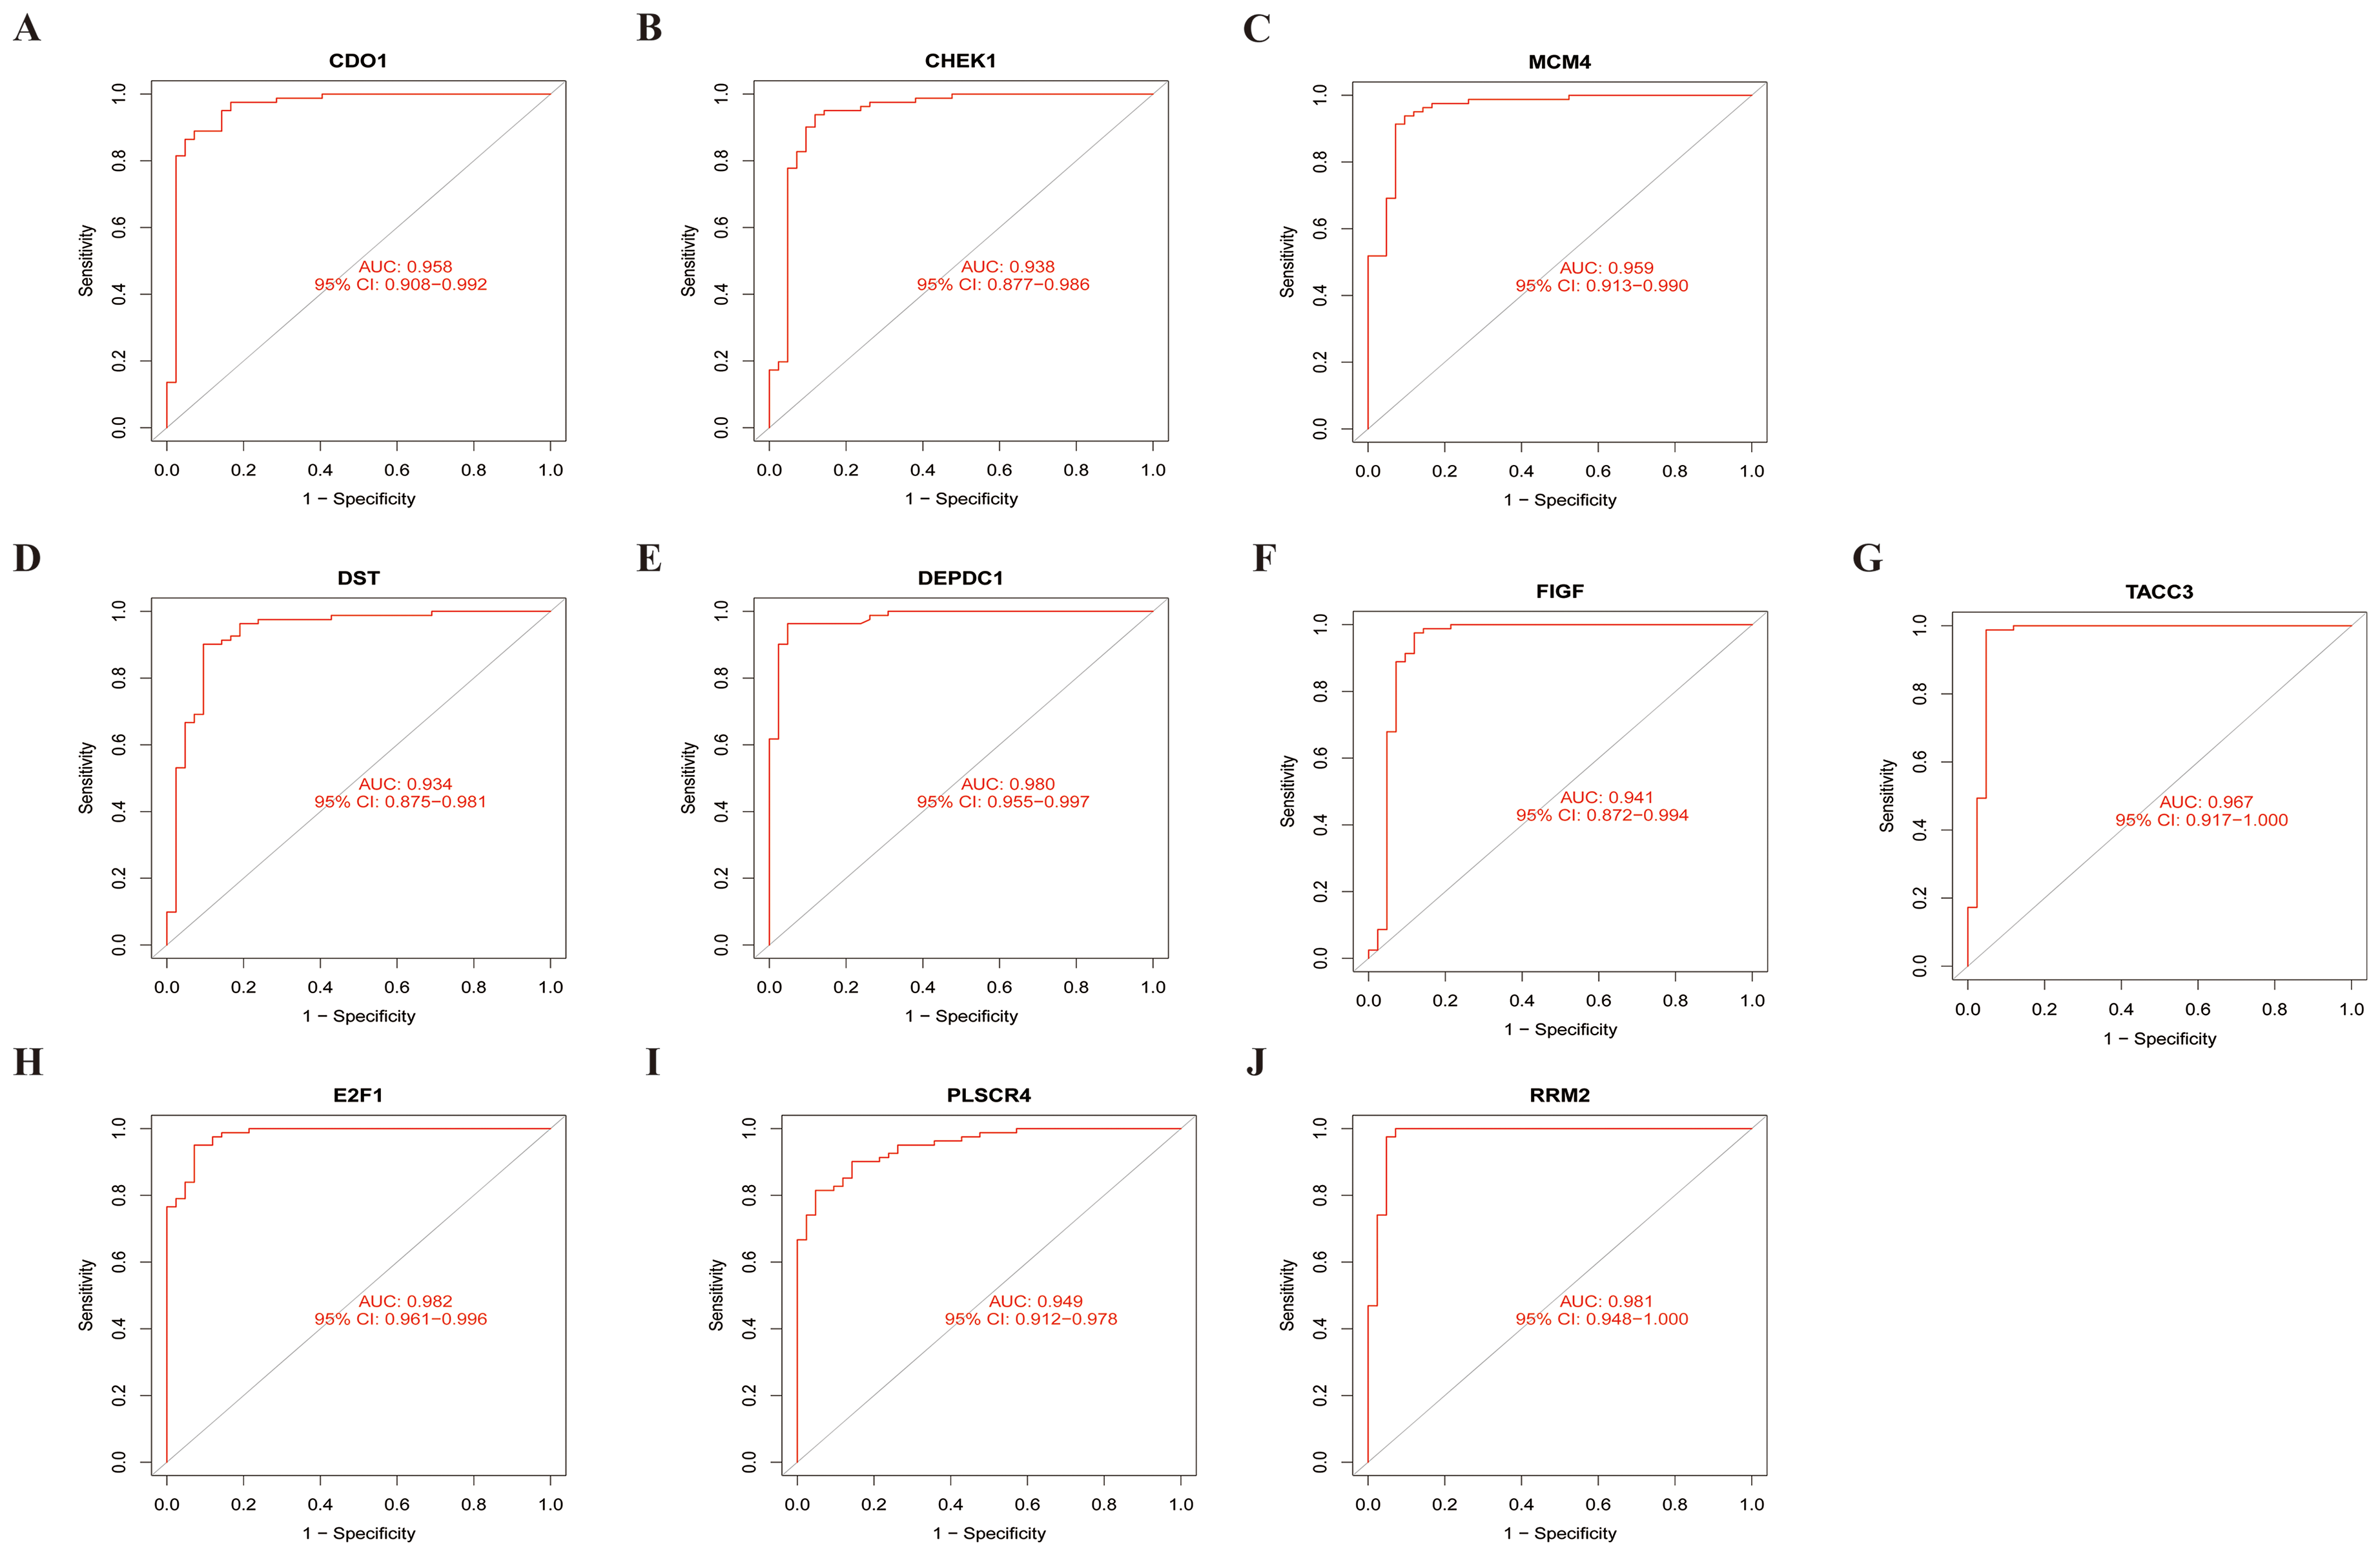
Sensitivity of specific genes: A. CDO1 B. CHEK1 C. MCM4 D. DST E. DEPDC1 F. FIGF G. TACC3 H. E2F1 I. PLSCR4 J. RRM2.
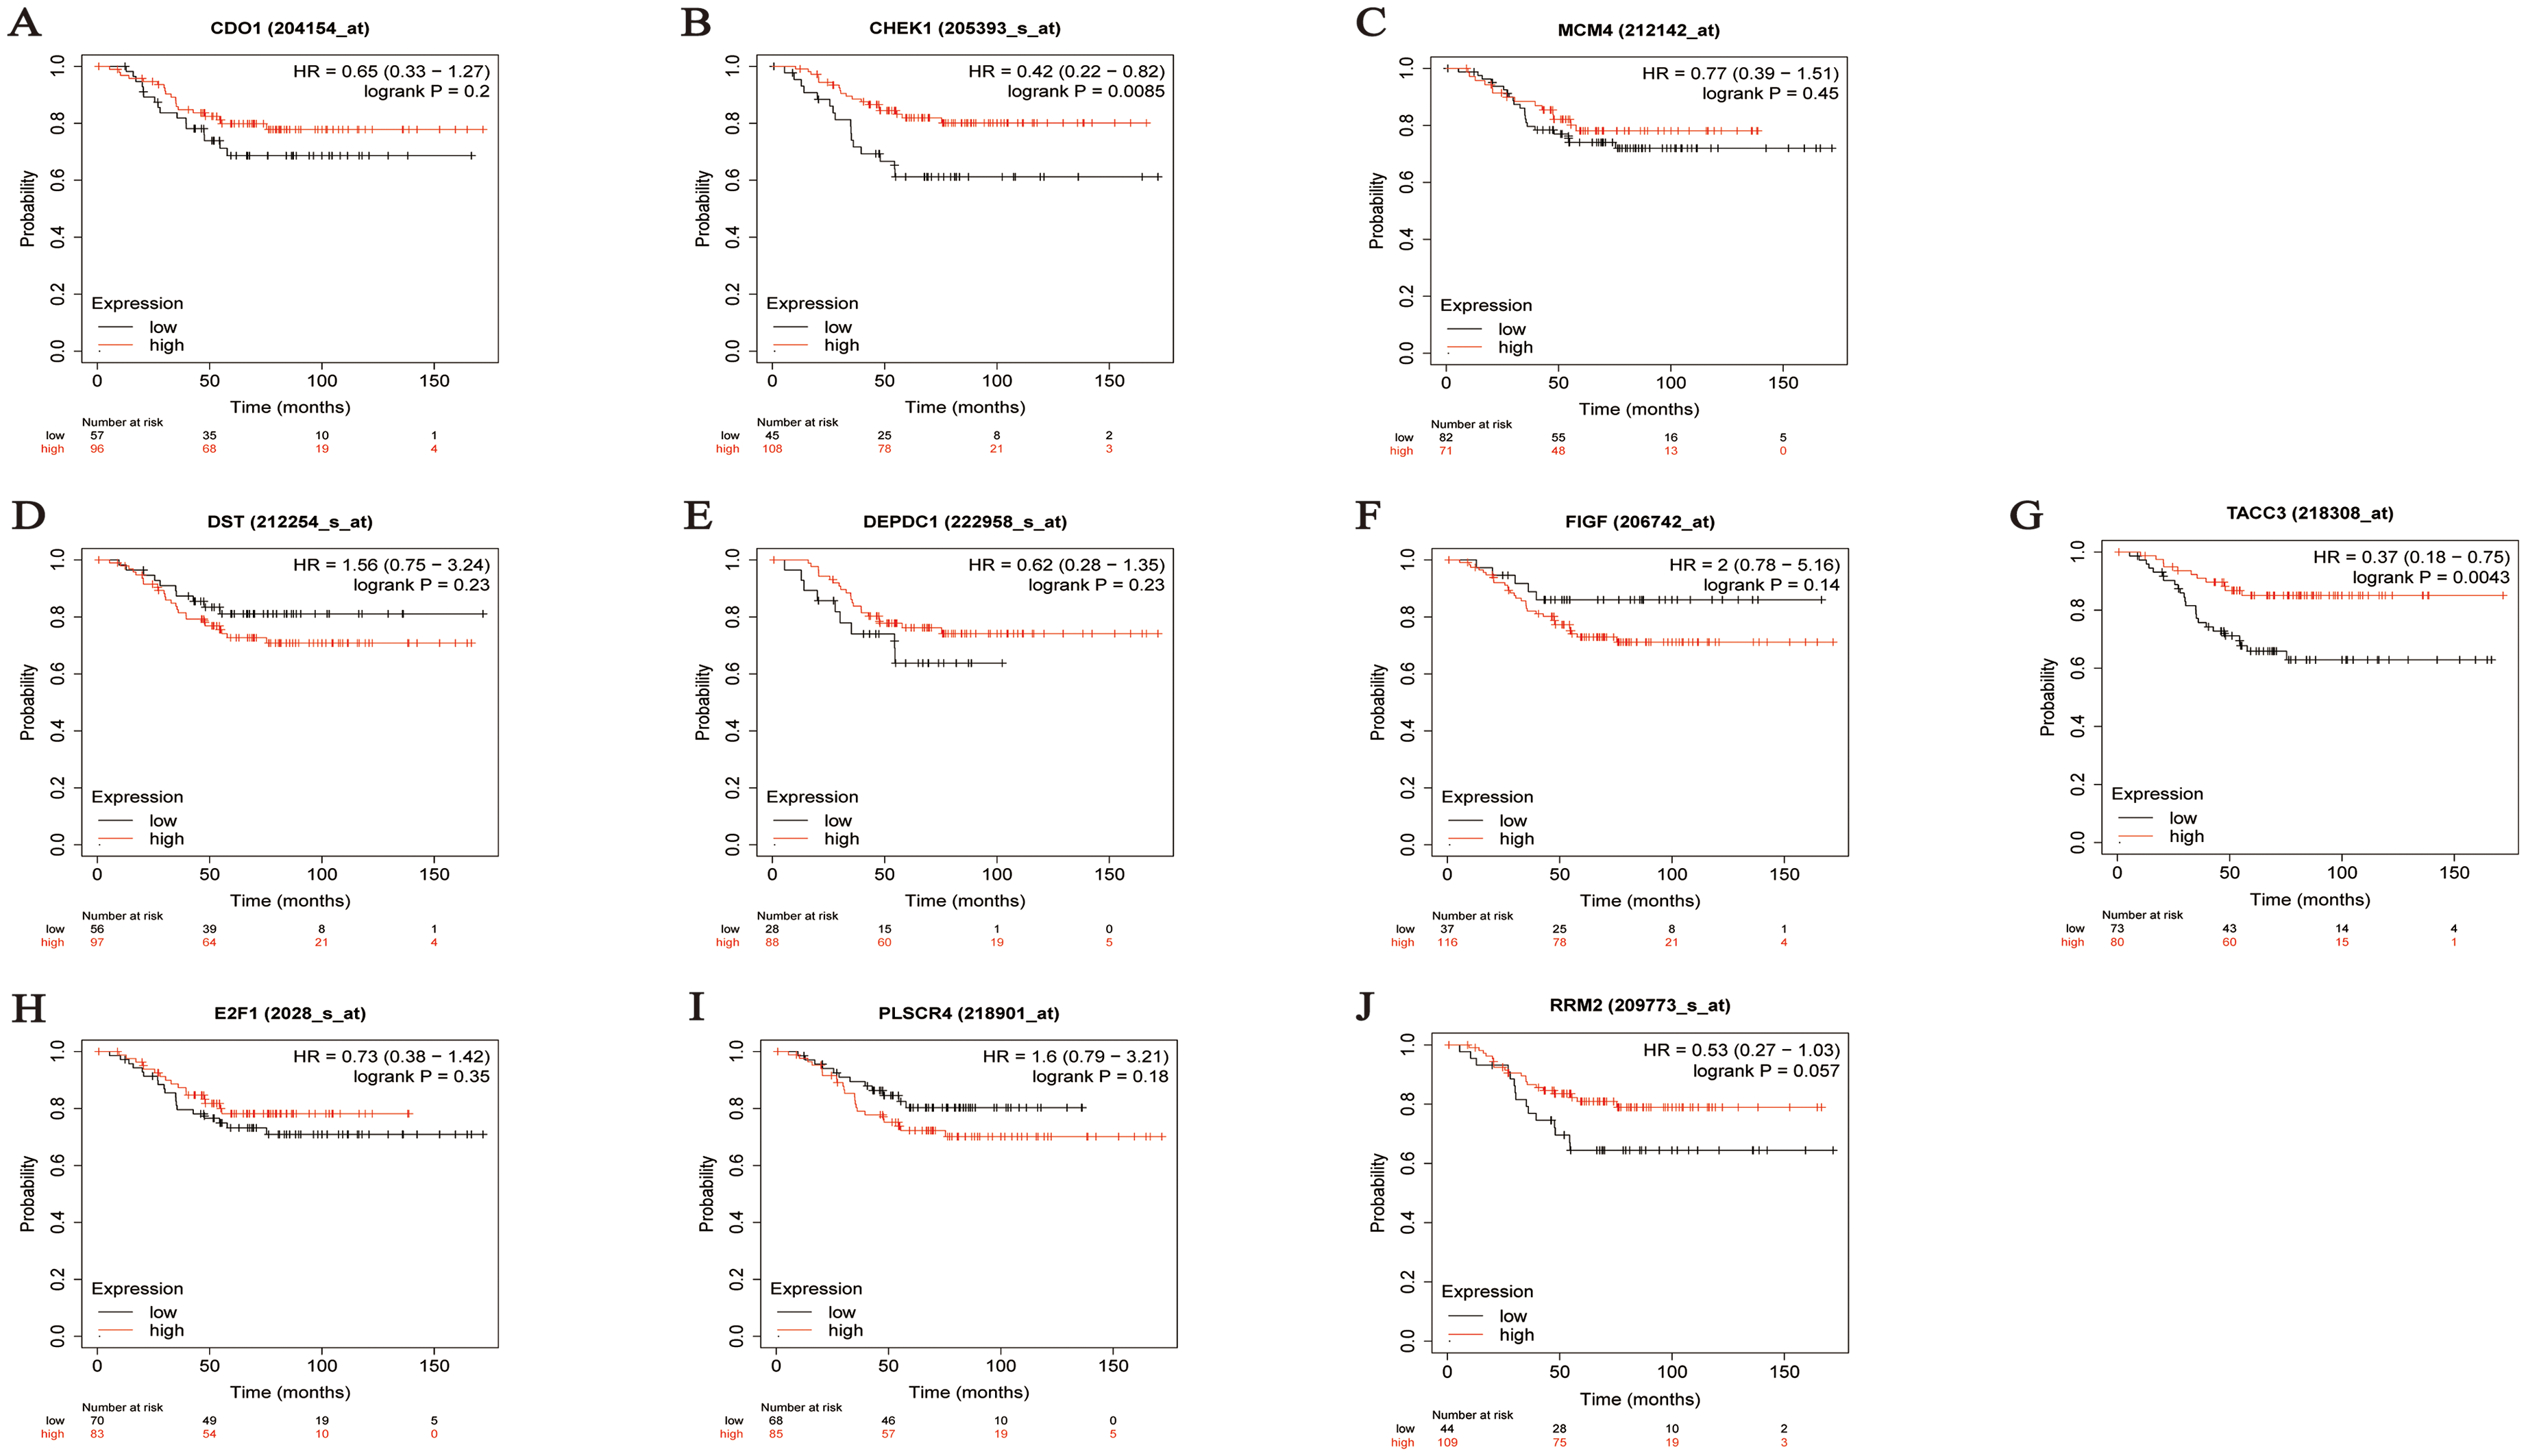
Prognostic analysis of specific genes in TNBC patients (OS analysis): A. CDO1 B. CHEK1 C. MCM4 D. DST E. DEPDC1 F. FIGF G. TACC3 H. E2F1 I. PLSCR4 J. RRM2.
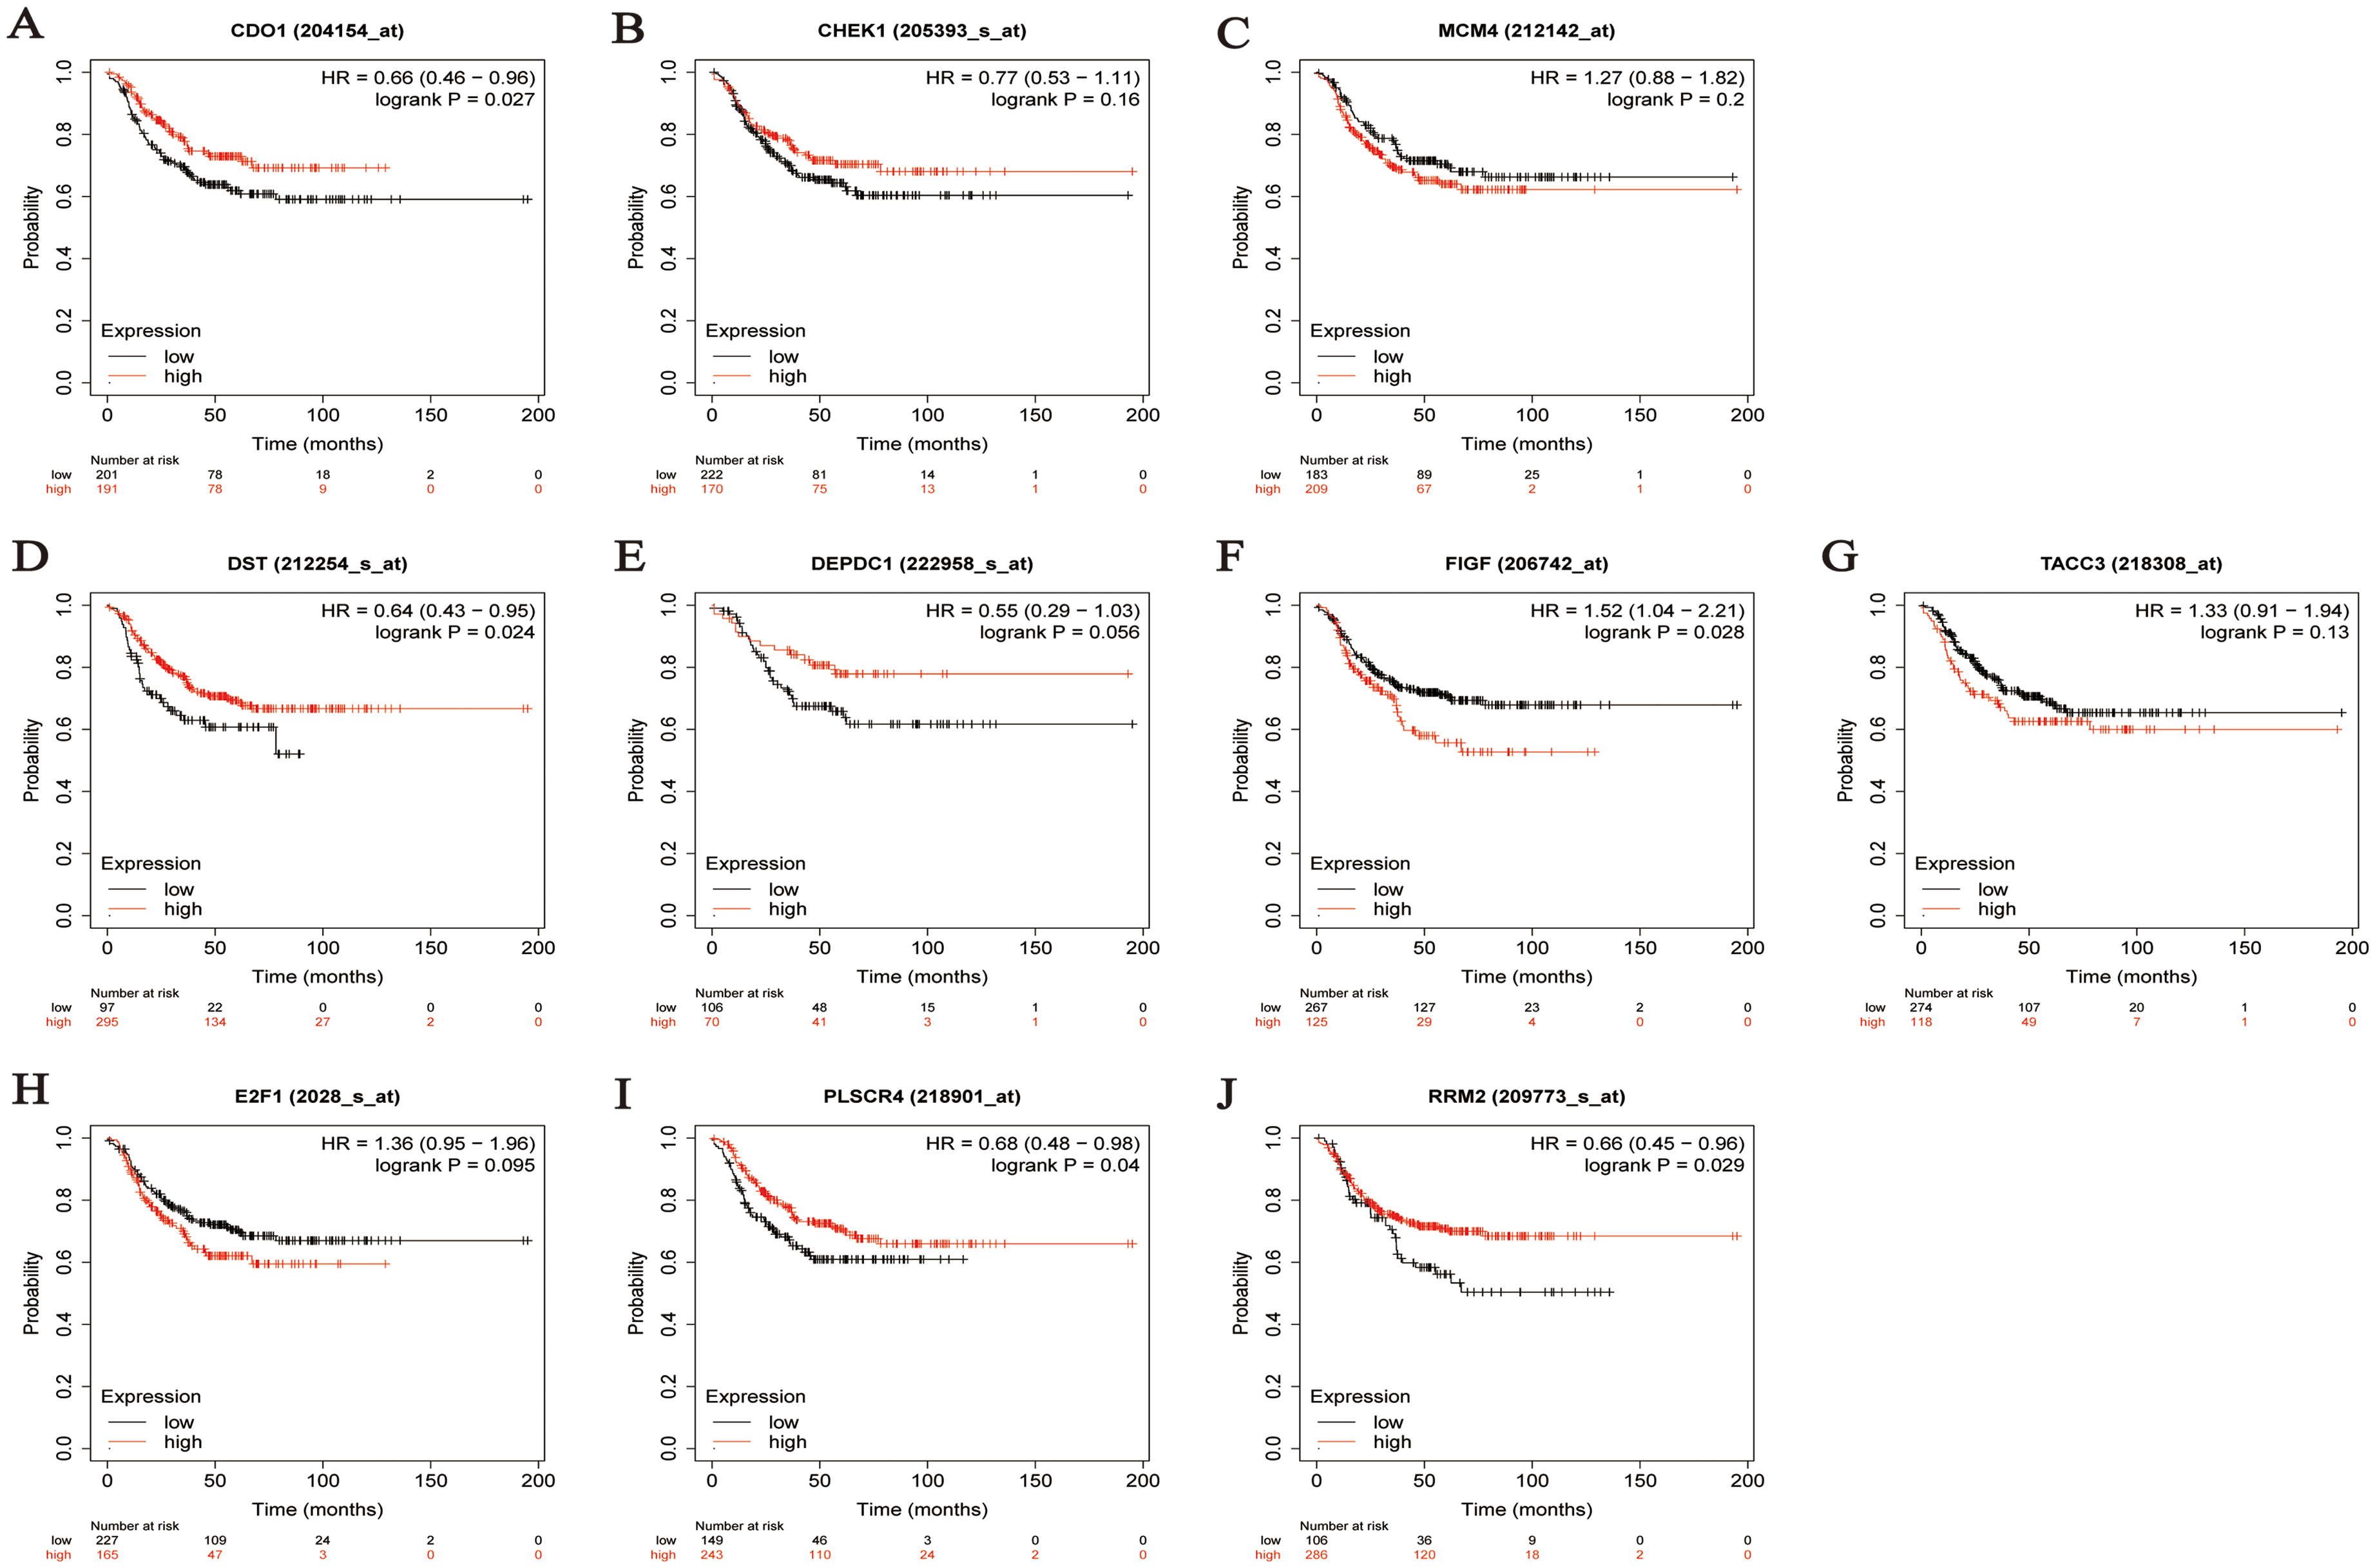
Prognostic analysis of specific genes in TNBC patients (PFS analysis) A. CDO1 B. CHEK1 C. MCM4 D. DST E. DEPDC1 F. FIGF G. TACC3 H. E2F1 I. PLSCR4 J. RRM2.
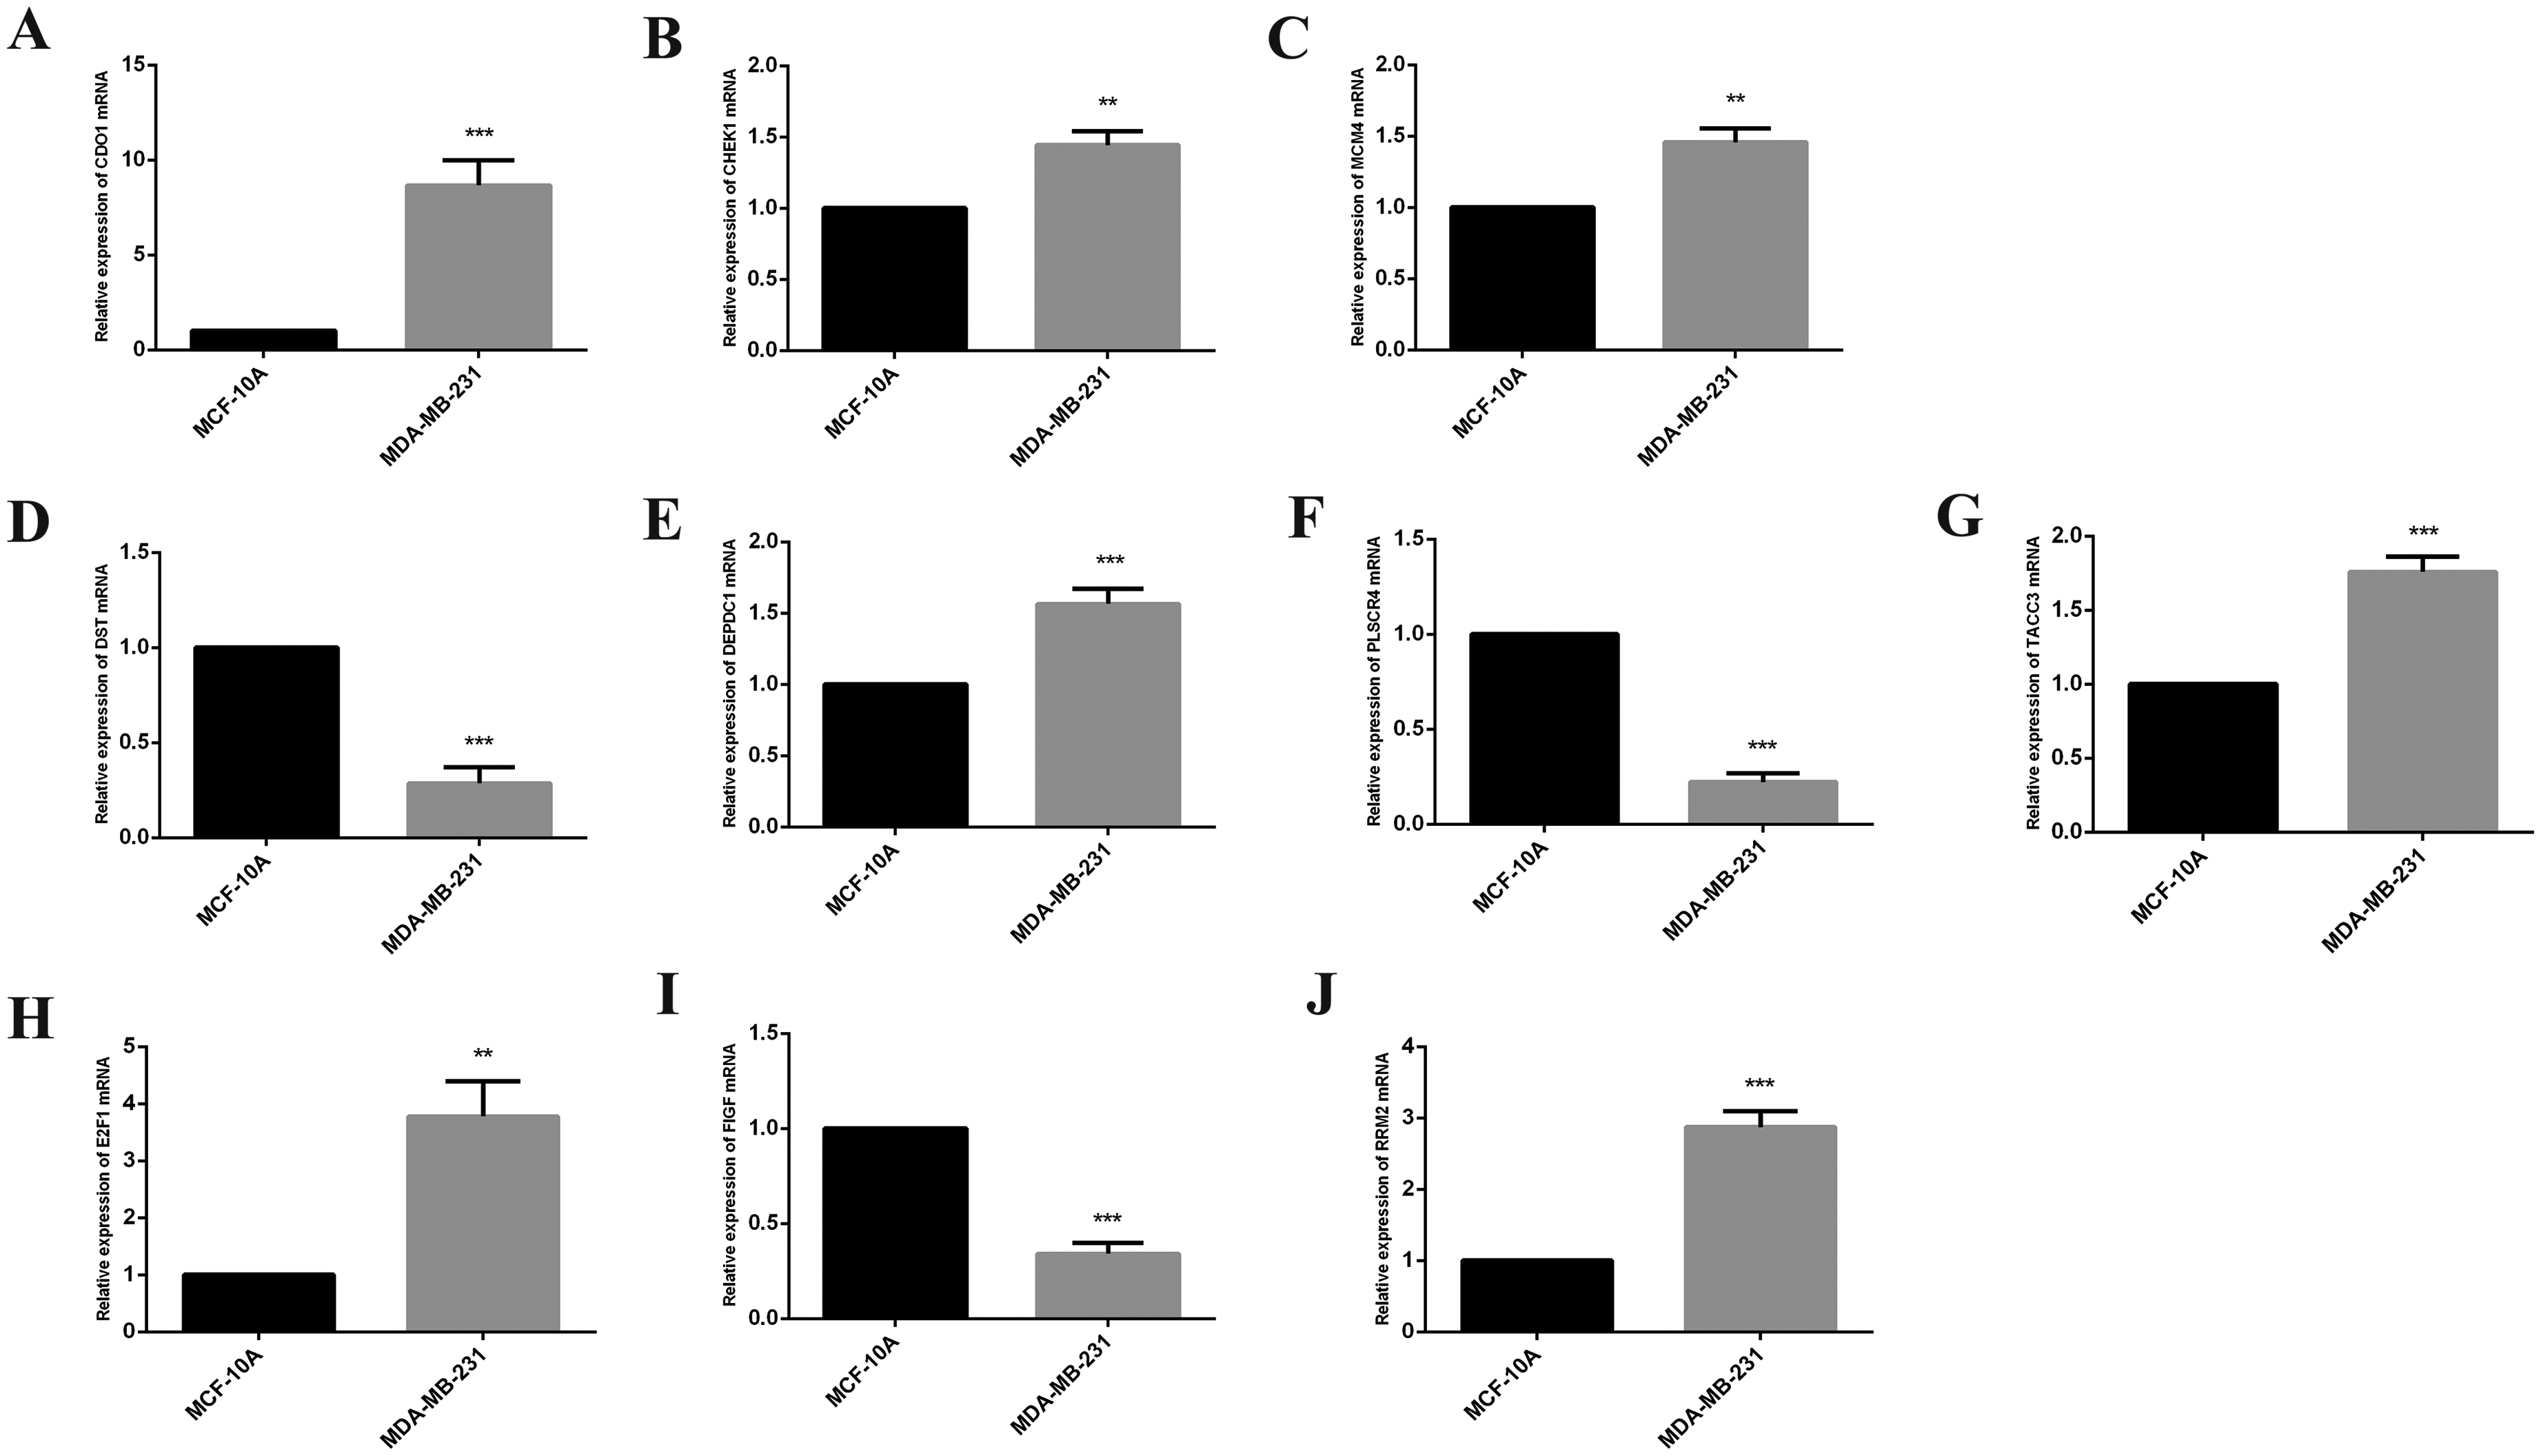
The expression level of RRM2, DEPDC1, FIGF, TACC3, E2F1, CDO1, DST, MCM4, CHEK1, PLSCR4 was verified by MCF-10 and MDA-MB-231. Data were represented as the mean ± SD (n = 4). **p < 0.01, ***p < 0.001 vs. MCF-10A.
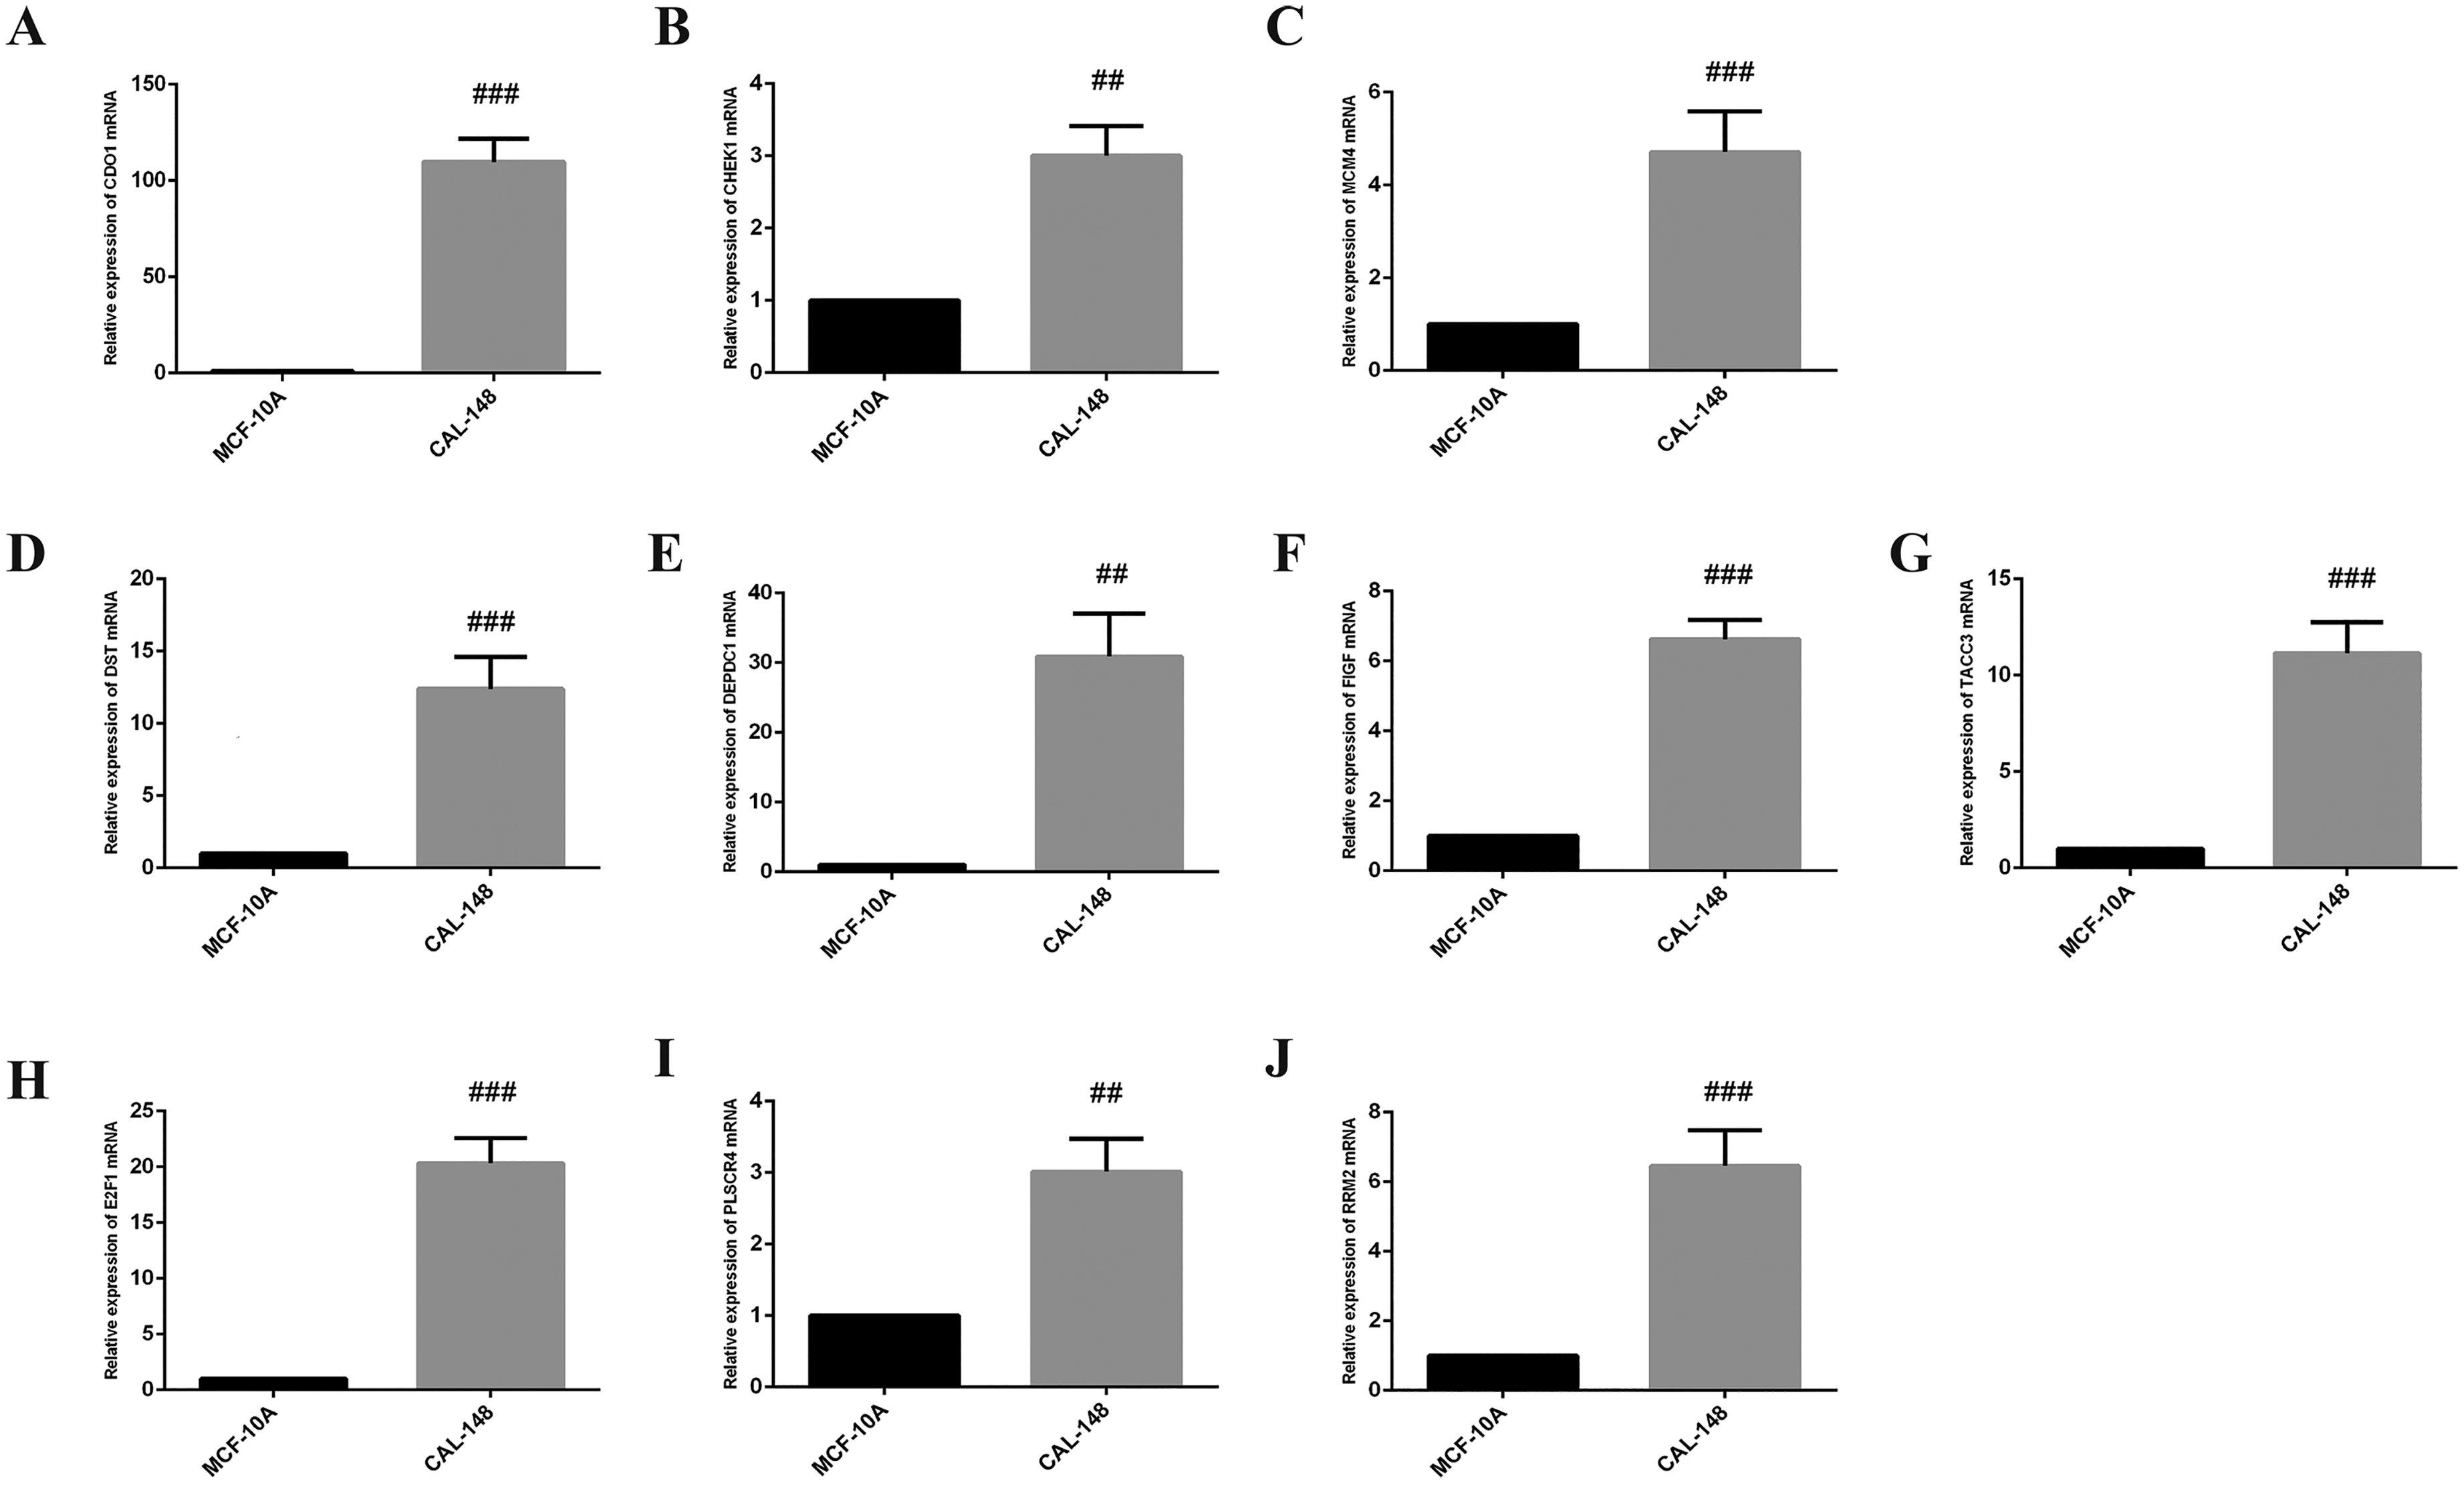
The expression level of RRM2, DEPDC1, FIGF, TACC3, E2F1, CDO1, DST, MCM4, CHEK1, PLSCR4 was verified by MCF-10 and CAL-148. Data were represented as the mean ± SD (n = 4). ##p < 0.01, ###p < 0.001 vs. MCF-10A.
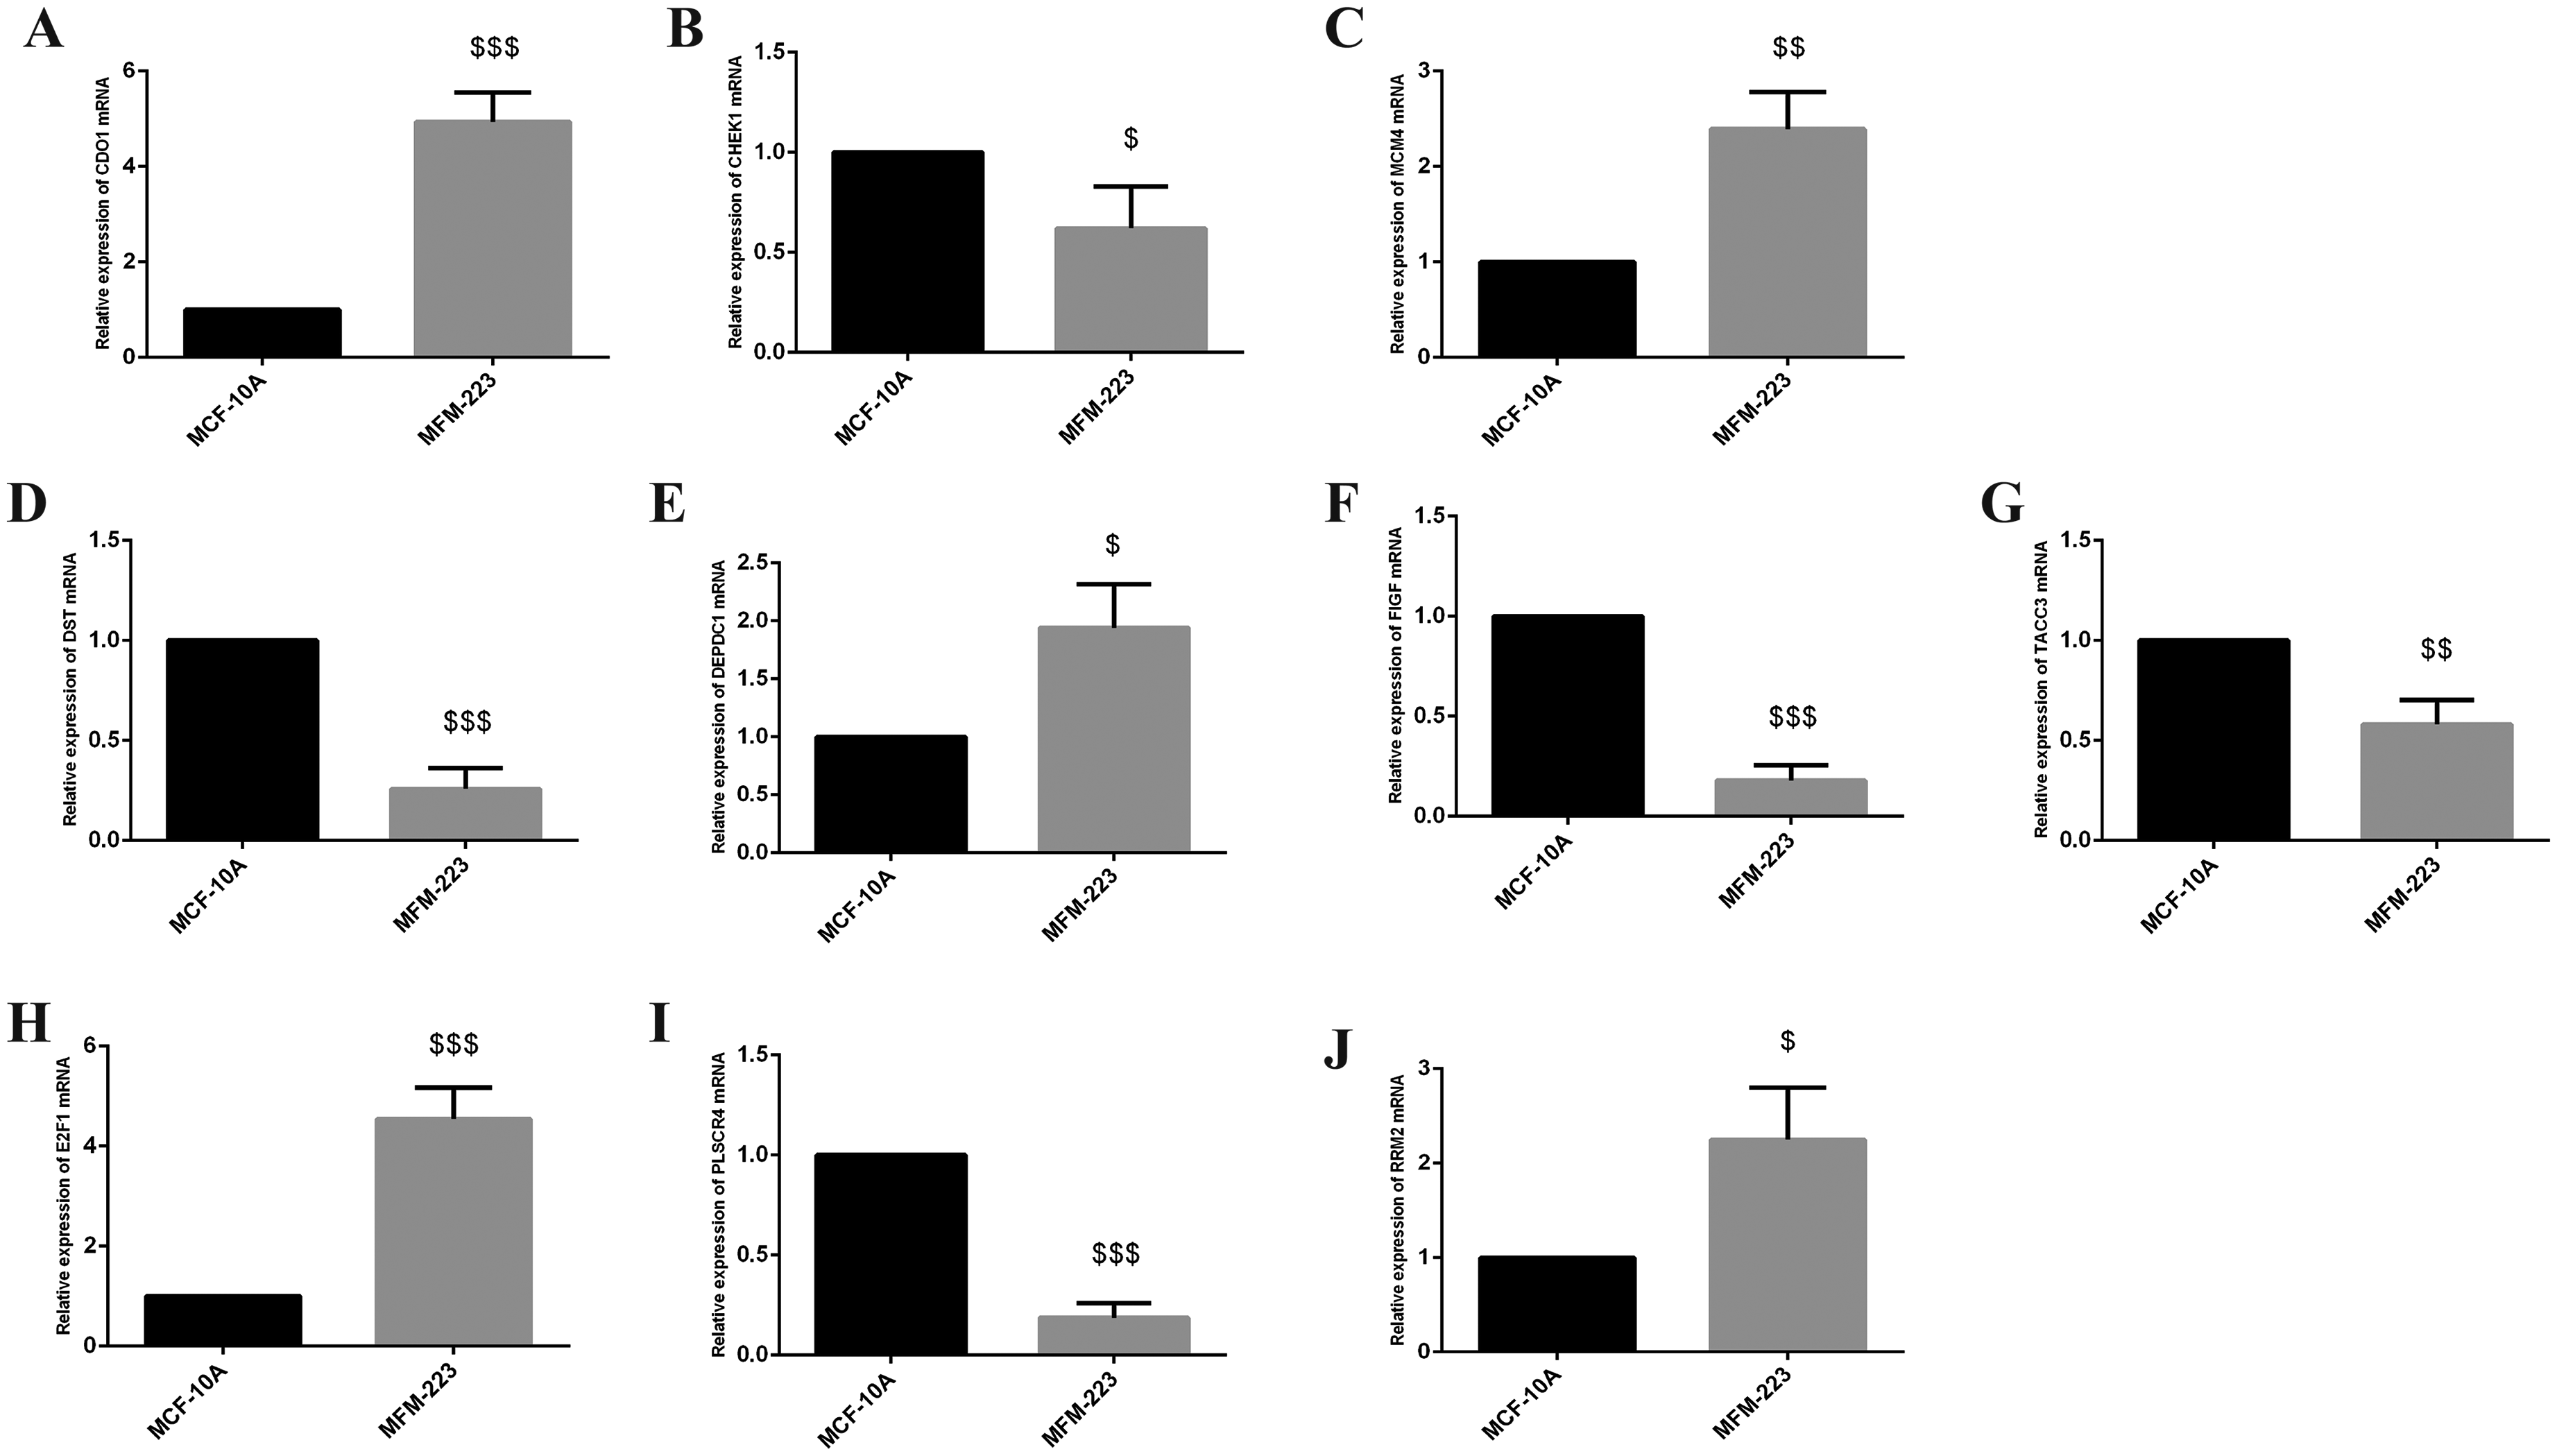
The expression level of RRM2, DEPDC1, FIGF, TACC3, E2F1, CDO1, DST, MCM4, CHEK1, PLSCR4 was verified by MCF-10 and MFM-223. Data were represented as the mean ± SD (n = 4). $p < 0.05, $$p < 0.01, $$$p < 0.001 vs. MCF-10A.
To evaluate the sensitivity of these 10 genes as specific markers for TNBC, Receiver Operating Characteristic (ROC) curves were generated for each gene individually. The AUC represents accuracy, with a higher AUC indicating greater accuracy. The results reveal that all 10 genes demonstrate high accuracy, as illustrated in Figure 6-2.
Validation of prognostic value of specific genes
To validate the prognostic value of the 10 specific genes, OS and PFS analyses were conducted using the KM Plotter. As shown in Figure 7, the OS analysis revealed that CHEK1 (HR = 0.42 [0.22–0.82], FDR = 0.0085) and TACC3 (HR = 0.37 [0.18–0.75], FDR = 0.0043) exhibit significant differences in survival rates between high and low expression groups.
Similarly, the PFS analysis indicated that CDO1 (HR = 0.66 [0.46–0.96], FDR = 0.027), DST (HR = 0.64 [0.43–0.95], FDR = 0.024), FIGF (HR = 1.52 [1.04–2.21], FDR = 0.028), PLSCR4 (HR = 0.68 [0.48–0.98], FDR = 0.04), and RRM2 (HR = 0.66 [0.45–0.96], FDR = 0.029) display statistically significant differences in survival rates between high and low expression groups.
Relative expression of RRM2, DEPDC1, FIGF, TACC3, E2F1, CDO1, DST, MCM4, CHEK1, PLSCR4mRNA
To validate the changes in the key genes mentioned above in TNBC and normal breast endothelial cells, RT-qPCR was used for analysis, and the results were shown in Figure 8 below. Compared with MCF-10A, CDO1, CHEK1, MCM4, DEPDC1, TACC3, E2F1 and RRM2mRNA were significantly increased, while DST, FIGF and PLSCR4mRNA were significantly down-decreased in MDA-MB-231, all of them were significantly increased in CAL-148 compared with MCF-10A, and CDO1, MCM4, DEPDC1,E2F1 and RRM2 were significantly increased, CHEK1, TACC3, DST, FIGF and PLSCR4 were downregulate in MCM-223. MCM4, DEPDC1, E2F1 and RRM2 were consistent with the contents described in our previous bioinformatics. However, it's noteworthy that CDO1 exhibited substantial upregulation, which differs from our earlier bioinformatics results. This inconsistency could potentially be explained by temporal differences in gene expression, as gene regulation may vary over time and under different experimental conditions. The bioinformatics analysis we conducted was based on static datasets, whereas our validation experiments might reflect dynamic changes in gene expression that were not captured in the cross-sectional data. This discrepancy highlights the importance of incorporating time course analysis in future studies to better understand the temporal regulation of these genes and their role in TNBC. Further investigation through longitudinal or time-dependent experiments is warranted to elucidate the molecular mechanisms underlying these observed differences.
Discussion
TNBC represents a highly invasive subtype of breast cancer, often demonstrating resistance to chemotherapy. The current treatment landscape is further complicated by the lack of specific early screening and diagnostic methods. This study conducted a comprehensive bioinformatics assessment of endogenous biomarkers for TNBC and validated the findings.
We analyzed gene expression data from 16,208 genes using the GSE38959 and GSE53752 datasets obtained from the GEO database. A total of 243 genes showed significant differential expression, with 102 upregulated and 141 downregulated. WGCNA identified 119 genes highly correlated with TNBC, and intersecting these with the DEGs yielded 80 common genes. LASSO regression analysis was then applied to these 80 genes, resulting in the identification of 10 specific genes: RRM2, DEPDC1, FIGF, TACC3, E2F1, CDO1, DST, MCM4, CHEK1, and PLSCR4.
Further functional analysis revealed that E2F1, MCM4, and CHEK1 were primarily enriched in the cell cycle pathway. RRM2 and CHEK1 were associated with the p53 signaling pathway, while E2F1 and CHEK1 were enriched in the cellular senescence pathway. These findings enhance our understanding of TNBC and offer potential targets for diagnostic and therapeutic strategies.
The cell cycle is a tightly regulated process crucial for cell growth, division, and repair. In TNBC, aberrant regulation of the cell cycle is a key factor in tumor development. TNBC demonstrates imbalanced cell cycle regulation, including abnormal expression of cell cycle proteins and checkpoint failures. This dysregulation is closely associated with unrestricted proliferation and enhanced invasiveness of tumor cells. Cyclin-dependent kinases (CDKs) and cyclins are primary regulatory proteins of the cell cycle, and their abnormal expression in TNBC is strongly correlated with increased proliferation and invasiveness of tumor cells. 10
Among the three genes enriched in this pathway, E2F1 is a member of the E2F family and is involved in the regulation of the cell cycle. During the G1/S transition, E2F1 dissociates from the Rb protein complex, initiating the transcription of associated genes such as cyclin E and cyclin A, thereby promoting cell entry into the S phase. 11 E2F1 activation is regulated by cytokines and growth factors, which stimulate cell cycle entry through a feedback regulation mechanism. Conversely, the antiproliferative ability of E2F1 is regulated by pRb, 12 and studies have demonstrated that the Rb/E2F1 axis is abnormally activated in nearly all malignant tumors. Research suggests that E2F1, through its regulation of cell cycle-related genes, plays a significant role in the development and progression of TNBC. 13 Dysregulation of E2F1 may lead to cell cycle instability, driving unchecked proliferation of cancer cells. Its interaction with regulatory components such as the p53 pathway and Rb protein is critical in the pathogenesis of TNBC.14,15 RT-qPCR analysis showed that, compared to MCF-10A, E2F1 mRNA expression was significantly upregulated in the three TNBC cell lines, suggesting that E2F1 may be involved in the occurrence, development, and progression of TNBC by influencing the cell cycle. However, the underlying mechanism requires further investigation.
MCM4 is a member of the minichromosome maintenance protein family, playing an essential role in the cell cycle and DNA replication. MCM4 is overexpressed in various malignant tumors compared to normal tissues. In vitro studies suggest that MCM4 promotes cell proliferation and invasion while inhibiting apoptosis. 16 During breast cancer progression, MCM4 expression surpasses that of Ki-67, and low MCM4 expression correlates with a higher probability of recurrence-free survival in breast cancer. 17 Consistent with our findings, significant upregulation of MCM4 was observed in the three TNBC cell lines. As there is limited literature on MCM4's role in TNBC, this represents a novel discovery, highlighting its potential as a promising therapeutic target.
CHEK1 is a cell cycle checkpoint kinase crucial for detecting DNA damage and regulating the cell cycle. CHEK1 protects genome integrity during normal DNA replication by inhibiting CDK activity, thus preventing premature DNA replication. 18 It regulates the G1/S checkpoint, preventing cells from entering the replication phase. 19 During the G2/M phase, CHEK1 inhibits the activity of CDC25 phosphatase, delaying cell entry into the M phase. 20 CHEK1 is also enriched in the p53 and apoptosis signaling pathways.
p53 is a crucial tumor suppressor gene involved in multiple essential biological processes, such as cell cycle regulation, DNA damage repair, and apoptosis. 21 Abnormalities in the p53 pathway are closely associated with tumor development and treatment resistance.22,23 Under normal conditions, p53 inhibits the expression of CDKs and cyclins, preventing cells from entering the S and M phases. The pathological progression of TNBC often involves gene mutations or functional loss of p53, leading to cell cycle instability and uncontrolled proliferation of cancer cells. 24 p53 is also a key regulator of apoptosis. In response to severe DNA damage or other cellular stressors, p53 induces apoptosis by regulating members of the Bcl-2 family and modulating mitochondrial membrane permeability. 25 In TNBC, the activity of CHEK1 may influence cell growth and apoptosis by directly or indirectly regulating p53 function. 26 Inhibiting CHEK1 can induce apoptosis and exert a significant anti-proliferative effect on TNBC cells. 27
RRM2 is a rate-limiting enzyme that regulates DNA synthesis and repair, playing a crucial role in many essential cellular processes. Suppressing RRM2 expression can enhance the sensitivity of cancer cells to ribonucleotide reductase inhibitors and cisplatin. 28 Overexpression of RRM2 is associated with a poorer prognosis in multiple cancers. 29 In TNBC, abnormal RRM2 expression is correlated with increased tumor proliferation and poor prognosis. Research suggests that RRM2 may facilitate tumor cells in escaping p53-mediated growth inhibition and apoptosis pathways by regulating the stability and activity of p53.
Cellular senescence plays a dual role in TNBC. On one hand, senescence may inhibit tumor progression by suppressing cancer cell proliferation. On the other hand, certain cancer cells can evade the effects of senescence and, in some cases, even exploit senescence-associated secretory products to promote the formation of the tumor microenvironment, thereby driving cancer progression. 30 There is relatively limited research on the specific mechanisms by which E2F1 and CHEK1 directly contribute to cellular senescence. Their primary roles are more commonly observed in cell cycle regulation and DNA damage repair. Under normal physiological conditions, E2F1 promotes the cell cycle by regulating genes involved in cell proliferation and survival. However, in response to excessive cellular or DNA damage, an exaggerated E2F1 response may trigger the onset of cellular senescence. 31 CHEK1, through its regulation of DNA damage and the cell cycle, participates in the cellular response to DNA damage. In some instances, CHEK1 activity may induce senescence when DNA damage is irreparable, preventing the proliferation of damaged cells.32,33
In summary, specific genes such as RRM2, E2F1, MCM4, and CHEK1 play crucial roles in cell cycle regulation, and their association with TNBC is primarily evident through their abnormal expression, which may lead to cell cycle instability and, consequently, uncontrolled proliferation of cancer cells. These genes contribute to the development of breast cancer through various molecular mechanisms, providing potential targets and strategies for future therapeutic interventions.
This study has several limitations that need to be addressed in future work. One major limitation is the issue of batch effects, which could distort biological differences and potentially impact gene correlations, particularly in analyses such as WGCNA. This could limit the generalizability of our findings to all TNBC patients. To overcome this, we plan to integrate clinical samples and use more diverse datasets in future analyses to account for such batch effects and improve the robustness of our conclusions.
Additionally, while our bioinformatics analysis revealed significant downregulation of CDO1 in the microarray datasets GSE38959 and GSE53752, our validation experiments showed significant upregulation of this gene. This discrepancy may stem from several factors, including the relatively small sample size, potential metabolic differences between cell types and tissues, and the static nature of the datasets used in the bioinformatics analysis. To address these issues, we plan to conduct longitudinal studies and time course analyses using larger sample sizes to capture more dynamic changes in gene expression. Moreover, we will include clinical samples in future validations to ensure the translational relevance of our findings.
Moving forward, our research will focus on further elucidating the molecular mechanisms underlying the roles of these genes in TNBC, while actively addressing the limitations identified in this study through more comprehensive experimental designs and the inclusion of clinical and time-dependent data.
Conclusions
By integrating DEGs, WGCNA, and LASSO regression, we identified specific genes associated with the pathogenesis of TNBC. Our findings suggest that cell cycle regulation may play a pivotal role in TNBC progression. To validate the prognostic potential of these genes, we performed survival analysis, which revealed that CHEK1 and TACC3 are key genes influencing OS, while CDO1, DST, FIGF, PLSCR4, and RRM2 are significantly associated with PFS. These results were further corroborated by RT-qPCR validation, which confirmed consistent upregulation of CDO1, DEPDC1, MCM4, E2F1, and RRM2 in TNBC cell lines, aligning with previous screenings. However, the molecular mechanisms underlying the roles of these genes in TNBC pathogenesis warrant further experimental investigation. These discoveries offer novel insights into the molecular landscape of TNBC, potentially opening new avenues for targeted therapeutic strategies and biomarker development.
Footnotes
Acknowledgment
This study was supported by the Natural Science Foundation of Chongqing Municipality No cstc2021jcyi-msxmX1089. The authors report no conflicts of interest in this work.
Author contributions
CONCEPTION: Xing Chen, Xiaodan Tan were responsible for the design of the research protocol. INTERPRETATION OR ANALYSIS OF DATA: Xiaoli Wang and Zhe Peng were responsible for the data collation, analysis and mapping of the bioinformatics section. Wenjia Guo and Yang Yang were responsible for the data collation, analysis and mapping of the RT-qPCR experiment. PREPARATION OF THE MANUSCRIPT: Xing Chen and Xiaodan Tan were responsible for writing the manuscript. REVISION FOR IMPORTANT INTELLECTUAL CONTENT: Duanfang Zhou was responsible for the review of research proposals and data proofreading. SUPERVISION: Lin Chen was responsible for the review of manuscripts supervision. All authors have read and agreed to the published version of the manuscript.
Funding
The authors received no financial support for the research, authorship, and/or publication of this article.
Declaration of conflicting interests
The authors declared no potential conflicts of interest with respect to the research, authorship, and/or publication of this article.