
Abstract
Background
Nasopharyngeal carcinoma (NPC) is a neoplasm that arises from the mucosal lining of the nasopharynx. Recent investigations have underscored that reprogramming of lipid metabolism is a salient metabolic alteration in neoplastic cells. Consequently, identifying lipid metabolism-associated biomarkers in NPC is of paramount importance.
Methods
Utilizing transcriptomic datasets, differentially expressed genes (DEGs) were identified from GSE12452, contrasting NPC specimens with normal controls. The Weighted Gene Co-expression Network Analysis (WGCNA) was employed to discern key module genes pertinent to NPC. Lipid metabolism-related differentially expressed genes (LMR-DEGs) were ascertained by intersecting DEGs, key module genes linked to NPC, and lipid metabolism-related genes (LMRGs) using a Venn diagram approach. Subsequently, the MCODE algorithm was applied within the protein-protein interaction (PPI) framework to pinpoint lipid metabolism-centric biomarkers for NPC. The diagnostic potential of these biomarkers was assessed through ROC analysis. In the concluding phase, a ‘TF-mRNA-miRNA’ interaction network was delineated using Cytoscape.
Results
In our analysis, a total of 5026 DEGs were discerned when contrasting NPC specimens with normal controls. From this pool, 1835 genes were pinpointed as key module genes pertinent to NPC. Through a Venn diagram approach, 64 LMR-DEGs were isolated. Further analysis led to the identification of six lipid metabolism-centric biomarkers for NPC, namely GALC, SPTLC2, SMPD2, DEGS2, DEGS1, and SMPD3. Notably, these biomarkers demonstrated robust diagnostic efficacy. We found that DEGS1 was negatively correlated with SMPD2 and DEGS2. A comparative expression analysis revealed diminished expression levels of GALC, SPTLC2, SMPD2, DEGS2, and SMPD3 in the NPC cohort relative to the control group. In the terminal phase of our study, the ‘TF-mRNA-miRNA’ regulatory network was delineated, comprising 309 nodes and 360 interaction pairs.
Conclusion
In summary, our investigation identified six lipid metabolism-associated biomarkers (GALC, SPTLC2, SMPD2, DEGS2, DEGS1, and SMPD3) linked to NPC, providing a foundational framework for potential therapeutic interventions for NPC.
Introduction
Nasopharyngeal carcinoma (NPC) is a malignant neoplasm originating from the nasopharyngeal epithelium, exhibiting a peculiar geographical distribution with a high prevalence in southern China, Southeast Asia, and North Africa. 1 The disease is closely associated with environmental factors and Epstein-Barr virus (EBV) infection. 2
EBV is a gamma-herpesvirus that specifically infects humans. Latent infection by EBV introduces viral latent genes into host cells, some of which have been found to regulate pathways associated with glucose metabolism, thereby inducing metabolic changes that gradually transform healthy cells into tumor cells. Moreover, EBV infection mediates the activity of glycolytic enzymes by activating various transcription factors, such as HIF-1α and c-Myc, thereby regulating glucose metabolism. 3 Studies have shown that EBV nuclear antigen 2 (EBNA2) infection in human B lymphocytes (HBL) upregulates the expression of activating transcription factor 4 (ATF4). Furthermore, EBNA2 mediates changes in lipid metabolism through the activation and regulation of ATF4, thereby promoting tumorigenesis. 4 EBNA2 mediates lipid metabolism and tumorigenesis through activation of ATF4 pathway.
The diagnosis of NPC is challenging due to its deep anatomical location and non-specific early symptoms, often leading to a delayed diagnosis at advanced stages. 5 Current detection methods such as nasoendoscopy and imaging techniques possess limitations in identifying early-stage NPC or subclinical lesions. 1 This predicament underscores the exigent necessity of exploring novel biomarkers for early detection, and further understanding the etiological mechanisms and advancing therapeutic strategies for NPC. 6
Lipids, as one of the most crucial nutrients in the human body, physiologically serve as energy providers and storage substances. 7 Lipid metabolism is not only associated with cellular energy supply but is also intimately involved in maintaining cell membrane structure and mediating cell signal transduction processes. 8 Numerous studies have demonstrated that dysregulated lipid metabolism is closely linked to the occurrence and development of various diseases, including cancer, 9 heart disease, 10 diabetes, 11 and inflammation. 12 One of the hallmarks of tumor cell formation is the reprogramming of metabolic processes. 13
Cancer cells exhibit a markedly increased dependence on fatty acids (FAs), which is essential to meet the demands of rapid proliferation and signaling. The reallocation of carbon sources within cancer cells, particularly the shift from energy production to fatty acid synthesis, is a critical process that supports membrane construction and the biosynthesis of signaling molecules. As the interface between the cell and its external environment, the cell membrane is rich in fatty acids derived from acetyl-CoA, which are crucial for maintaining cellular structural integrity and function. Given the pivotal role of fatty acids in cancer cell proliferation, restricting their availability has emerged as a potential therapeutic strategy. 14 Research has revealed that long-chain fatty acids (LCFAs), as key lipid components, are tightly regulated during their uptake by the Solute Carrier Family 27 Member 6 (SLC27A6). Notably, in nasopharyngeal carcinoma (NPC), the promoter methylation rate of SLC27A6 is significantly higher than in non-cancerous tissues. This epigenetic modification may promote the upregulation of SLC27A6, thereby enhancing the ability of cancer cells to uptake LCFAs, ultimately accelerating cancer cell migration and invasion. 15
To further understand the complexity of NPC and improve therapeutic precision, Chen Xi and colleagues conducted advanced plasma lipidomics analysis and successfully identified six biomarkers closely associated with the survival outcomes of patients with locally advanced nasopharyngeal carcinoma (LAMPC). These lipid biomarkers are not only closely linked to immune and inflammatory processes but are also significantly enriched in metabolic pathways, highlighting their critical roles in NPC progression and prognosis evaluation. 16
As early as 1956, Warburg posited that even under aerobic conditions, tumor cells predominantly acquire energy through the glycolytic pathway. 17 Due to the low efficiency of glycolysis in tumor cells under aerobic conditions, aside from increasing glucose uptake and consumption, lipid metabolism serves as another significant source of energy. Compared to non-malignant cells, tumor cells exhibit significant metabolic abnormalities, with these aberrations primarily concentrated in carbohydrate metabolism. However, lipid metabolism, particularly the increase in de novo lipogenesis, has emerged as a novel hallmark of various aggressive cancers. 18
Lipid metabolism plays a crucial role in shaping the tumor microenvironment and influencing the heterogeneity of prognosis. 19 The study by S. Beloribi-Djefaflia et al. delves into the potential therapeutic value of targeting lipid metabolic pathways. They discovered that precisely targeting and intervening in key enzymes, receptors, or bioactive lipid molecules within lipid metabolism can effectively disrupt the lipid homeostasis of tumor cells. This disruption triggers apoptotic mechanisms, inhibits tumor cell proliferation, and blocks their ability to metastasize and spread. This finding provides a solid theoretical foundation and broad application prospects for developing novel anticancer therapies targeting lipid metabolism. 20
Materials and methods
Data materials
Gene expression profiles specific to NPC were sourced from the Gene Expression Omnibus (GEO) repository (https://www.ncbi.nlm.nih.gov/gds). The dataset GSE12452 encompassed 31 NPC samples juxtaposed with 10 normal tissue specimens, while GSE64634 comprised 12 NPC samples and 4 normal tissue counterparts. The dataset downloaded from UCSC Xena (https://xenabrowser.net/datapages/): the TCGA-HNSC dataset contains a total of 539 samples, with a case:control ratio of 495:44, and was used for analyses of differences between case and control samples. A total of 861 lipid metabolism-related genes (LMRGs) were extracted from the datasets of REACTOME METABOLISM OF LIPIDS, REACTOME PHOSPHOLIPID METABOLISM, KEGG GLYCEROLIPID METABOLISM, and KEGG GLYCEROPHOSPHOLIPID METABOLISM in the MSigDB and KEGG databases, as documented by Zhu et al. 21 To extract probe IDs and their corresponding gene symbols from the GPL570 platform information in the GEO database, the script specifically addresses the complexity of a single probe potentially mapping to multiple gene symbols, which are separated by “///”. Utilizing the filter and separate functions from the dplyr package, the script efficiently cleans the data, ensuring that only valid gene symbols are retained while invalid or duplicate records are removed. Subsequently, the cleaned gene symbols are precisely associated with their respective probe IDs, and this association information is integrated into the original expression data, resulting in a more accurate and enriched dataset. Based on this enriched dataset, we calculate the average expression level for each gene and sort the genes in descending order according to these averages, facilitating the rapid identification of highly expressed genes. Finally, through the application of the distinct function, we further eliminate duplicate gene symbol entries, retaining only the record with the highest average expression level for each unique gene. The design matrix was constructed after reading the collated expression data and sample grouping information, distinguishing between the control and experimental (NPC) groups. A linear model was fitted to the data using the lmFit function from the limma package. Subsequently, specific contrasts were defined and applied using makeContrasts and contrasts.fit to test for differential expression. The resulting statistics were smoothed by the eBayes function. Differentially expressed genes (DEGs) are determined based on adjusted p-values and fold change (logFC) with a significance threshold set at p < 0.05. In addition, biologically significant expression changes can be filtered based on a set logFC threshold. Finally, the script outputs all significantly differentially expressed genes and associated statistics to a file for further analysis and documentation of the DEG selection process.
Differential gene analysis
For the identification of differentially expressed genes (DEGs) between NPC (n = 31) and normal (n = 10) cohorts within the GSE12452 dataset, the ‘limma’ package (version 3.50.1) was employed. 22 A threshold of adjust. p.value < 0.05 was set as the criterion for significance. The visualization of DEGs was facilitated using a volcano plot, constructed with the ‘ggplot2’ package (version 3.3.5). 23 The 10 up-regulated genes and 10 down-regulated genes with the largest |log2FC| were selected to plot the heat map.
Weighted gene co-expression network analysis (WGCNA)
For the WGCNA, both control and NPC samples were designated as clinical traits, utilizing the ‘WGCNA’ package (version 1.70-3). Our initial step involved clustering all samples and excluding outliers to enhance the precision of the subsequent analysis. Following this, we generated a trait heat map and a sample dendrogram. The network topology analysis was carried out using the pickSoftThreshold function, which calculates the soft threshold power and the scale-free fitting exponent, setting the height to 0.85. The gene-to-gene similarity was computed based on adjacency, leading to the derivation of a phylogenetic tree among genes. Modules were then segmented using the dynamic tree cutting algorithm, setting the minModuleSize at 100. Employing the dynamic shear tree algorithm, genes were categorized into distinct modules. Conclusively, modules exhibiting a pronounced correlation with NPC were designated as key modules for further investigation.
Functional enrichment analysis
Lipid metabolism-related differentially expressed genes (LMR-DEGs) were identified by intersecting DEGs, LMRGs, and key module genes pertinent to NPC. Subsequently, Gene Ontology (GO) and Kyoto Encyclopedia of Genes and Genomes (KEGG) enrichment analyses for these LMR-DEGs were performed using the ‘clusterProfiler’ package (version 4.0.5). 24 A threshold of p.adjust < 0.05 was established as the significance criterion.
PPI network construction
The Protein-Protein Interaction (PPI) network, illustrating the interplay among LMR-DEGs, was constructed via the STRING database (https://string-db.org). Genes encompassed within the topmost module were designated as lipid metabolism-associated biomarkers, employing the MCODE plug-in with default parameters set as: Degree Cutoff = 2, Node Score Cutoff = 0.2, K-Core = 2, and Max.Depth = 100.
ROC and correlation assessment
To appraise the diagnostic efficacy of the lipid metabolism-associated biomarkers, an ROC curve was generated using the ‘pROC’ package for both GSE12452 and GSE64634 datasets. 25 An AUC value exceeding 0.7 was deemed indicative of commendable diagnostic potential. Concurrently, the expression profiles of these biomarkers were scrutinized across the two datasets. The interrelationship among the lipid metabolism-related biomarkers was assessed employing the pearson correlation method. Correlation coefficients were calculated, with correlation coefficients greater than 0 being a positive correlation and less than 0 being a negative correlation.
Regulatory network development
The occurrence and development of many diseases are closely related to the abnormal expression of specific miRNAs and mRNAs. By studying miRNA-mRNA interactions, key disease-related genes and regulatory pathways can be identified, providing new markers and targets for early diagnosis and treatment of diseases. The miRNAs linked to lipid metabolism-associated biomarkers were projected using the mirNet database. Simultaneously, transcription factors (TFs) pertinent to these biomarkers were anticipated via the JASPAR database. The integrated ‘TF-mRNA-miRNA’ regulatory network was subsequently delineated using Cytoscape (version 3.8.2) as documented by He et al. 26
Statistical evaluation
All analyses were carried out in R language (version 4.1.0). All statistical outcomes were derived using two-tailed tests, and a P-value of < 0.05 was deemed indicative of statistical relevance.
Cell apoptosis
The cell apoptosis was measured using an Annexin V-FITC/7-AAD (BD Biosciences Cat# 556547) staining kit. After treatment, cells were resuspended in binding buffer and stained with FITC-labeled Annexin V and PI, for 20 min at room temperature, in the dark. Cell apoptosis was detected using FACS Calibur (BD Biosciences, NJ, USA) and data were analyzed by using the FlowJo software v7.6.1 (FlowJo, LLC, NJ, USA).
Cell transfection
HONE1 cell line were maintained in Dulbecco's Modified Eagle Medium(DMEM) with 10% fetal bovine serum (Gibico, Sydney, Australia), supplemented with antibiotics at 33 °C, with 10% CO2. expression of DESG1, GALC, SPTLC2,SMPD2 were silenced by using two oligonucleotides of small interfering RNAs. The cultured HONE1 cells were washed and transfected with siRNAs using RNAi MAX (Thermo Fisher, Waltham, MA, USA) in Opti-MEM, as per the manufacturer's instructions.
qPCR
As in the reverse transcription kit manual (Takara Bio Inc., Dalian, China), RNA were synthesized to cDNA using the random hexamers and superscript II reverse transcriptase. Quantitative PCR was carried out by using a TB GREEN Kit (Takara Bio Inc., Dalian, China) with a two-step cycling program using a Bio-Rad CFX Connect Real Time PCR system. Primer sequences: GALC-F,GCCAAGCGTTACCATGATTTG, GALC-R,CCACCTTGAAGAGTTCGGCA; SMPD2-F, CTTACCCAGCACATCTACACTC, SMPD2-R, GAGCACCATGCCACTTAGAT; SPTLC2-F, GAGACGCCTGAAAGAGATGG, SPTLC2-R, TGGTATGAGCTGCTGACAGG; DEGS1-F, GGAAGACTTCGAGTGGGTCTAC, DEGS1-R, TTCATCAAGGACTTTATCTCTGGA; The relative gene expression was analyzed by calculating the respective GAPDH using the formula: 2−ΔΔCt.
Results
Isolation of LMR-DEGs from GSE12452 datasets
From the GSE12452 datasets, we discerned a total of 5026 DEGs, encompassing 2659 genes exhibiting down-regulation and 2367 manifesting up-regulation (Figure 1(A)). The foremost 10 down-regulated and 10 up-regulated DEGs are illustrated in Figure 1(B). In our pursuit to pinpoint critical modules associated with NPC, the WGCNA was executed. Sample clustering outcomes revealed an absence of outlier samples (Figure 1). The optimal soft-thresholding power was determined to be 12. As the mean connectivity approached zero, the scale-free topology fit index on the ordinate aligned, with the R^2 threshold value being set at 0.85 (indicated by the red line) (Figure 1(C)). The dynamic tree cut algorithm yielded 16 distinct modules (Figure 1(D)). Notably, the MEgreenyellow and MEbrown modules exhibited a pronounced correlation with NPC (Figure 1(E)). Consequently, 1835 pivotal module genes associated with NPC were earmarked for further exploration. Subsequent intersection of DEGs, key module genes pertinent to NPC, and LMRGs led to the identification of 64 LMR-DEGs (Figure 1(F)-(G)).
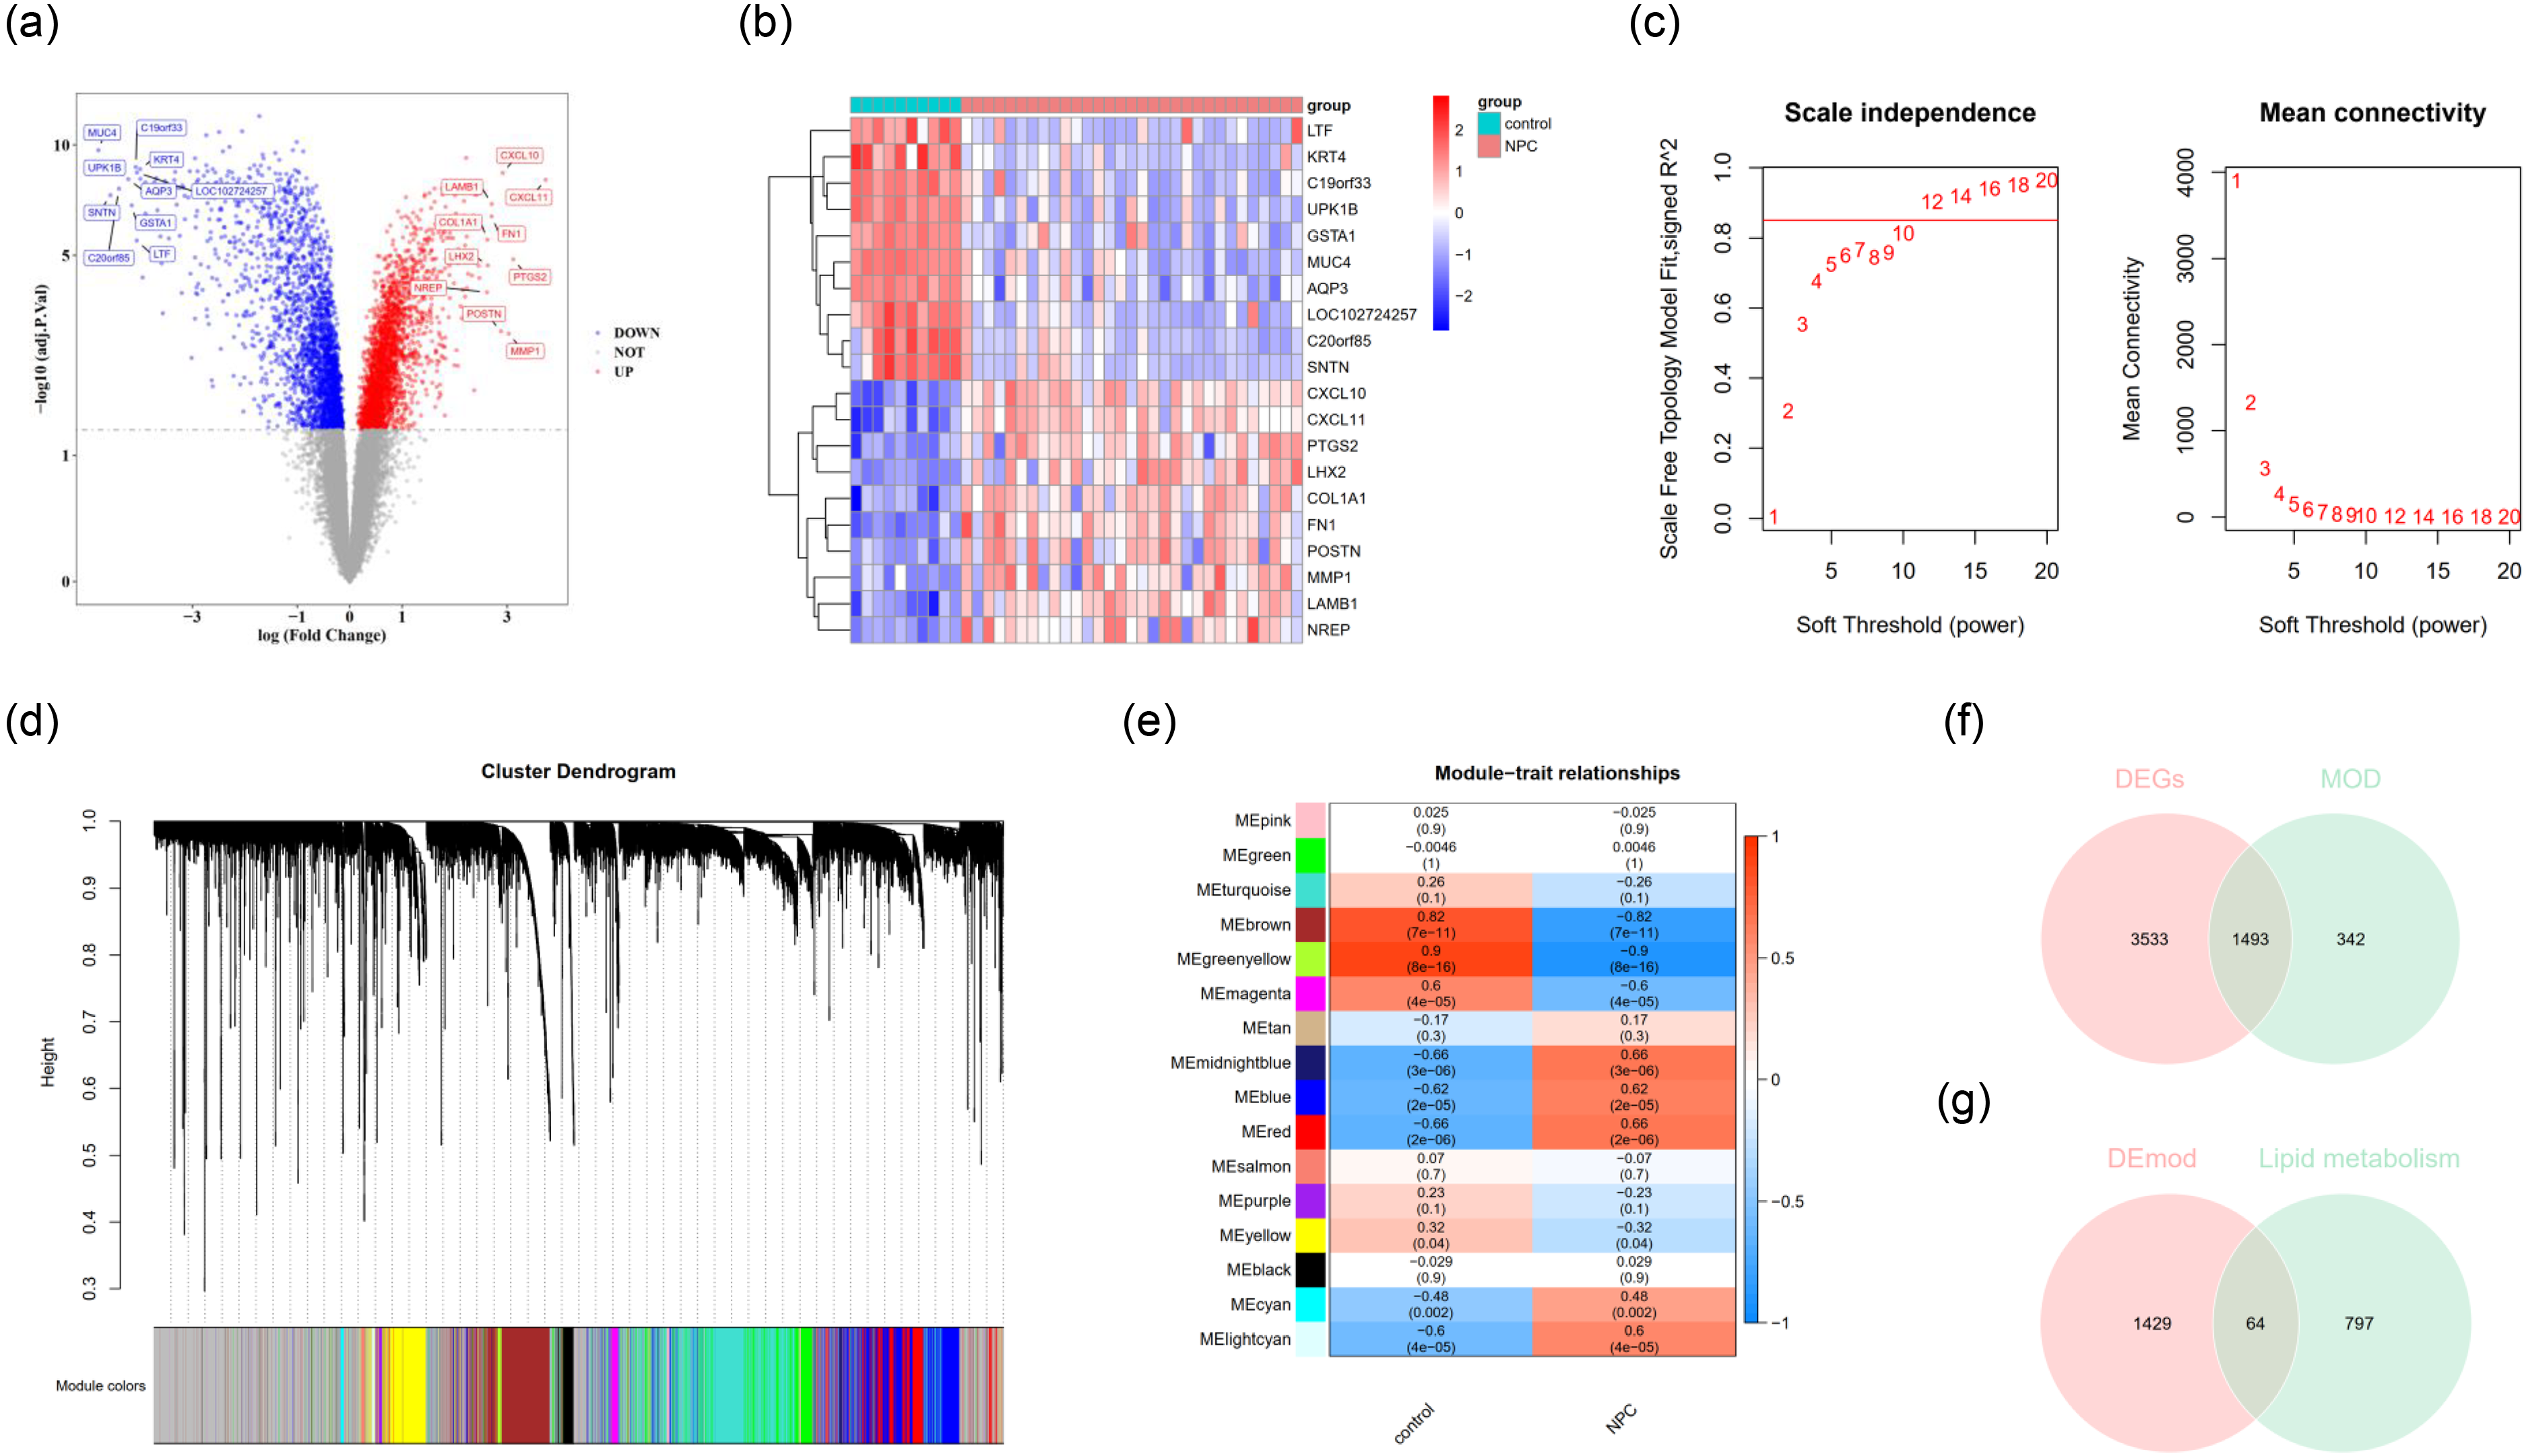
Identification and Analysis of DEGs and Key Modules Related to NPC in GSE12452 Datasets. (a) The volcano plot of identified DEGs in the GSE12452 dataset, Each dot represents a gene, with its horizontal coordinate showing the log(Fold Change) value, and the vertical coordinate displaying the -log10(adj.P.Val) value. Red indicates that the gene is significantly up-regulated in NPC, while blue signifies a significant down-regulation. (b) The expression heatmaps of the top 10 upregulated and downregulated differentially expressed genes (DEGs) across various samples. The horizontal axis represents the groups. Red indicates high expression and blue indicates low expression. (c) Soft threshold optimization in WGCNA; the red line symbolizes the cut-off value of 0.85, indicating the point where the mean connectivity approaches zero. (d) A hierarchical clustering tree exhibiting 16 distinct modules derived from the dynamic tree cut methodology. (e) Correlation heatmap emphasizing the significant relationship of MEgreenyellow and MEbrown modules with NPC. The horizontal axis represents the groups, the values in the heatmap indicate the correlation, and the values in parentheses denote the p-values, with red indicating a positive correlation and blue indicating a negative correlation. (f-g) The Venn diagram revealing the derivation of 64 LMR-DEGs, involving DEGs, NPC-associated key module genes, and LMRGs.
Functional enrichment assessment of LMR-DEGs
To elucidate the potential underlying mechanisms of LMR-DEGs, we embarked on a functional enrichment analysis. The predominant 5 GO terms across each category are depicted in Figure 2(A)–(B). Our analysis indicated that the aforementioned LMR-DEGs predominantly associate with processes such as ‘phospholipid metabolic process’, ‘fatty acid metabolic process’, and exhibit ‘phospholipase activity’. Concurrently, KEGG analysis intimated that these DEGs are predominantly concentrated in pathways like ‘PPAR signaling pathway’ and ‘Glycerolipid metabolism’ (Figure 2(C)–(D)). Notably, the enrichment in pathways like ‘PPAR signaling pathway’ and ‘Glycerolipid metabolism’ underscores the critical role of these genes in modulating lipid homeostasis and metabolism. PPARs (Peroxisome Proliferator-Activated Receptors) are known to regulate the expression of genes involved in fatty acid oxidation, lipid transport, and adipogenesis, while glycerolipid metabolism is a fundamental process in the synthesis and breakdown of lipids.
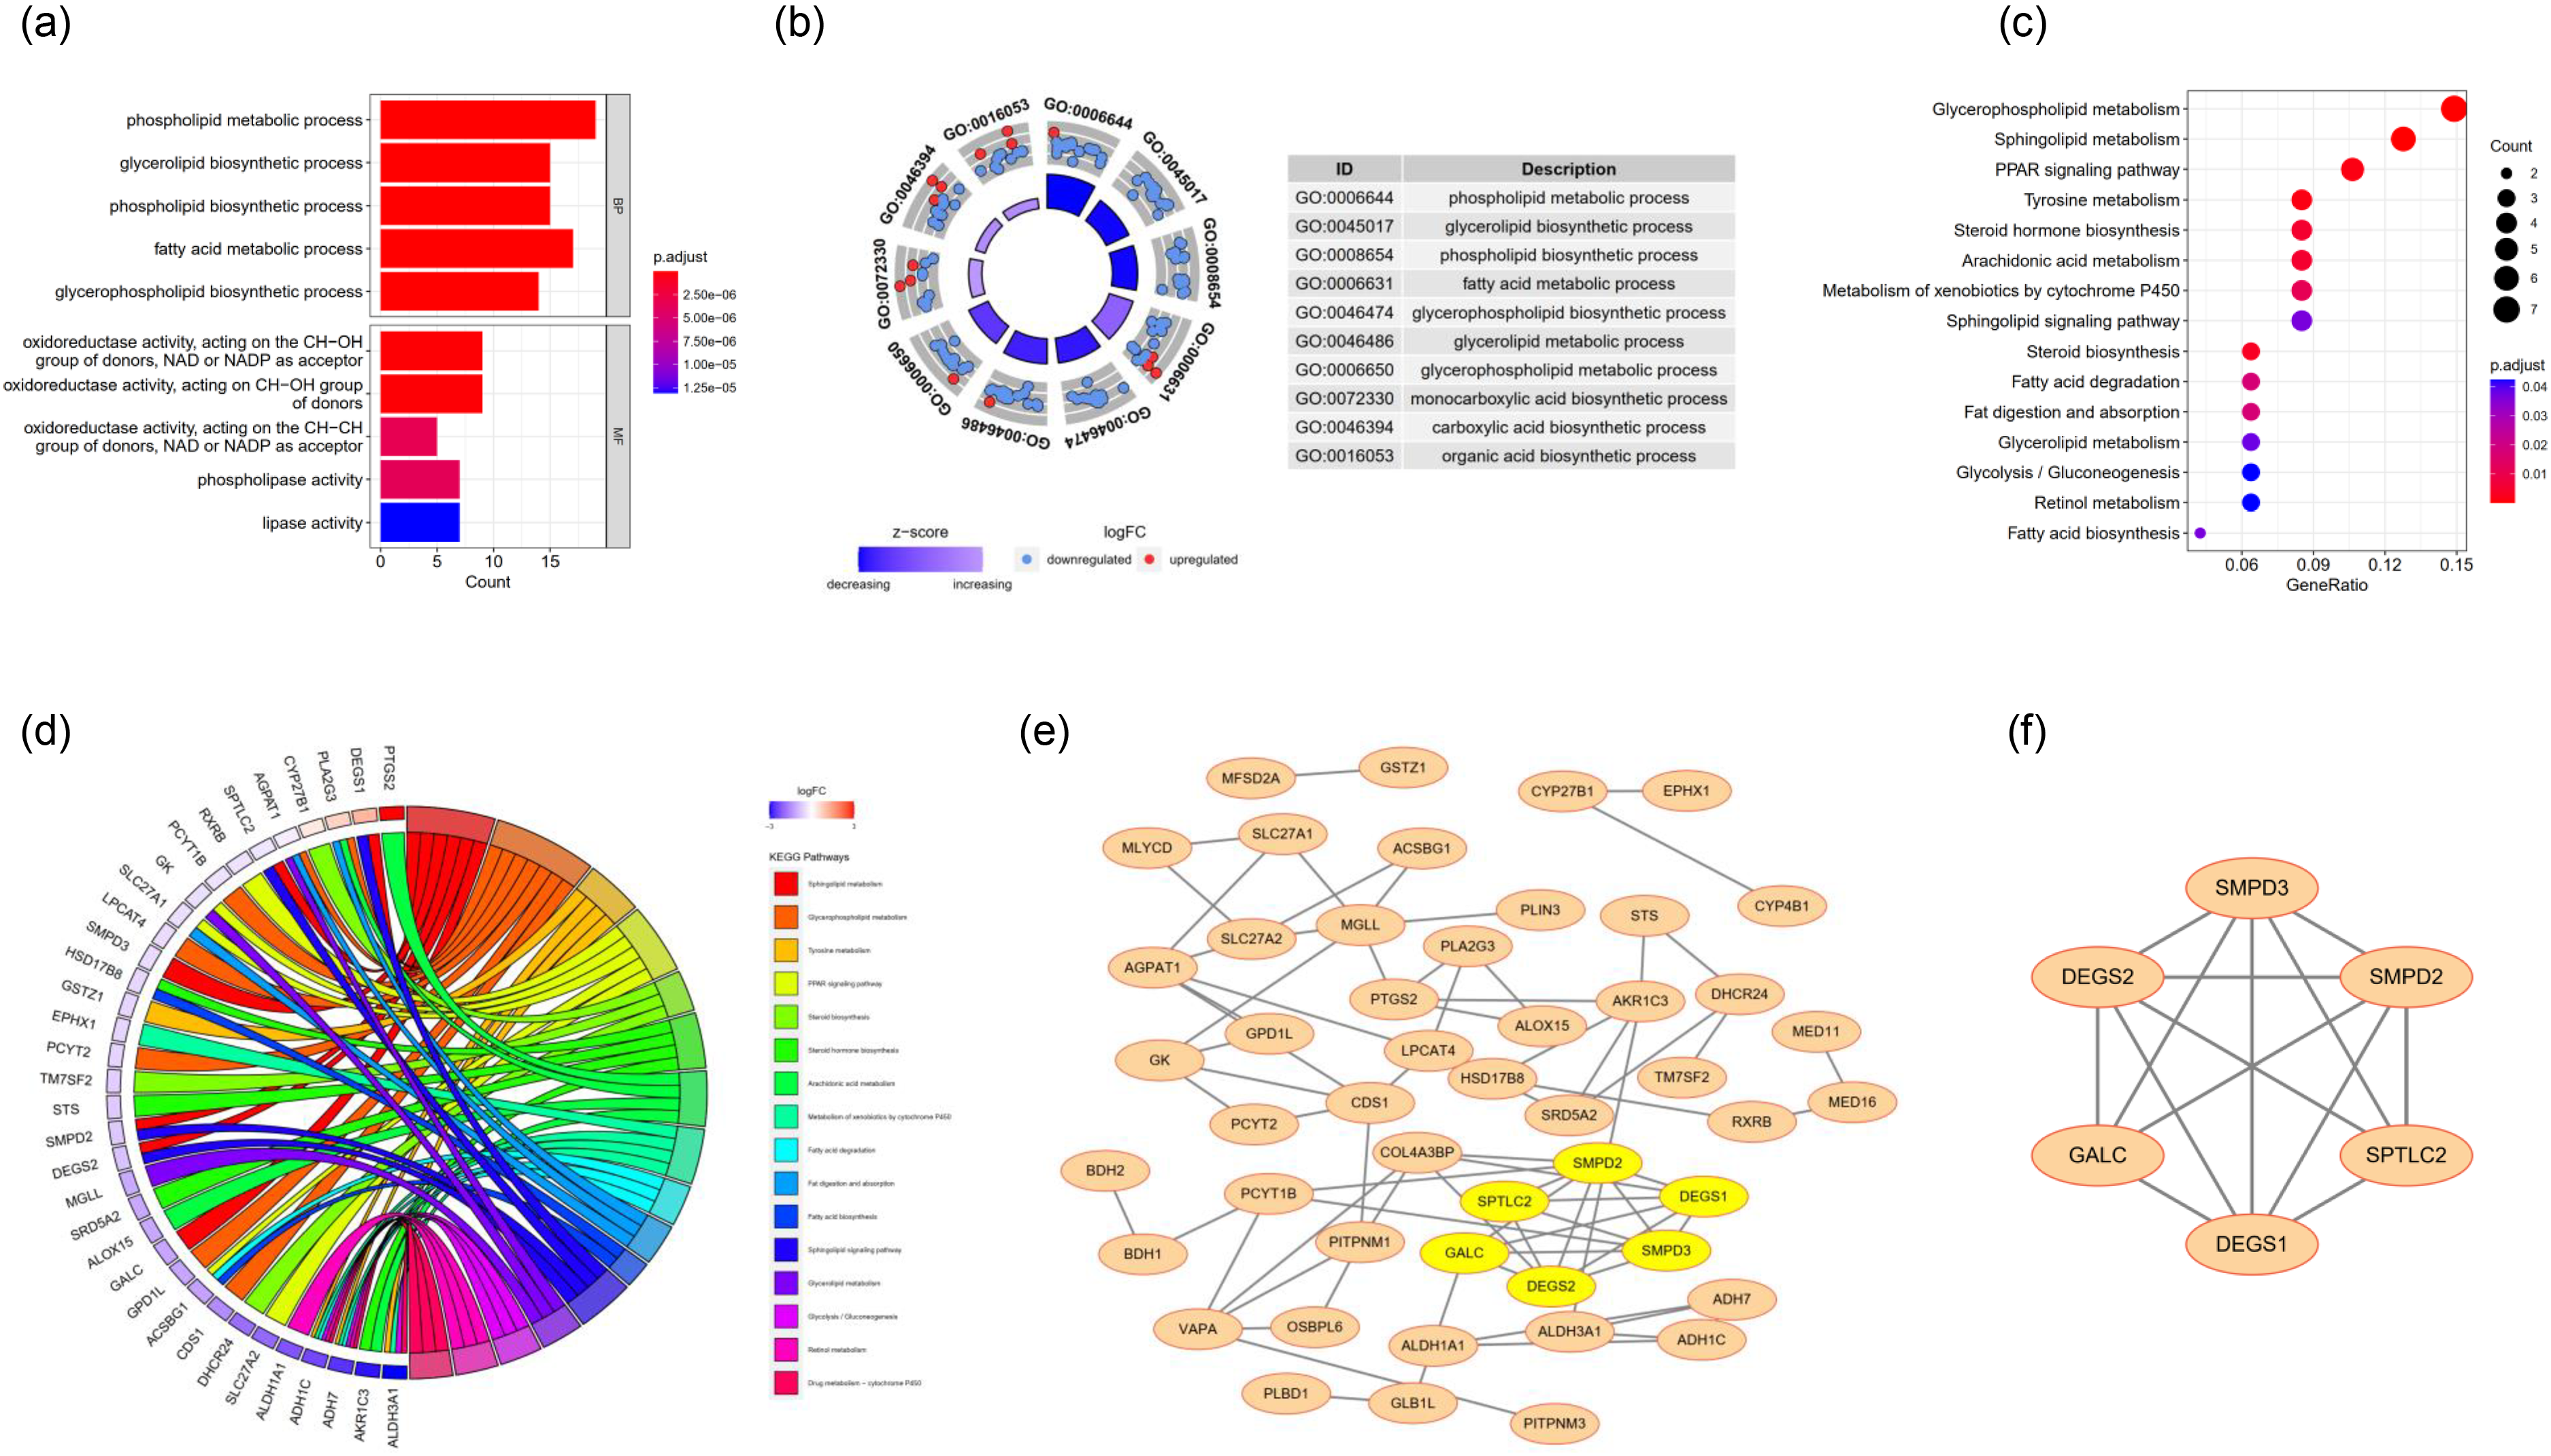
The functional analysis and interaction relationship of the LMR-DEGs. (a) The bar plot of the top 5 terms from the GO enrichment analysis. (b) The circle plot of the top 5 terms from the GO enrichment analysis. (c) The dot plot of the KEGG enrichment analysis. The horizontal axis represents the enrichment factor, the vertical axis represents the pathway names, the size of the dots indicates the number of enriched genes in the pathway, and the colour represents the range of p-values. (d) The circos plot of the KEGG enrichment analysis. (e) The PPI network of the LMR-DEGs. Yellow is the hub gene. (f) The sub-module of the PPI network in (e).
Identification of lipid metabolism-linked biomarkers
To delineate the regulatory interplay, a PPI network encompassing the LMR-DEGs was crafted, comprising 49 nodes and 74 interconnections (Figure 2(E)). Subsequent analysis spotlighted a pivotal gene cluster, encapsulating GALC, SPTLC2, SMPD2, DEGS2, DEGS1, and SMPD3 (Figure 2(F)). Consequently, these genes were designated as lipid metabolism-centric biomarkers for NPC. Furthermore, in the GSE12452 datasets, AUC values for these six biomarkers surpassed 0.7, underscoring their promising diagnostic potential for NPC (Figure 3(A)). Statistical tests and visual analyses revealed that four genes, SMPD2, SMPD3, DEGS1 and DEGS2, were differentially expressed between the nasopharyngeal carcinoma group and the normal group (p.adj < 0.05), and their expression trends were in line with those of the genes in the training set, suggesting that these genes may play an important role in the pathogenesis of nasopharyngeal carcinoma. In contrast, GALC and SPTLC2 did not show significant differences (Supplementary Figure 2). At the transcriptional echelon, diminished expression of GALC, SPTLC2, SMPD2, DEGS2, and SMPD3 was discerned in the NPC cohort relative to the control group (Figure 3(B)). To bolster these findings, we embarked on a validation exercise using an external dataset, GSE64634, which echoed the insights gleaned from GSE12452 (Figure 3(C)-(D)). Alterations in lipid metabolism genes may underlie the development or progression of nasopharyngeal carcinoma.
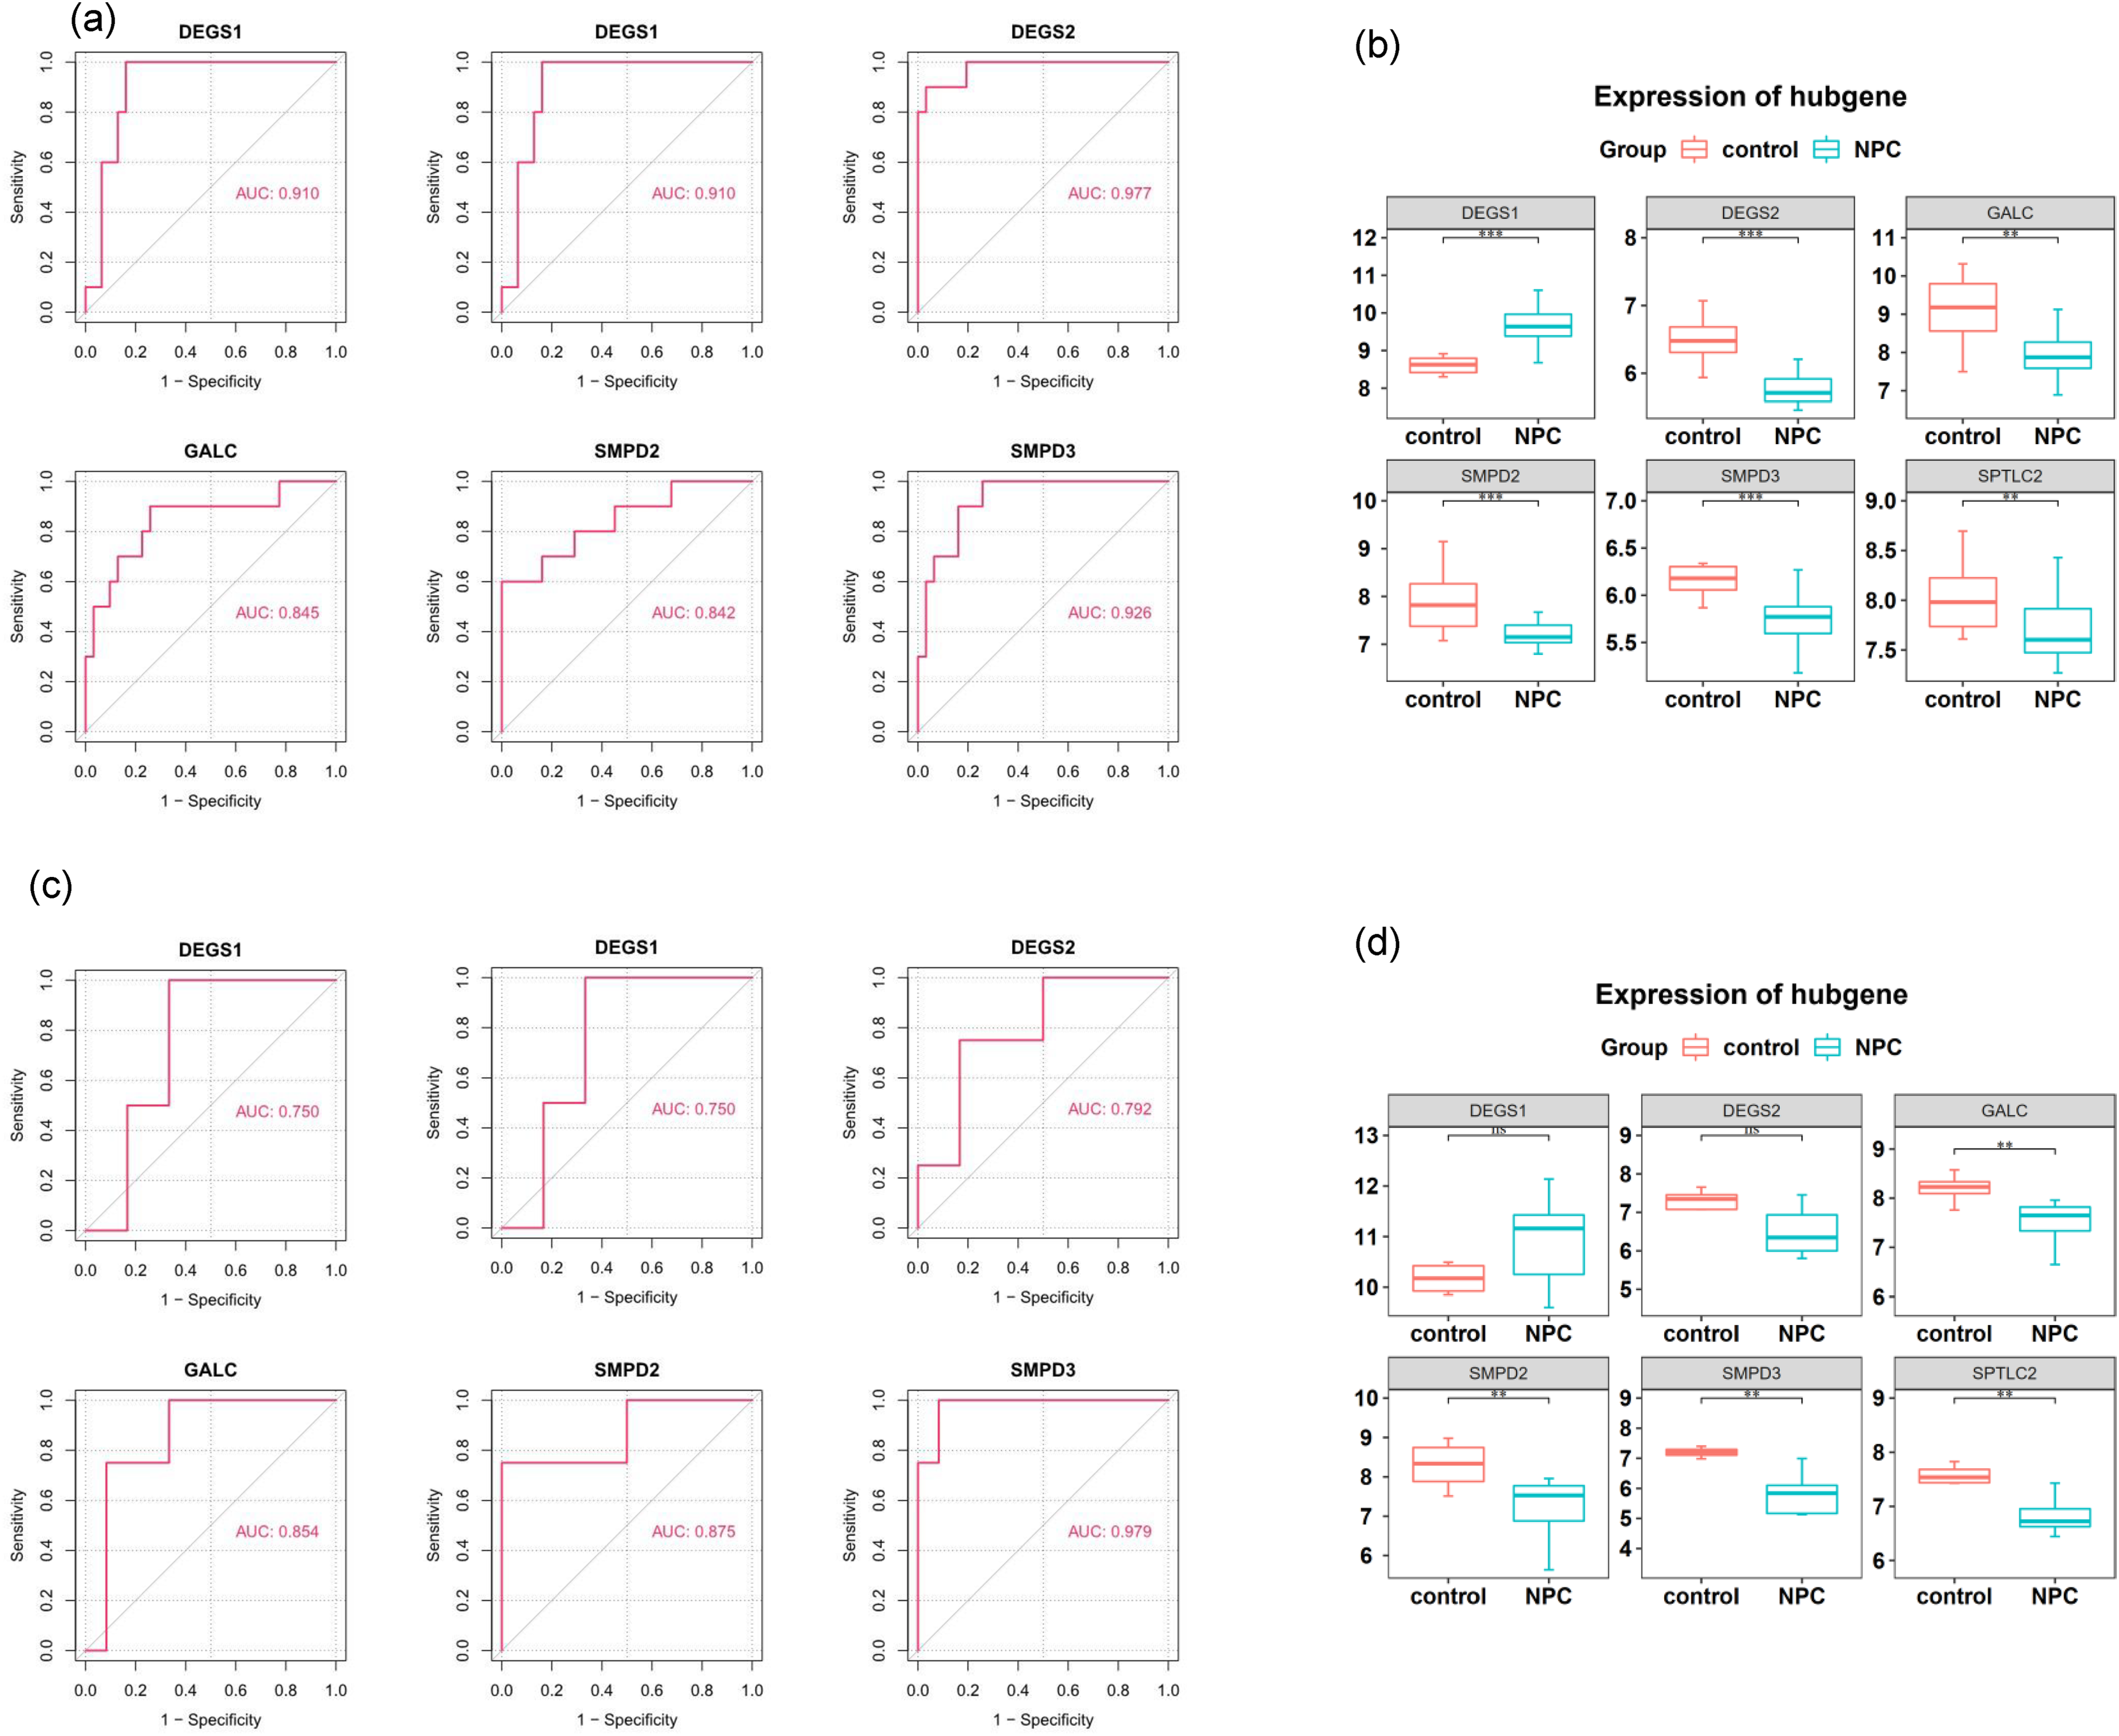
Performance of the identified 6 biomarker genes in NPC diagnosis. (a) The ROC of the 6 genes for NPC diagnosis in the GSE12452 dataset. The ROC curve indicates that the nomogram model has an excellent predictive value for UC (AUC>0.7). (b) Expression profiles of the 6 genes in the NPC group and control group in the GSE12452 dataset; (c) The ROC of the 6 genes for NPC diagnosis in the external dataset GSE64634; The ROC curve indicates that the nomogram model has an excellent predictive value for UC (AUC>0.7). (d) Expression profiles of the 6 genes in the NPC group and control group in the external dataset GSE64634.
Examination of regulatory dynamics of lipid metabolism-associated biomarkers
Correlation assessments unveiled that SMPD2 exhibited the most pronounced positive association with DEGS2 and SMPD3. This suggests that these genes may function in a cooperative or coordinated manner in lipid metabolic pathways associated with NPC. Conversely, DEGS1 manifested a negative correlation with SMPD2 and DEGS2 (Figure 4(A)). DEGS1 is an intracellular enzyme that plays a key role in the regulation of fatty acid metabolism and cell growth by modifying the structure and properties of fatty acids, affecting cell membrane fluidity and a variety of biological functions. This suggests that these genes may be reverse-regulated or have opposite roles in the disease process. Venturing to decipher the regulatory intricacies underpinning GALC, SPTLC2, SMPD2, DEGS2, DEGS1, and SMPD3, we orchestrated the ‘TF-mRNA-miRNA’ network (Figure 4(B)). This network, comprising 309 nodes and 360 interconnections, suggested that hsa-mir-142-5p might influence the expression patterns of DEGS1 and SPTLC2. Additionally, FOXC1 appeared to concurrently modulate DEGS2, SMPD2, GALC, and SPTLC2. This suggests that therapeutic interventions targeting these modulators may be effective in modulating NPC.
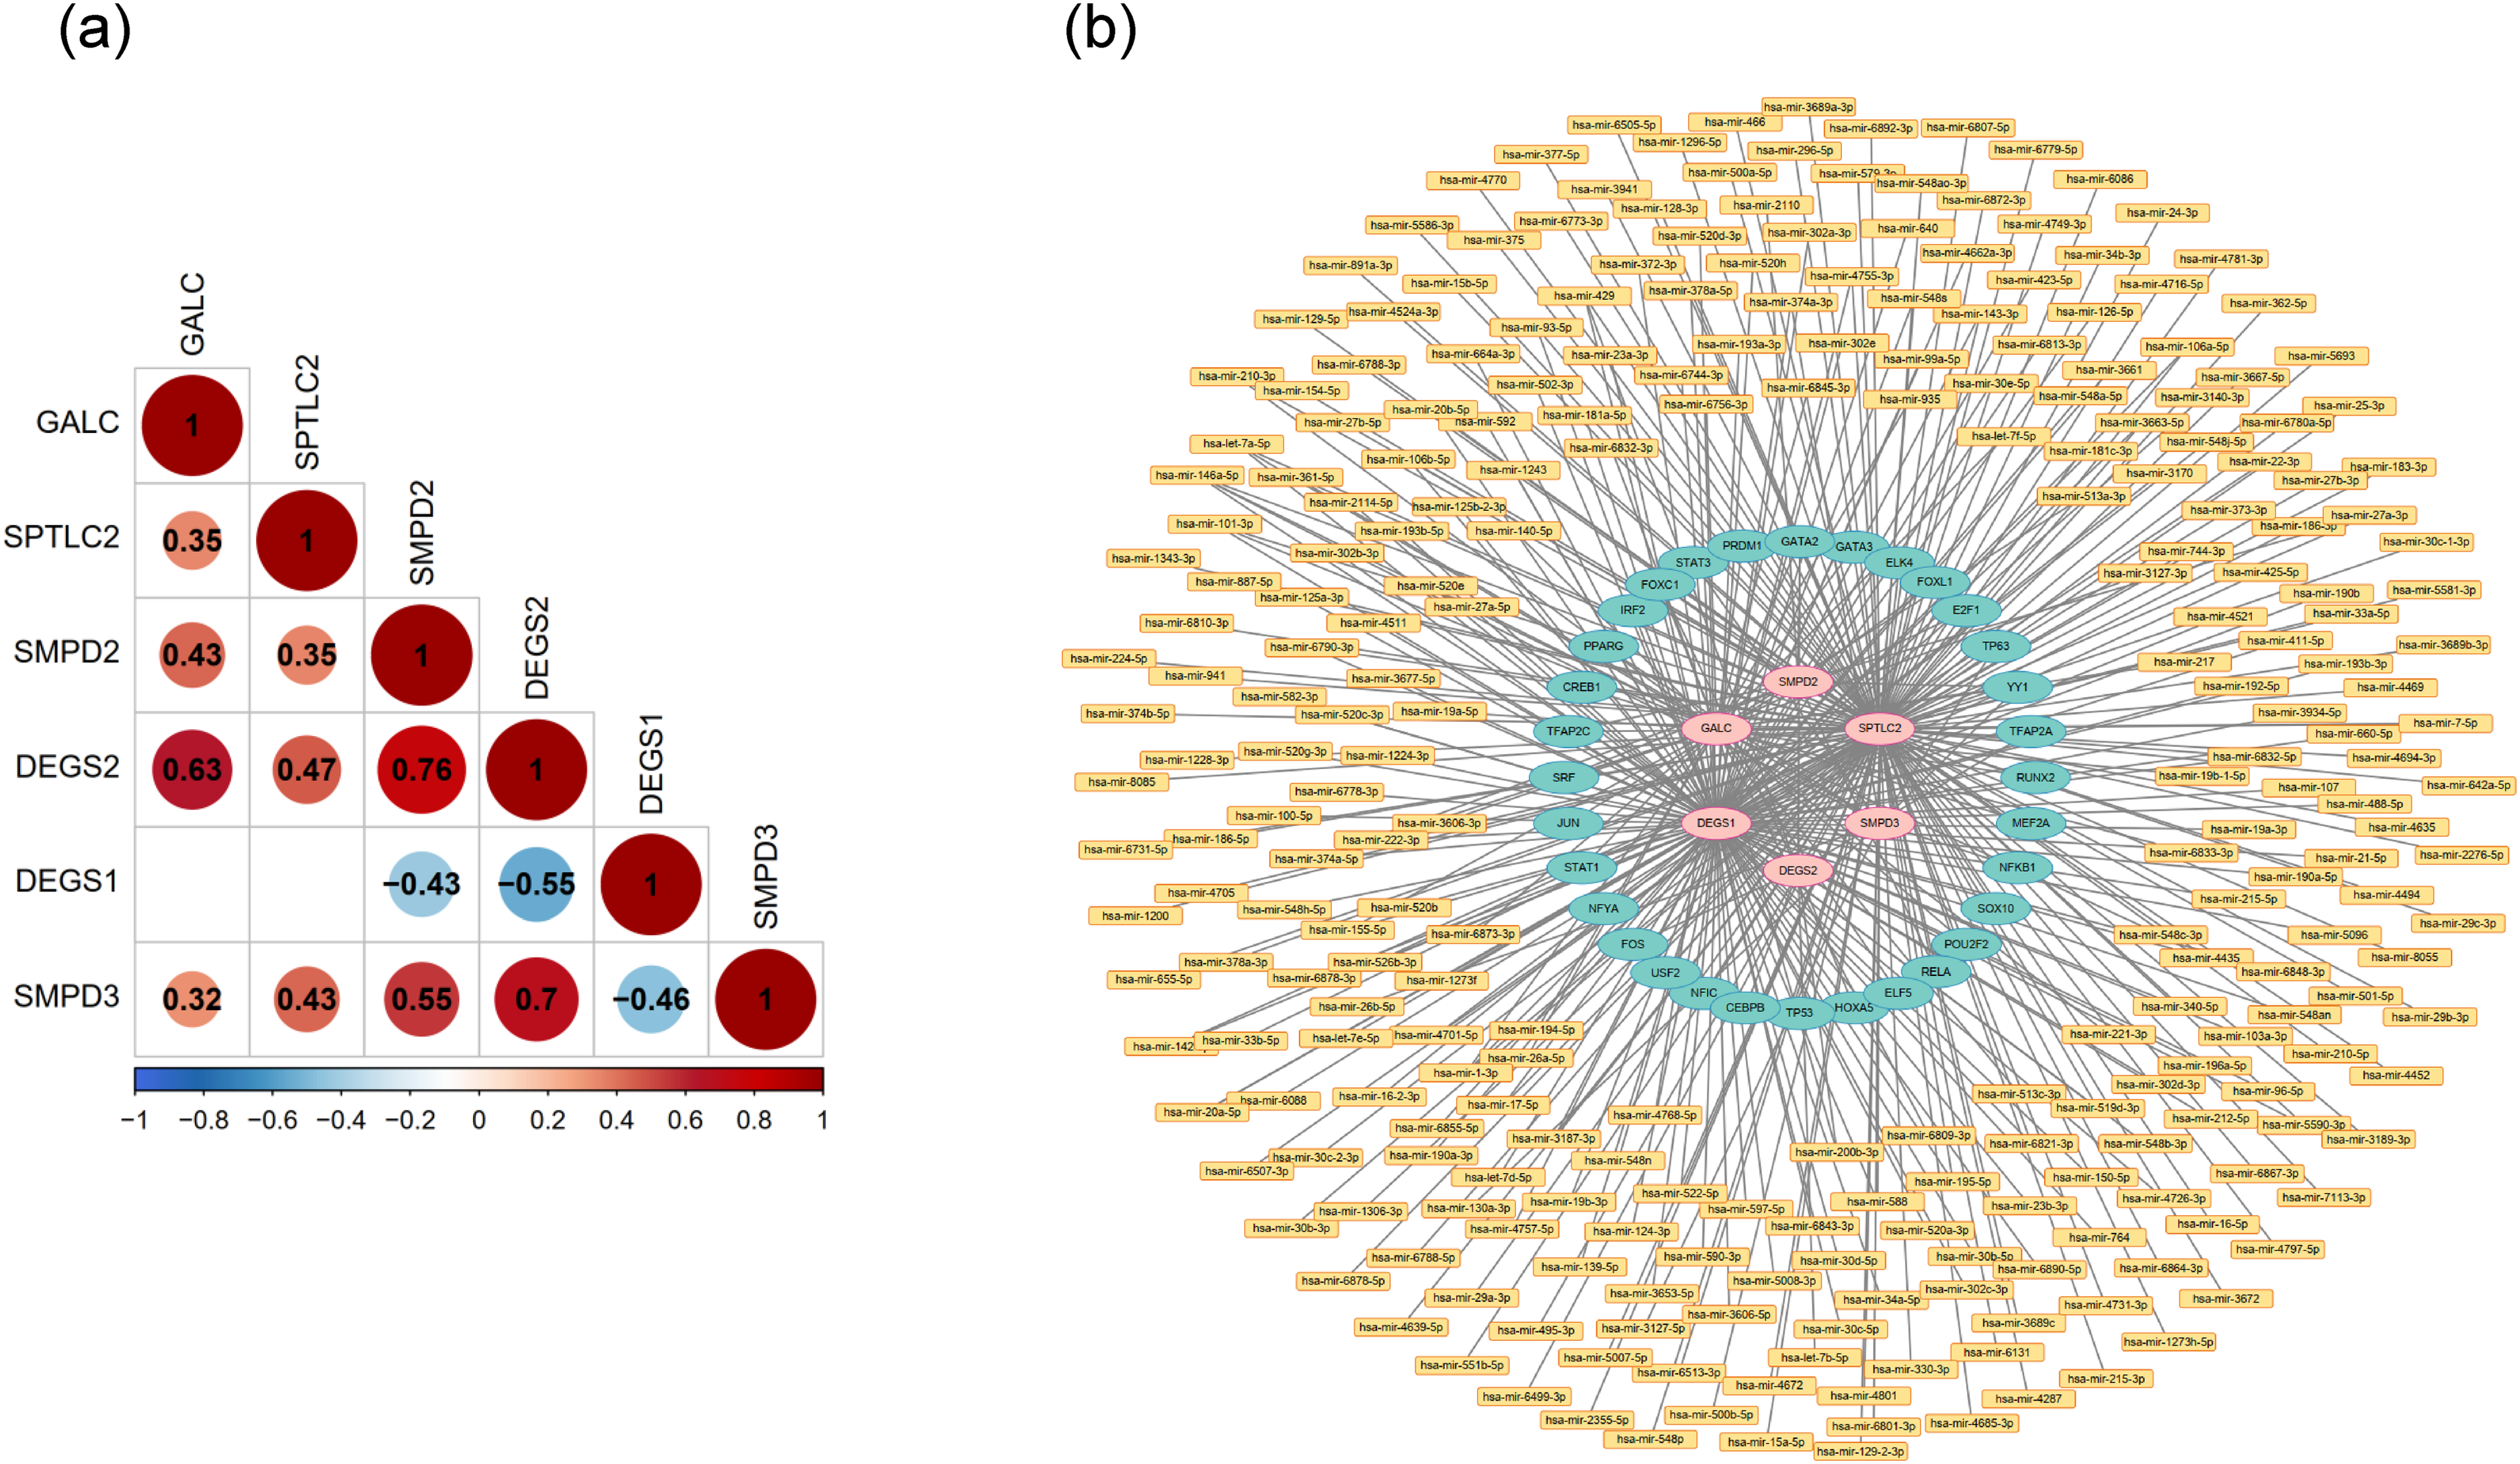
The regulatory relationship of lipid metabolism related biomarkers. (a) The correlation analysis of the genes. Red indicates a positive correlation, while blue indicates a negative correlation. The depth of colour and pie charts represent the magnitude of the correlation. (b) The ‘TF-mRNA-miRNA’ network of the genes. Pink labels are hub genes, yellow labels are miRNAs, green labels are TFs.
Assesement of NPC cell apoptosis after lipid metabolism-associated gene
In the nasopharyngeal carcinoma cell line HONE1, control siRNA and siRNAs targeting four different genes were transfected. After 48 h, apoptosis in the nasopharyngeal carcinoma cells was analyzed using flow cytometry (Figure 5). The results indicated that knocking down lipid metabolism-related genes significantly enhanced apoptosis in nasopharyngeal carcinoma cells.
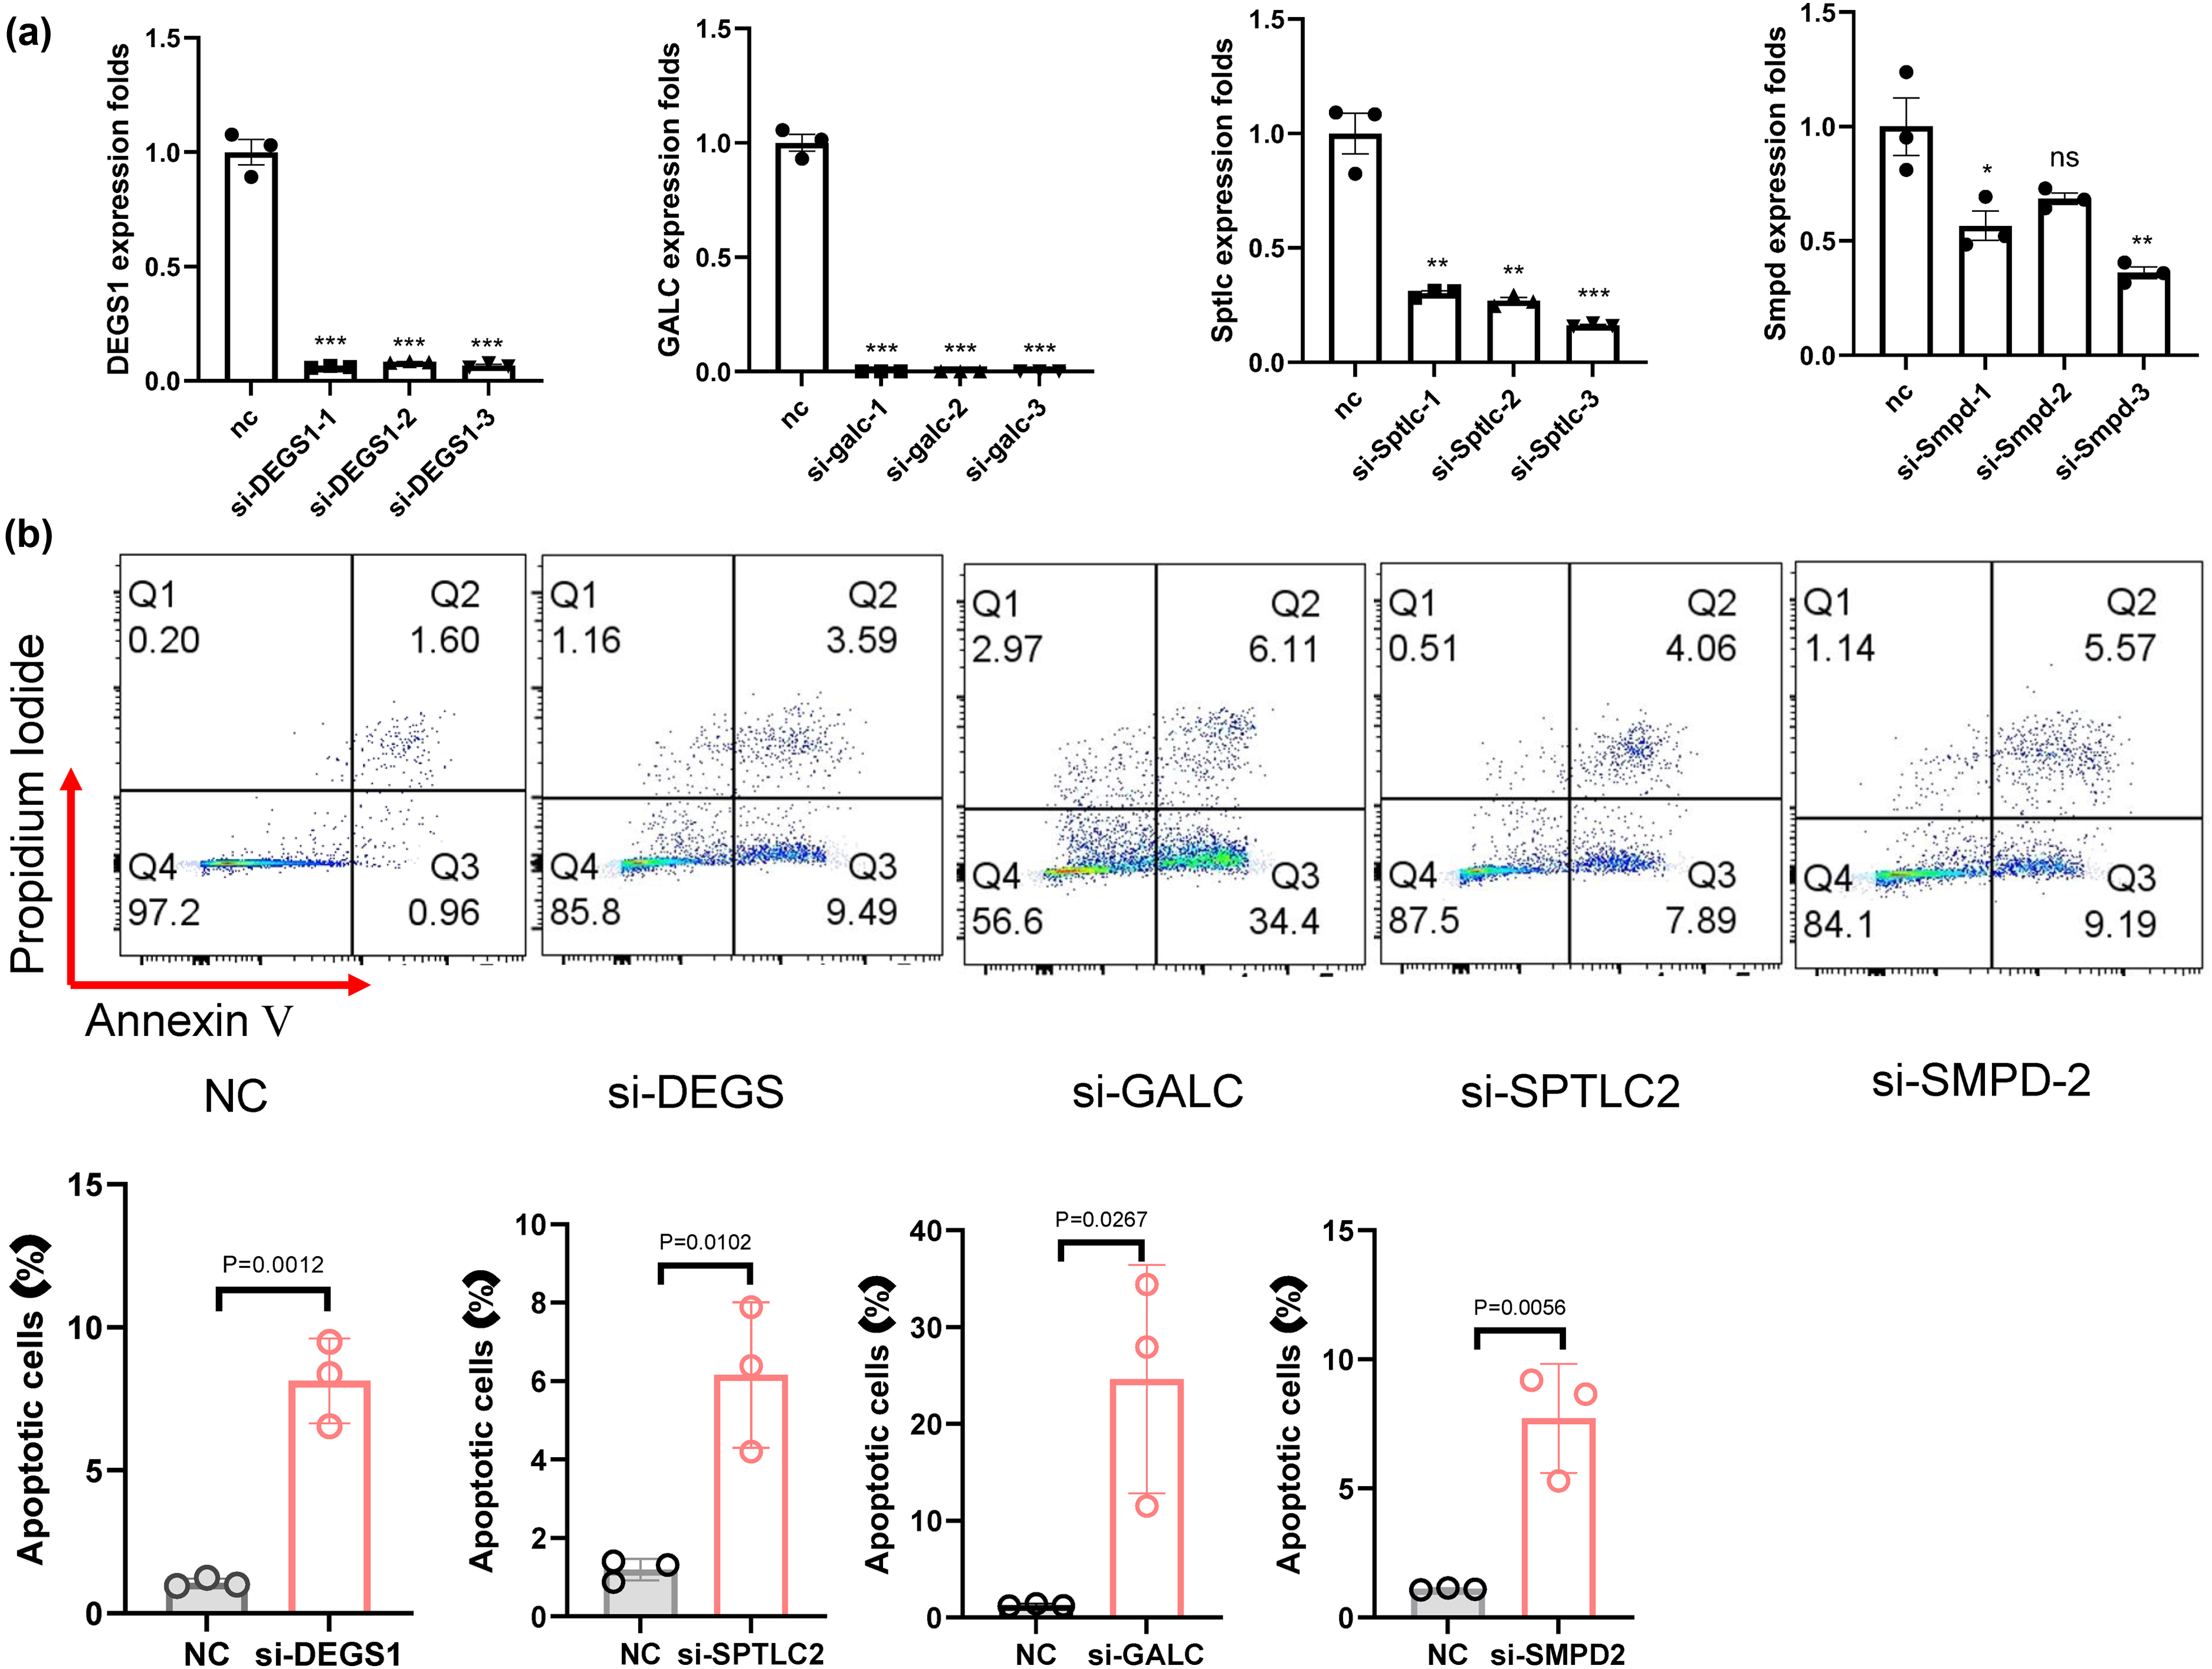
(a) Detection of gene knockdown levels in HONE cells after transfection with siRNAs targeting various genes. (b) Apoptosis of Hone1 cells transfected with siRNAs for 48 h and were determined by Flow cytometry. Data are represented as mean ± SEM. **P < 0.01, ***P < 0.001.
Discussion
Selecting appropriate datasets is a critical step in ensuring the reliability and validity of research results. The two datasets chosen for this study both utilize the same sequencing platform. This consistency minimizes the potential for non-biological discrepancies introduced by different technologies or instruments, thereby ensuring the accuracy and comparability of data analysis. Another important reason for selecting these datasets is that they include samples from different subtypes of nasopharyngeal carcinoma (NPC). Given that different NPC subtypes may exhibit significant differences in clinical presentation, pathological characteristics, and treatment responses, incorporating a diverse range of subtypes allows our study to more comprehensively reveal the heterogeneity of NPC and explore the specific roles of lipid metabolism across various subtypes. In the future, we plan to expand the scope of datasets to increase the diversity and representativeness of samples, and to validate the role of key lipid metabolism genes or pathways in NPC through cell-based assays, animal models, or clinical samples. The study identified 6 lipid metabolic related biomarkers (GALC, SPTLC2, SMPD2, DEGS2, DEGS1, and SMPD3) associated with NPC, exhibiting lower expression in the NPC group compared to the normal group. These biomarkers demonstrated good diagnostic value and laid a theoretical foundation for the treatment of NPC.
GALC, or galactosylceramidase, is a crucial enzyme that helps maintain the balance of lipid components both intracellularly and extracellularly through hydrolysis. Research has shown that the accumulation of neurotoxic substrates due to GALC deficiency is the primary pathogenic mechanism of Krabbe disease. 27 Furthermore, it has been discovered that hypermethylation of the GALC gene promoter significantly downregulates EBV expression levels. 28 This suggests that regulating the methylation status of the GALC gene could potentially restore its normal function, thereby inhibiting the proliferation and metastasis of nasopharyngeal carcinoma (NPC) cells.
SPTLC2 (Serine Palmitoyltransferase, Long Chain Base Subunit 2) disruption has been linked to the promotion of apoptosis, inflammation, and progressive liver fibrosis, with these effects worsening with age. Studies have found that the disruption of SPTLC2 significantly accelerates the progression of liver fibrosis by promoting apoptosis and inflammatory responses, with the severity of these effects increasing with age. 29 Sphingomyelin Phosphodiesterase 2 (SMPD2) is a neutral sphingomyelinase predominantly expressed in the nucleus and endoplasmic reticulum, responsible for hydrolyzing sphingomyelin to produce ceramide. Ceramide is a crucial lipid signaling molecule involved in a range of physiological processes, including apoptosis, aging, proliferation, autophagy, and angiogenesis. Research indicates that SMPD2 increases the levels of ceramide and other lipids. 30 The catalytic and regulatory mechanisms of SMPD2 are essential for maintaining cellular homeostasis and programmed cell death.
SMPD3, also known as sphingomyelin phosphodiesterase 3, encodes the inactive form of sphingomyelinase 2 (nSMase2). Studies have shown that the SMPD3 pathway plays a vital regulatory role in modulating immune cell survival and inflammatory responses. 31
DEGS1 (Delta 4-Desaturase, Sphingolipid 1) is an intracellular enzyme that modifies the structure and properties of fatty acids, thereby influencing membrane fluidity and other biological functions. Research has demonstrated that mutations in the DEGS1 gene are a causative factor in certain neurological diseases. 32 Given DEGS1's critical role in fatty acid metabolism and the regulation of cell growth, it is likely that future studies will uncover its association with metabolic disorders or tumorigenesis. Inhibitors or activators targeting DEGS1 may emerge as new therapeutic targets for related diseases. By modulating DEGS1 activity, it may be possible to influence processes such as fatty acid metabolism and cell growth, thereby achieving therapeutic effects.
In the context of NPC, the identification of the biomarkers GALC (Galactosylceramidase), SPTLC2 (Serine Palmitoyltransferase Long Chain Base Subunit 2), SMPD2, SMPD3 (Sphingomyelin Phosphodiesterase 2 and 3), DEGS1, and DEGS2 (Delta 4-Desaturase, Sphingolipid 1 and 2) represents a novel discovery. These genes are primarily involved in lipid metabolism, with specific roles such as degradation of certain lipids (GALC), sphingolipid metabolism (SPTLC2, SMPD2, SMPD3), and synthesis of ceramides (DEGS1, DEGS2).
The contrasting expression pattern observed in NPC, with DEGS1 being upregulated and the others downregulated, may reflect complex regulatory mechanisms in lipid metabolism within the disease context. This discovery emphasizes the importance of lipid metabolism in human health and opens new avenues for exploring the therapeutic implications of these biomarkers in NPC and possibly other diseases. Further studies are needed to elucidate the exact roles and mechanisms of these genes, both in health and disease, to validate and extend this groundbreaking finding.
Although the biomarkers we identified have not been extensively reported in connection with NPC in existing literature, the pathways enriched by the related differentially expressed genes have been reported to play significant roles in various physiological processes. Specifically, the enrichment of DEGs in pathways related to phospholipid metabolism, glycerolipid biosynthesis, and fatty acid metabolism highlights the complex interplay of lipid-related processes in various biological contexts. For instance, alterations in phospholipid metabolism have been implicated in viral replication in human cytomegalovirus (HCMV) infection. 33 Similarly, changes in glycerolipid and glycerophospholipid biosynthetic processes have been observed in genetic disorders such as Hutchinson–Gilford Progeria Syndrome. 34 The enrichment of these pathways may indicate underlying changes in membrane composition, energy metabolism, or other biosynthetic processes, reflecting their importance in health and disease. 35 Further studies are needed to elucidate the specific roles and mechanisms of these pathways in the condition under investigation.
In our study, we discovered that hsa-mir-142-5p might affect the expression of DEGS1 and SPTLC2, while FOXC1 might simultaneously regulate DEGS2, SMPD2, GALC, and SPTLC2. The role of hsa-mir-142-5p has been previously explored in various contexts, including its potential as a predictor for recurrence risk in gastric cancer patients, 36 its differential expression in sepsis-induced acute kidney injury, 37 and its proviral function during rotavirus infection. 38 However, the specific interactions with DEGS1 and SPTLC2 are novel findings in our study. Similarly, the simultaneous regulation of DEGS2, SMPD2, GALC, and SPTLC2 by FOXC1 has not been extensively reported in existing literature. Our findings extend the understanding of these regulatory elements, potentially uncovering new pathways and interactions that may be relevant to the condition under investigation.
To gain a deeper understanding of the interaction mechanisms among DEGS1, SMPD2, and DEGS2, we plan to utilize experimental approaches such as gene knockout and overexpression in future studies to validate the regulatory relationships between these genes and to explore how they specifically influence lipid metabolism pathways. Additionally, during GO enrichment analysis, we observed that the dataset primarily focused on gene expression changes in Biological Process (BP) and Molecular Function (MF) categories, with relatively little information on cellular localization or cellular components (CC). Compared to BP and MF, the CC category may encompass a more diverse array of cellular components, which may exhibit less commonality under different conditions, making it challenging to achieve significant enrichment in specific datasets. Future research should aim to increase coverage and enrichment of the CC category by expanding sample size, optimizing experimental design, or employing more comprehensive detection techniques. Further exploration of gene expression changes related to cellular components will provide a more complete understanding of the functions and mechanisms of genes within the cellular context.
Our study places particular emphasis on the role of lipid metabolism in nasopharyngeal carcinoma (NPC) and identifies a specific set of lipid metabolism-related biomarkers that may offer new targets and strategies for NPC treatment. Compared to other studies, our research provides a new dimension to our understanding of NPC through an in-depth analysis of lipid metabolism. We have focused on this specific area of lipid metabolism and utilized methods such as Weighted Gene Co-Expression Network Analysis (WGCNA), Venn diagrams, and the MCODE algorithm to construct a ‘TF-mRNA-miRNA’ interaction network comprising 309 nodes and 360 interactions. This network lays a solid foundation for therapeutic interventions in NPC. Our findings not only reinforce the significance of lipid metabolism in NPC but also offer new directions for future research, potentially advancing the development of precision medicine and personalized treatment strategies for NPC.
Supplemental Material
sj-docx-1-cbm-10.1177_18758592241301683 - Supplemental material for Exploring lipid metabolism-associated gene biomarkers and their regulatory mechanisms in nasopharyngeal carcinoma
Supplemental material, sj-docx-1-cbm-10.1177_18758592241301683 for Exploring lipid metabolism-associated gene biomarkers and their regulatory mechanisms in nasopharyngeal carcinoma by Yiyi Liu, Yingying Xie and Yong Wang in Cancer Biomarkers
Footnotes
Abbreviations
Author contributions
Interpretation or analysis of data: Y.Y.L; Preparation of the manuscript: Y.Y.L; Revision for important intellectual content: Y.W; Supervision: Y.W; Experiment and data analysis:Y.Y.L; Y.Y.X.
Funding
The authors disclosed receipt of the following financial support for the research, authorship, and/or publication of this article: This work was supported by the Guangdong Basic and Applied Basic Research Foundation (2020A1515110108) and the WU JIEPING MEDICAL FOUNDATION (320.6750.2021-10-68).
Declaration of conflicting interests
The authors declare that the research was conducted in the absence of any commercial or financial relationships that could be construed as a potential conflict of interest.
Data availability
Supplemental material
Supplemental material for this article is available online.
References
Supplementary Material
Please find the following supplemental material available below.
For Open Access articles published under a Creative Commons License, all supplemental material carries the same license as the article it is associated with.
For non-Open Access articles published, all supplemental material carries a non-exclusive license, and permission requests for re-use of supplemental material or any part of supplemental material shall be sent directly to the copyright owner as specified in the copyright notice associated with the article.