
Abstract
Background
Acute myeloid leukemia (AML) prognosis varies greatly, underscoring the need for novel biomarkers to improve patient stratification. T-cell leukemia translocation-associated gene (TCTA) has emerged as a potential player in hematological malignancies, yet its role in AML remains unexplored.
Objective
To investigate the prognostic significance of TCTA in AML and elucidate its functional mechanisms.
Methods
RNA sequencing data from 173 AML patients (TCGA) and 70 normal controls (GTEx) were analyzed. Patients were categorized into high and low TCTA expression groups. Bioinformatics tools assessed Gene Ontology, KEGG pathways, and immune infiltration and constructed a nomogram predicting 1–5-year overall survival (OS).
Results
High TCTA expression correlated with significantly reduced OS (P < 0.001), with multivariate analysis identifying TCTA expression alongside age and cytogenetic risk as independent OS predictors. Receiver operating characteristic analysis validated TCTA's diagnostic potential. Enrichment analyses implicated TCTA in pathways critical to AML, such as hematopoiesis, p53 signaling, and DNA methylation, with a notable association with natural killer (NK) cell activity.
Conclusions
Elevated TCTA expression signifies poor prognosis in AML, positioning it as a promising prognostic biomarker. Its involvement in key AML-related pathways highlights TCTA's functional relevance and potential as a therapeutic target in AML management.
Keywords
Introduction
Acute myeloid leukemia (AML) is the most common acute leukemia in adults and among the most lethal, accounting for 80% of adult acute leukemia.1,2 The 5-year survival rate for adults with AML is disappointingly low, at 26%.2,3 AML is a hematological malignancy arising from the occurrence of genetic mutations in hematopoietic progenitors, blocking maturation and leading to uncontrolled growth of leukemic blasts in the bone marrow (BM). While the clinical presentation of AML is quite uniform, it is a highly heterogeneous disease at the cytogenetic and molecular levels, and genetic abnormalities and epigenetic alterations play crucial roles in the pathogenesis of AML.2,4 Genetic abnormalities such as chromosome aberrations and gene mutations are considered the most relevant prognostic information. 5
In 1995, Aplan et al. 6 cloned and characterized a novel gene at the site of a t(1;3)(p34;p21) translocation breakpoint in T-cell acute lymphoblastic leukemia (ALL), designating this gene as T-cell leukemia translocation-associated gene (TCTA). TCTA is ubiquitously expressed in normal tissues, lung cancer cell lines, and T or B cell acute lymphoblastic leukemia. 6 TCTA has been reported to be associated with a poor prognosis of AML. 7 Still, the functions of TCTA in tumorigenesis are unclear.
Therefore, this study investigated the expression levels of TCTA and prognostic value in patients with AML. In this study, functional annotation was also performed to explain the biological functions of TCTA in AML. It is hoped that the results might contribute to a more complete understanding of the diagnosis and classification of AML. This work also contributed to research on the tumor-infiltrating immune cells’ landscape in the tumor microenvironment and provided an opportunity to identify new targets for therapy.
Materials and methods
Data sources and processing
In order to investigate the expression pattern of TCTA, the RNA sequencing data from The Cancer Genome Atlas (TCGA) tumor samples (n = 173), TCGA paraneoplastic (n = 0), and GTEx normal (n = 70) were processed using the Toil process and collected from UCSC XENA (https://xenabrowser.net/datapages/). 8 The workflow type was TPM. In order to verify the expression of TCTA in AML samples, the gene expression profiles of the GSE9476, GSE34577, GSE43176, and GSE65409 datasets were downloaded from the Gene Expression Omnibus (GEO) (https://www.ncbi.nlm.nih.gov/) database. In order to understand the relationship between the expression level of TCTA and the prognosis of patients with treated AML, the data from 151 AML samples treated with chemotherapy were collected from the TCGA database (https://portal.gdc.cancer.gov/). The TCTA expression in patients with AML was assessed using box plots compared with normal tissues of GTEx samples. The median level of TCTA expression in the cohort was selected as the cut-off value, and the patients were grouped as low vs. high TCTA. The workflow type was TPM. All the clinical, cytogenetic, molecular, and microarray data were retrieved from the databases. The patients with unavailable or unclear clinical information were removed. All the data in this study were from open-access databases. No experiments involving animals or humans were conducted. Therefore, ethics committee approval was not required.
Identification of the differentially expressed genes
Using the TCGA median mRNA expression as the cut-off value, the gene expression profiles of the high-expression group and the low-expression group were obtained, respectively, and the significantly expressed genes in the two groups were analyzed and screened. The original count matrix was normalized using the variance stabilizing transformations (VST) method provided by the DESeq2 package in R 4.2.1 (The R Project for Statistical Computing, www.r-project.org). Differentially expressed genes (DEGs) with a threshold of |log2FC| > 1.5 and Padj < 0.05 were identified for functional enrichment analysis.
Functional analysis
Gene Ontology (GO) terms and Kyoto Encyclopedia of Genes and Genomes (KEGG) enrichment analyses were performed to infer the function or pathway that TCTA may be involved in. GO and KEGG analyses and visualization were performed in R 4.2.1 (The R Project for Statistical Computing, www.r-project.org) using the clusterProfiler package (for enrichment analysis) and the org.Hs.eg.db package (for ID conversion). After the ID conversion of the input list, enrichment analysis was performed with the clusterProfiler package.
Gene set enrichment analysis
Gene set enrichment analysis (GSEA) was also used for TCTA functional mechanism mining. All GSEA analyses and visualizations were performed in R 4.2.1 (The R Project for Statistical Computing, www.r-project.org) using the clusterProfiler package (for enrichment analysis) and the msigdbr package (reference gene set source). The gene set database was Molecular Signatures Database (MSigDB) Collections (https://www.gsea-msigdb.org/gsea/msigdb/index.jsp). GSEA was first performed, followed by a detailed description of each gene set from the MSigDB Collections and by ID conversion of the input data and GSEA analysis using the clusterProfiler package. The C2 (c2.all.v7.0.symbols.gmt) gene set from the Molecular Signatures Database (MSigDB) was used as reference sets for GSEA analysis. 9 DESeq2 uses the original count values for variance analysis, and the original count matrix is normalized using the variance stabilizing transformation (VST) method provided by the DESeq2 package. The expression correction method was TPM. False discovery rate (FDR) < 0.25 and Padj <0.05 were considered statistically significant. P values were adjusted using the Benjamini-Hochberg (BH) method.
Immune infiltration analysis
The single sample Gene Set Enrichment Analysis (ssGSEA) algorithm was used to calculate the score of immune cells in the tissue and infer the infiltration of immune cells. The infiltration levels of 24 immune cell types were quantified from gene expression profiles, 10 and the correlations were examined using Spearman's method.
Nomogram construction
The selected data were included in a Cox proportional hazards regression model for multivariable analysis to analyze the variables associated with AML prognosis. A nomogram was constructed to predict 1-, 3- and 5-year OS for patients with AML. Statistical analysis and visualization were carried out in R version 4.2.1. The R packages involved were survival [3.4.0] and the rms package (6.3-0). Proportional risk hypothesis testing and Cox regression analysis were performed using the survival package. Nomogram correlation model construction and visualization were performed using the rms package. Calibration analysis and visualization were performed using the rms package.
Statistical analysis
All statistical analyses were conducted using R 3.6.3 (The R Project for Statistical Computing, www.r-project.org). The R packages DESeq2, 11 clusterProfiler, 12 org.Hs.eg.db, survminer, survival, rms, pROC, timeROC, GSVA, 13 and ggplot2 were used in this study for analyzing data or drawing graphs. The Mann-Whitney U test was used to analyze the differences in TCTA expression between multiple tumor and non-tumor samples by group. The t-test was used to analyze the differences in TCTA expression between subgroups (e.g., age >60 vs. < 60) in the AML dataset. Logistic regression was used to analyze the relationship between TCTA expression and clinicopathological features. One-way ANOVA was used to compare three groups (e.g., good vs. moderate vs. poor cytogenetics). The chi-square test was used to compare differences in clinical variables between the high vs. low TCTA groups in the AML baseline data sheet.
The receiver operating characteristic (ROC) curve was used to evaluate the diagnostic value of TCTA expression and the accuracy of predicting the prognosis of AML. Overall survival (OS) was defined as the time from registration to death (for any reason) or last contact. Kaplan-Meier survival curves and the log-rank test were used for survival analysis.
Results
RNA expression of TCTA in patients with AML
In the TCGA transcriptome datasets containing 15,766 samples, the TCTA mRNA expression levels of 30 different cancers were compared with the corresponding normal tissues (Figure 1(a)). In the TCGA-LAML dataset, the transcriptional levels of TCTA in AML were significantly higher than in normal tissues (Figure 1(b)). Furthermore, GSE9476, GSE34577, GSE43176, and GSE65409 datasets were downloaded from the GEO database to verify TCTA expression in other datasets. The results also indicated that the expression of TCTA was higher in AML than in normal tissues (Figure 1(c)–(f)). The ROC curve analysis to examine the diagnostic value of TCTA expression in AML and normal revealed an area under the curve (AUC) of 1.000 for TCTA, suggesting a high diagnostic value (Figure 1(g)).
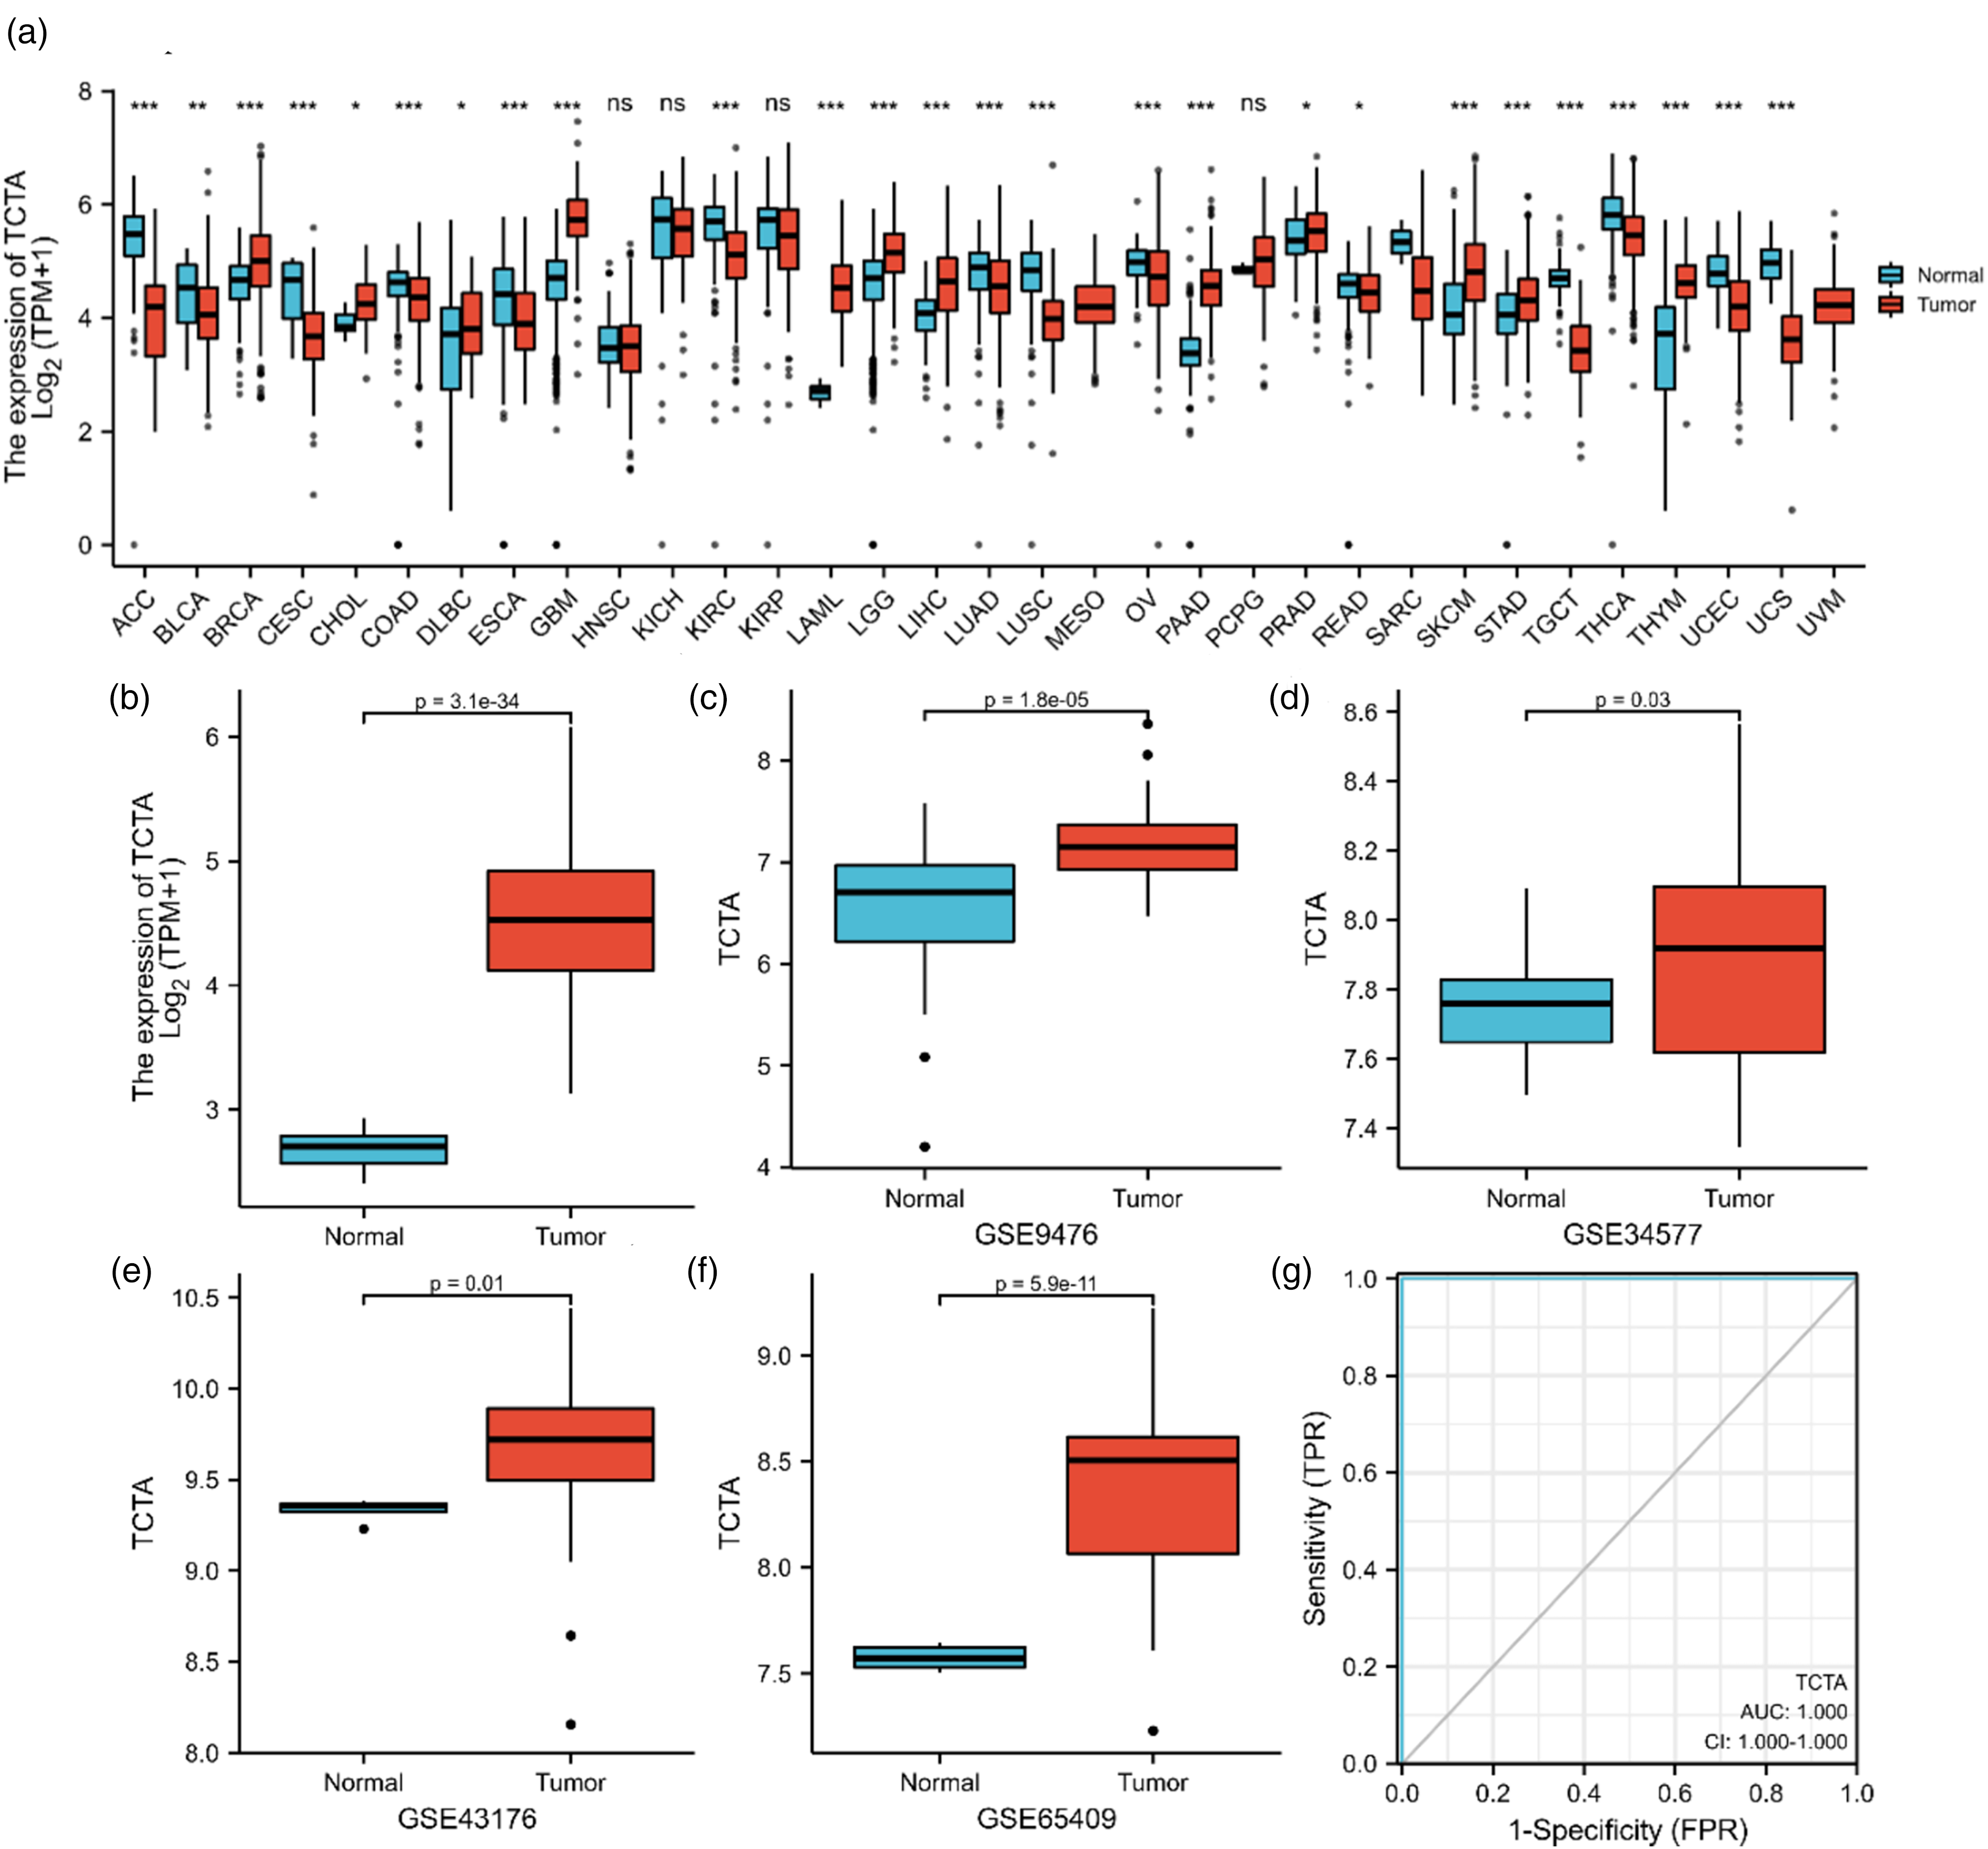
(a) The expression level of TCTA in normal and cancer samples. NS: P 0.05 or higher; The expression levels and diagnostic value of TCTA in normal and acute myeloid leukemia (AML) samples. (b) The expression level of TCTA in GTEx normal samples and TCGA AML samples. (c) The expression level of TCTA in the GSE9476 cohort. (d) The expression level of TCTA in the GSE34577 cohort. (e) The expression level of TCTA in the GSE43176 cohort. (f) The expression level of TCTA in the GSE65409 cohort. (g) ROC curve shows the accuracy of TCTA in diagnosing AML. *P < 0.05; **P < 0.01; ***P < 0.001.
Correlation between TCTA expression and clinical characteristics
The patients were from 21 to 88 years old, including 83 males and 68 females. The leukocyte count ranges from 1 to 224 × 109/L. The FAB typing was M0 in 19 patients, M1 in 44, M2 in 44, M3 in 21, M4 in 42, M5 in 22, M6 in 3, and M7 in 3. As can be seen in Figure 2, increased TCTA had a significant correlation with age (≤60 vs. > 60 years, P = 0.02), white blood cell (WBC) count (≤20 vs. > 20 × 109/L, P < 0.001), BM blasts (≤20% vs. > 20%, P = 0.01), cytogenetic risk (favorable vs. intermediate, P = 0.005), and FLT3 mutation (negative vs. positive, P = 0.02).
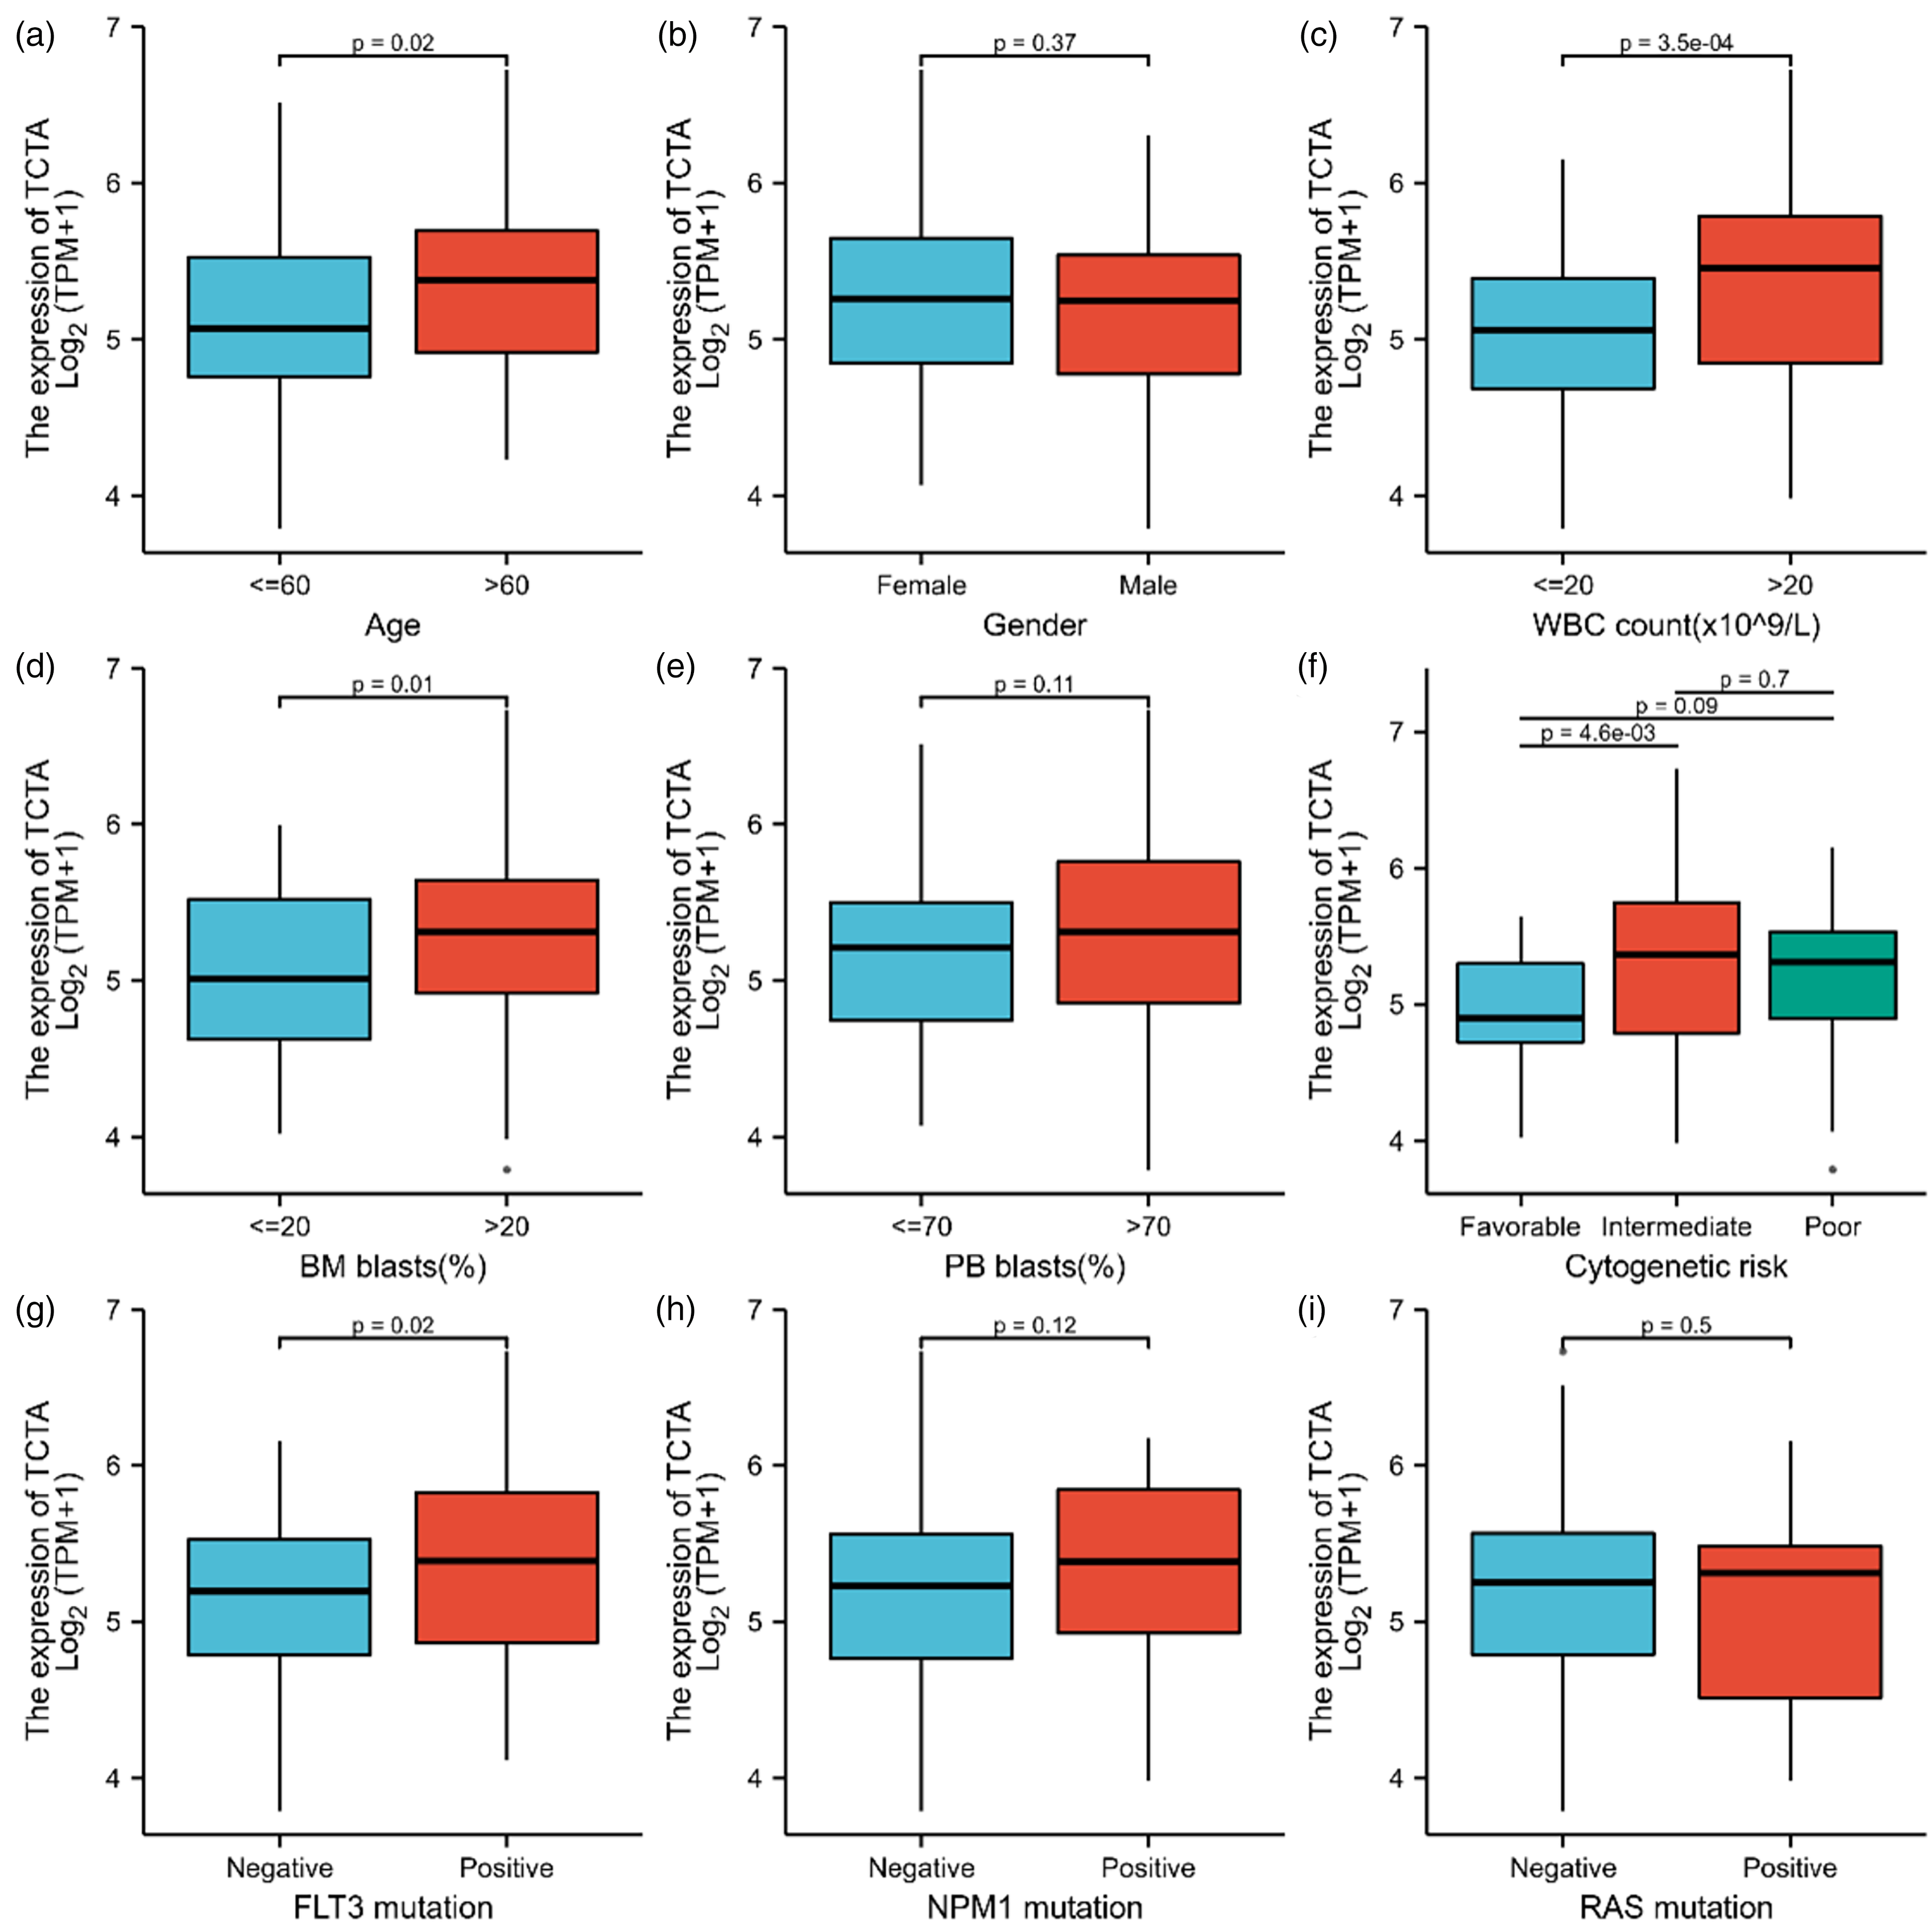
Association between TCTA expression and clinical features and cytogenetic risk levels in acute myeloid leukemia (AML). (a–i) TCTA expression levels in subgroups based on age (a), sex (b), white blood cells (WBC) count (c), bone marrow (BM) blasts percentage (d), peripheral blood (PB) blasts percentage (e), cytogenetic risk (f), FLT3 mutation (g), NPM1 mutation (h), and RAS mutation status (i).
The relationship between TCTA expression and clinicopathological features was analyzed by using logistic regression (Table S1). TCTA levels were used as an independent variable, and each patient characteristic was used as a dependent variable in the logistic model to analyze the predictive effect of TCTA on the variables one by one. High TCTA expression was significantly correlated with age (OR = 2.224 for ≤60 vs. > 60, P = 0.017), WBC count (OR = 2.669 for ≤20 vs. > 20 × 109/L, P = 0.004), and cytogenetic risk (OR = 2.998 for intermediate & poor vs. favorable, P = 0.012). Taken together, these results indicate an association between high TCTA expression and adverse clinical and genetic characteristics of AML. The TCTA expression was associated with the FAB classification (P = 0.005) (Table S2).
Prognostic value of TCTA in patients with AML
The Kaplan-Meier showed that a high expression of TCTA was negatively correlated with OS (P < 0.001) (Figure 3(a)), indicating that the OS of patients with high TCTA expression was significantly lower than those with low TCTA expression. The Kaplan-Meier analysis showed that high expressed TCTA correlated with poor prognosis in the subgroups of age >60 (P = 0.01), WBC >20 × 109/L (P = 0.035), PB blasts >70% (P = 0.027), intermediate cytogenetic risk (P = 0.007), normal cytogenetics (P = 0.007), FLT3 mutation-positive (P = 0.01), and NPM1 mutation-positive (P = 0.03) (Figure 3(b)–(h)). The time-dependent ROC survival curve indicated that TCTA had the highest accuracy for prognostic prediction at 5 years, with an AUC of 0.756 (Figure 3(i)).
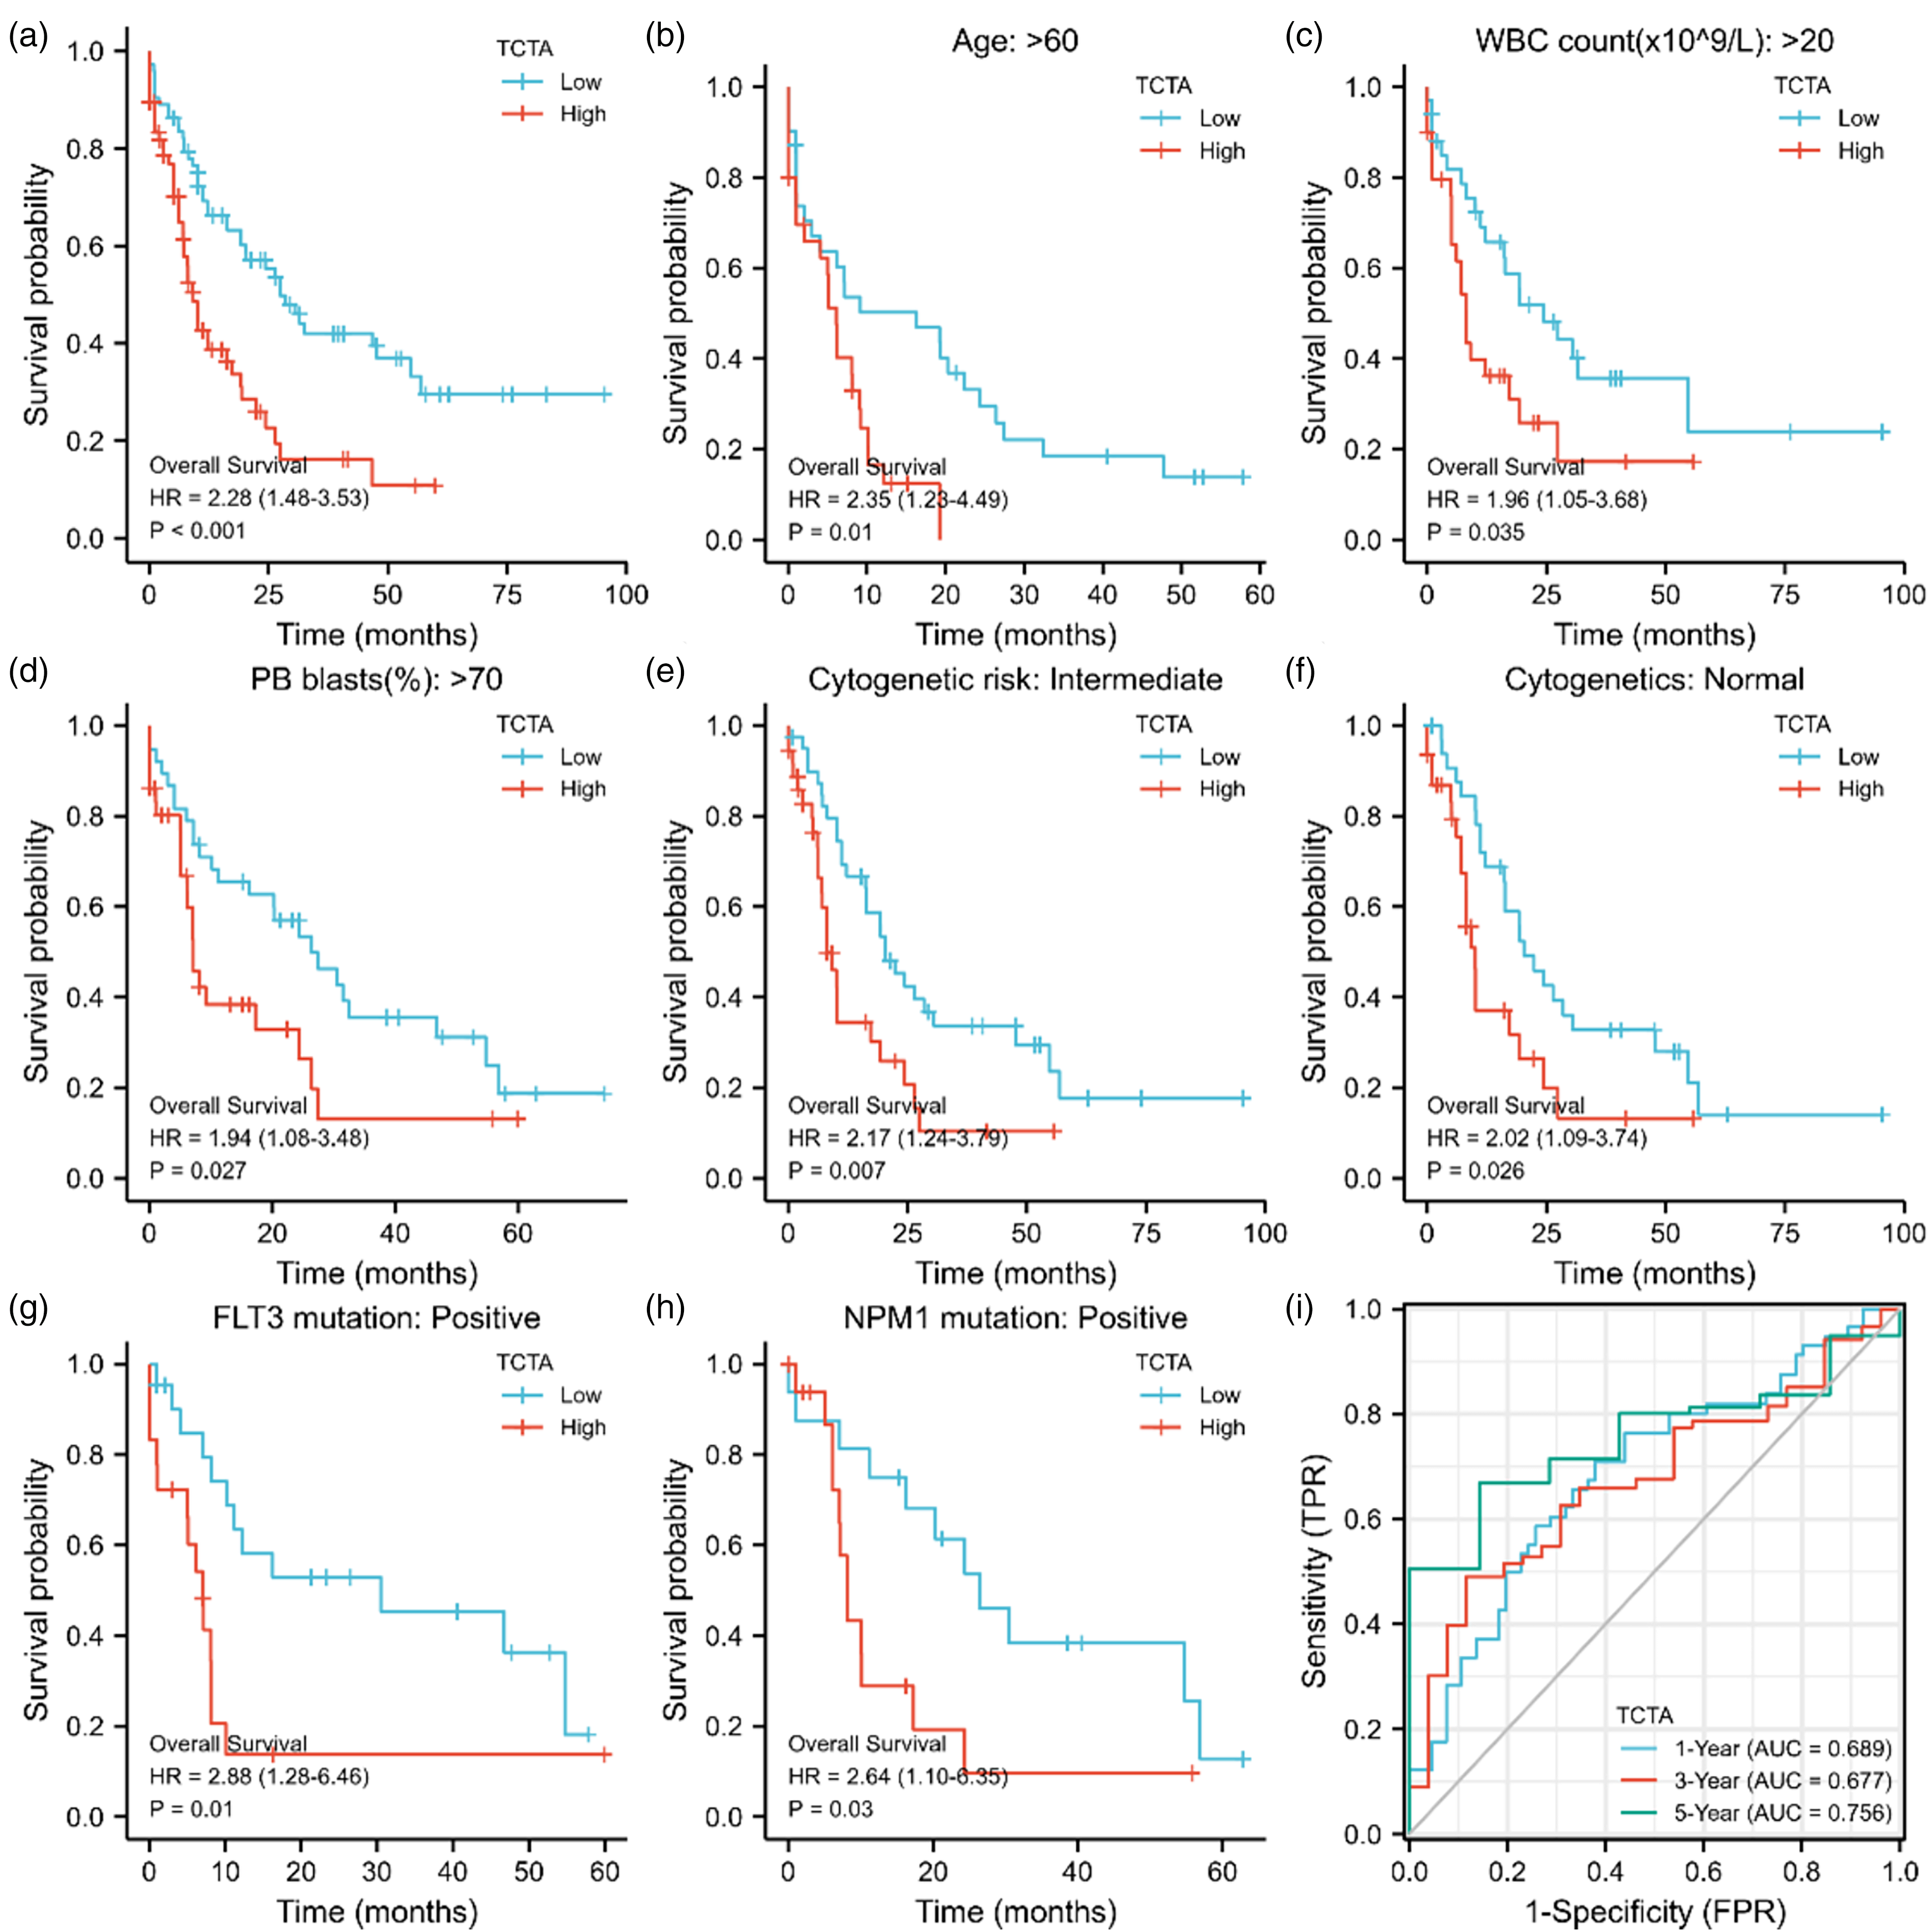
Prognostic analysis of TCTA in patients with acute myeloid leukemia (AML). (a) Kaplan-Meier curves in all AML patients. (b) Kaplan-Meier curves in AML patients with age >60 years. (c) Kaplan-Meier curves in AML patients with white blood cell (WBC) count >20 × 109/L. (d) Kaplan-Meier curves in AML patients with peripheral blood (PB) blasts >70%. (e) Kaplan-Meier curves in intermediate cytogenetic risk AML patients. (f) Kaplan-Meier curves in cytogenetically normal AML patients. (g, h) Kaplan-Meier curves in subgroups with FLT3 mutation-positive and NPM1 mutation-positive in AML patients. (i) time-dependent ROC curve of TCTA.
Univariable and multivariable analyses were performed to determine whether high expression of TCTA was an independent risk factor for poor prognosis. The univariable Cox analyses showed that age, cytogenetic risk, and TCTA expression were associated with OS (P < 0.001). The multivariable Cox analysis showed that TCTA expression (P = 0.027), age >60 (P < 0.001), and poor cytogenetic risk (P = 0.023) were independently associated with OS. These data suggest that elevated TCTA expression was associated with a relatively shorter OS in patients with AML (Table S3). A nomogram to predict OS in patients with AML is shown in Figure 4(a). The nomogram to predict OS was created based on age (≤60 or >60 years), cytogenetic risk (favorable, intermediate, or poor), and TCTA expression (low or high). Higher total points based on the sum of the assigned number of points for each factor in the nomogram were associated with a worse prognosis. The model's accuracy and potential model overfitting were assessed by bootstrap validation with 200 resamplings. The 40-sample bootstrapped calibration plot for the prediction of 1-, 3-, and 5-year OS is shown in Figure 4(b).

A prognostic model of TCTA in acute myeloid leukemia (AML). (a) Nomogram for predicting the probability of 1-, 3-, and 5-year overall survival (OS) for AML. (b) Calibration plot of the nomogram for predicting the probability of OS at 1, 3, and 5 years.
Predicted function and pathways of TCTA in patients with AML
According to the TCTA expression, 151 AML samples were divided into the high- and low-expression groups. The DEGs of these two groups were analyzed, and a list of DEGs related to TCTA was generated. There were 103 upregulated and 263 downregulated genes associated with TCTA expression (Padj < 0.05, |log2(FC)|>1.5) (Figure 5(a)). The top ten upregulated genes and top ten downregulated genes between the TCTA high- and low-expressed groups are illustrated by the heat map (Figure 5(b)). GO and KEGG pathway enrichment analyses were performed to infer the functional significance of the DEGs between high and low TCTA expression in AML (Figure 6). The DEGs were associated with the biological processes (BP) of ion transmembrane transport, signaling receptor activity, cell development, and protein processing. The cellular component (CC) included the ion channel complex, transmembrane transporter complex, and membrane region. The molecular functions (MF) included ion channel activity, transmembrane receptor protein tyrosine kinase activity, chemokine receptor binding, and growth factor binding. KEGG included neuroactive ligand-receptor interaction.

Genes positively and negatively correlated with TCTA in acute myeloid leukemia (AML). (a) Volcano plot of differentially expressed genes. Red dots in the right sector represent positively correlated genes, while green dots in the left sector are negatively correlated genes. (b) Heat map of the 20 differentially expressed RNAs, including 10 upregulated genes and 10 downregulated genes. The X-axis represents the samples, while the Y-axis denotes the differentially expressed RNAs. Green and red tones represented down-regulated and upregulated genes, respectively. (color version available online)
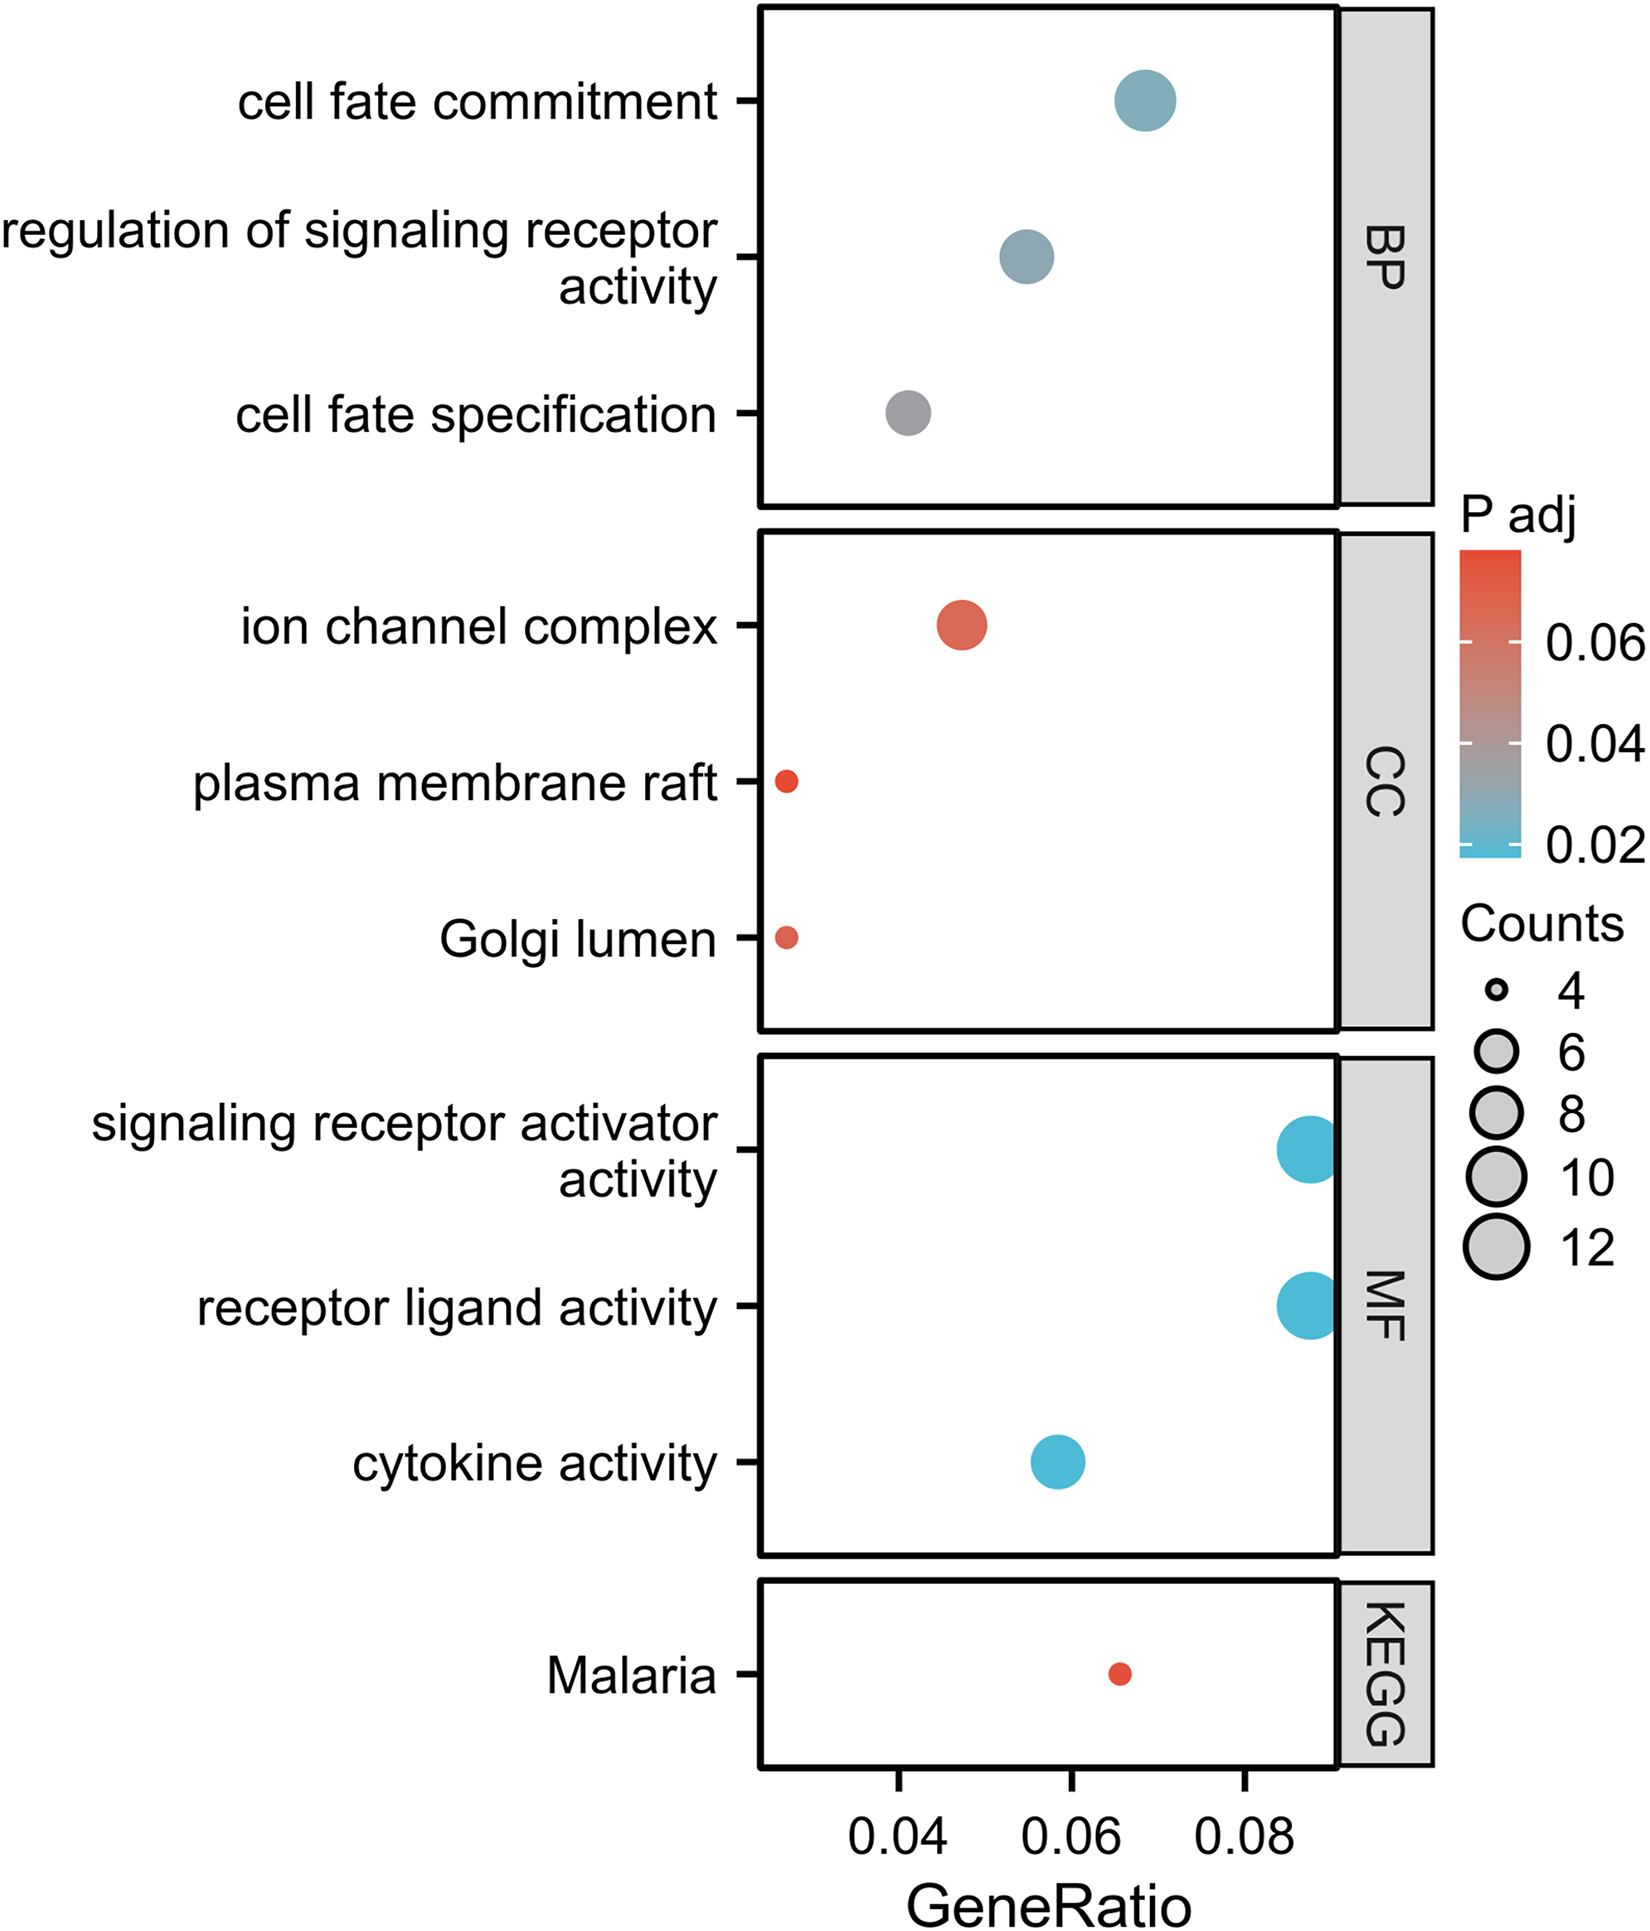
Functional enrichment analysis of TCTA and its related genes in acute myeloid leukemia (AML).
A GSEA analysis was conducted using the TCTA-related DEGs to explore the functional mechanisms of TCTA in AML. There were significant differences in the following signaling pathways between the high- and low-TCTA groups: hematopoietic cell lineage, acute myeloid leukemia, p53 signaling pathway, TNF signaling, signaling by WNT in cancer, oncogenic MAPK signaling, cell cycle pathway, hematopoietic stem cell differentiation, and DNA methylation (Figure S1).
Immune infiltration analysis in AML
The Spearman correlation analysis showed that the TCTA expression levels in the AML microenvironment were correlated with immune cell infiltration levels quantified by ssGSEA. High TCTA expression was positively correlated with infiltration levels of NK CD56bright cells (Figure 7).

Immune cell infiltration analysis of TCTA in acute myeloid leukemia (AML). (a) The lollipop chart shows the correlation between TCTA expression level and 24 immune cells. (b) Infiltration level of NK CD56bright cells between low and high TCTA expression. (c) Correlation between the relative enrichment score of NK CD56bright cells and the expression level of TCTA.
Discussion
AML is currently considered a group of heterogeneous leukemia subentities with different pathophysiological, clinical, cytogenetic, and molecular characteristics and prognoses that could benefit from individualized selective treatments. 14 A previous study identified TCTA among a panel of three genes (TCTA, SFXN3, and PLA1G4A) associated with the prognosis of AML, 7 but the functions of TCTA in tumorigenesis are unclear. Hence, this study examined the prognostic value and potential biological functional mechanisms of TCTA in AML using a genome-wide expression profile dataset. The results suggest that high TCTA expression was related to a poor prognosis and could be a prognostic biomarker in AML. Hence, TCTA might be a potential target for AML treatment.
The relationships between TCTA expression and the clinical characteristics and genetic changes of AML patients were examined to verify whether TCTA could be used as a risk stratification tool. The results showed that TCTA expression was higher in the >60-year-old subgroup, consistent with a poorer OS in older AML patients. Moreover, high TCTA expression was positively correlated with high WBC counts and an increased proportion of BM blasts. The TCGA expression levels were upregulated in patients with AML in the cytogenetic intermediate risk subtype and with FLT3 mutations, although there were no significant differences between patients with or without NPM1 activation. Patients with NPM1-mutated AML have a more favorable prognosis, while those with FLT3-ITD mutations have a poor prognosis. 15 The Kaplan-Meier analysis of the TCGA data revealed that high TCTA expression was associated with shorter OS in AML. The ROC analysis also confirmed its prognostic value. In addition, perhaps the most striking finding from this study was that the high expression of TCTA predicted poor prognosis in both subgroups of AML patients with FLT3 and NPM1 mutation. In clinical practice, FLT3 mutations (30% of AML) and NPM1 mutations (40%-50% of normal karyotype AML) are identified as important molecular subgroups of AML. Still, a high TCTA expression was also associated with higher proportions of the M0 (worse prognosis than average), M1 (average prognosis), and M5 (average prognosis) FAB subtypes 16 than with low TCTA expression, while the patients with low TCTA expression had higher proportions of the M3 subtype (best prognosis), 16 supporting the OS data. In newly diagnosed FLT3-mutated AML, the allelic ratio of FLT3-ITD to FLT3-wild type strongly influenced the outcome of chemotherapy-based therapies.17,18 The multivariable Cox regression analysis showed that high expression of TCTA was an independent prognostic factor besides age >60 years. Wang et al. 7 showed that age >60 years was independently associated with prognosis, while a panel of TCTA, SFXN3, and PLA2G4A predicted OS. More importantly, a prognostic nomogram involving age, cytogenetic risk classification, and TCTA was constructed. Nomograms are intuitive and easy-to-use tools that can be used in the clinical setting to rapidly determine the prognosis of a patient using readily available clinical information.
The GO and KEGG analyses indicated that the co-expressed genes were enriched in multiple functional categories and pathways that could contribute to regulating cell development, cell differentiation, cell morphogenesis, ion transmembrane transport, and signaling receptor activity in AML. Compared with traditional pathway enrichment analyses such as GO and KEGG, GSEA can detect the expression changes of gene sets rather than individual genes, and GSEA can detect subtle enrichment signals, which makes the results more reliable and flexible. 19 There is little literature on TCTA, limiting the possible comparisons and analyses. Still, the results showed that p53, TNF, WNT, MAPK, and DNA methylation were closely related to the high expression of TCTA in AML. The p53 gene is critical for hematopoietic stem cell function, and its dysfunction can affect the evolution, biological phenotype, treatment response, and prognosis of AML.20–23 Several patients with TP53 mutations do not benefit from chemotherapy and may have similar or improved outcomes and less toxicity with lower-intensity approaches.24,25 In AML, TNF-α may be important for drug resistance and enhanced survival of leukemic clones, 26 and it may also function as a growth factor. 27 WNT signaling is upregulated through various mechanisms in AML that are necessary for the maintenance of leukemia stem cells. 28 The MAPK pathway plays a critical role in regulating cell survival, and interruption of this pathway results in sensitization to spontaneous and drug-induced apoptosis. 29 Mesenchymal stromal cells can regulate the apoptosis repressor with the caspase recruitment domain in AML by activating the MAPK and PI3 K signaling pathways, thereby affecting drug resistance and prognosis, and can thus be used as a potential therapeutic target for AML. 30 DNA methylation and mutation patterns may occur with distinct kinetics to affect the biological and clinical features of AML. 31 For example, distinct DNA methylation patterns are used to define AML subgroups and a set of aberrantly methylated genes are identified and associated with the clinical outcomes.32,33
In the immune cell infiltration analysis, high TCTA expression was associated with higher CD56bright and CD56dim NK cells. Human NK cells account for 10%-15% of the circulating lymphocytes, of which CD56bright and CD56dim NK cells are the primary subsets. CD56bright NK cells are considered immature NK cells and the precursors of CD56dim NK cells. NK cells play a key role in antitumor immunity by directly recognizing tumor cells as targets. 34 Previous studies showed that CD56bright NK cells promote tumor development.35–37 Promoting tumor angiogenesis, tumor immune escape, and loss of activity to kill tumor stem cells have been demonstrated to be involved in the malignant progression of cancer-related to CD56bright NK cells.36,38,39 In this study, high TCTA expression was associated with CD56bright NK cells and a poor prognosis in AML patients. The increased CD56bright NK cells could be responsible for the poorer prognosis. Future studies should examine that relationship more closely.
The limitation of this study lies in the small sample size. The data were from the TCGA databank (public data repository), and the analyses were limited by the data available in the datasets. No treatment details were available in the original data. All patients received chemotherapy, and no transplant data were available. Furthermore, no risk categorization was possible because of the available data. Clinical samples and actual local patient data should be used to verify the prognostic role of TCTA mRNA and protein in AML. Experimental validation should also be performed to investigate the regulatory mechanisms between TCTA and the genetic alterations (such as NPM1 and FLT3) and essential pathways selected by GSEA analysis.
In conclusion, this study identified the aberrant expression and prognostic value of TCTA in AML. TCTA was increased in high-risk subgroups of patients with AML and thus could serve as a potential biomarker. Our results illustrate that the overexpression of TCTA is an independent indicator for predicting the adverse outcomes of AML and might play an essential role in leukemogenesis. Further research based on this discovery should be carried out to reveal the biological impacts of TCTA in AML.
Supplemental Material
sj-xlsx-1-cbm-10.1177_18758592241296287 - Supplemental material for High TCTA expression is an adverse prognostic biomarker in acute myeloid leukemia
Supplemental material, sj-xlsx-1-cbm-10.1177_18758592241296287 for High TCTA expression is an adverse prognostic biomarker in acute myeloid leukemia by Yunli Shao and Tong Qin in Cancer Biomarkers
Supplemental Material
sj-xlsx-2-cbm-10.1177_18758592241296287 - Supplemental material for High TCTA expression is an adverse prognostic biomarker in acute myeloid leukemia
Supplemental material, sj-xlsx-2-cbm-10.1177_18758592241296287 for High TCTA expression is an adverse prognostic biomarker in acute myeloid leukemia by Yunli Shao and Tong Qin in Cancer Biomarkers
Supplemental Material
sj-xlsx-3-cbm-10.1177_18758592241296287 - Supplemental material for High TCTA expression is an adverse prognostic biomarker in acute myeloid leukemia
Supplemental material, sj-xlsx-3-cbm-10.1177_18758592241296287 for High TCTA expression is an adverse prognostic biomarker in acute myeloid leukemia by Yunli Shao and Tong Qin in Cancer Biomarkers
Supplemental Material
sj-xlsx-4-cbm-10.1177_18758592241296287 - Supplemental material for High TCTA expression is an adverse prognostic biomarker in acute myeloid leukemia
Supplemental material, sj-xlsx-4-cbm-10.1177_18758592241296287 for High TCTA expression is an adverse prognostic biomarker in acute myeloid leukemia by Yunli Shao and Tong Qin in Cancer Biomarkers
Supplemental Material
sj-xlsx-5-cbm-10.1177_18758592241296287 - Supplemental material for High TCTA expression is an adverse prognostic biomarker in acute myeloid leukemia
Supplemental material, sj-xlsx-5-cbm-10.1177_18758592241296287 for High TCTA expression is an adverse prognostic biomarker in acute myeloid leukemia by Yunli Shao and Tong Qin in Cancer Biomarkers
Supplemental Material
sj-xlsx-6-cbm-10.1177_18758592241296287 - Supplemental material for High TCTA expression is an adverse prognostic biomarker in acute myeloid leukemia
Supplemental material, sj-xlsx-6-cbm-10.1177_18758592241296287 for High TCTA expression is an adverse prognostic biomarker in acute myeloid leukemia by Yunli Shao and Tong Qin in Cancer Biomarkers
Supplemental Material
sj-xlsx-7-cbm-10.1177_18758592241296287 - Supplemental material for High TCTA expression is an adverse prognostic biomarker in acute myeloid leukemia
Supplemental material, sj-xlsx-7-cbm-10.1177_18758592241296287 for High TCTA expression is an adverse prognostic biomarker in acute myeloid leukemia by Yunli Shao and Tong Qin in Cancer Biomarkers
Supplemental Material
sj-xlsx-8-cbm-10.1177_18758592241296287 - Supplemental material for High TCTA expression is an adverse prognostic biomarker in acute myeloid leukemia
Supplemental material, sj-xlsx-8-cbm-10.1177_18758592241296287 for High TCTA expression is an adverse prognostic biomarker in acute myeloid leukemia by Yunli Shao and Tong Qin in Cancer Biomarkers
Supplemental Material
sj-xlsx-9-cbm-10.1177_18758592241296287 - Supplemental material for High TCTA expression is an adverse prognostic biomarker in acute myeloid leukemia
Supplemental material, sj-xlsx-9-cbm-10.1177_18758592241296287 for High TCTA expression is an adverse prognostic biomarker in acute myeloid leukemia by Yunli Shao and Tong Qin in Cancer Biomarkers
Supplemental Material
sj-xlsx-10-cbm-10.1177_18758592241296287 - Supplemental material for High TCTA expression is an adverse prognostic biomarker in acute myeloid leukemia
Supplemental material, sj-xlsx-10-cbm-10.1177_18758592241296287 for High TCTA expression is an adverse prognostic biomarker in acute myeloid leukemia by Yunli Shao and Tong Qin in Cancer Biomarkers
Supplemental Material
sj-xlsx-11-cbm-10.1177_18758592241296287 - Supplemental material for High TCTA expression is an adverse prognostic biomarker in acute myeloid leukemia
Supplemental material, sj-xlsx-11-cbm-10.1177_18758592241296287 for High TCTA expression is an adverse prognostic biomarker in acute myeloid leukemia by Yunli Shao and Tong Qin in Cancer Biomarkers
Supplemental Material
sj-xlsx-12-cbm-10.1177_18758592241296287 - Supplemental material for High TCTA expression is an adverse prognostic biomarker in acute myeloid leukemia
Supplemental material, sj-xlsx-12-cbm-10.1177_18758592241296287 for High TCTA expression is an adverse prognostic biomarker in acute myeloid leukemia by Yunli Shao and Tong Qin in Cancer Biomarkers
Supplemental Material
sj-xlsx-13-cbm-10.1177_18758592241296287 - Supplemental material for High TCTA expression is an adverse prognostic biomarker in acute myeloid leukemia
Supplemental material, sj-xlsx-13-cbm-10.1177_18758592241296287 for High TCTA expression is an adverse prognostic biomarker in acute myeloid leukemia by Yunli Shao and Tong Qin in Cancer Biomarkers
Supplemental Material
sj-tiff-14-cbm-10.1177_18758592241296287 - Supplemental material for High TCTA expression is an adverse prognostic biomarker in acute myeloid leukemia
Supplemental material, sj-tiff-14-cbm-10.1177_18758592241296287 for High TCTA expression is an adverse prognostic biomarker in acute myeloid leukemia by Yunli Shao and Tong Qin in Cancer Biomarkers
Supplemental Material
sj-docx-15-cbm-10.1177_18758592241296287 - Supplemental material for High TCTA expression is an adverse prognostic biomarker in acute myeloid leukemia
Supplemental material, sj-docx-15-cbm-10.1177_18758592241296287 for High TCTA expression is an adverse prognostic biomarker in acute myeloid leukemia by Yunli Shao and Tong Qin in Cancer Biomarkers
Supplemental Material
sj-docx-16-cbm-10.1177_18758592241296287 - Supplemental material for High TCTA expression is an adverse prognostic biomarker in acute myeloid leukemia
Supplemental material, sj-docx-16-cbm-10.1177_18758592241296287 for High TCTA expression is an adverse prognostic biomarker in acute myeloid leukemia by Yunli Shao and Tong Qin in Cancer Biomarkers
Footnotes
Acknowledgments
The author would like to acknowledge the TCGA project for data sharing.
Ethics approval
Not applicable.
Informed Consent
Not applicable.
Author contributions statement
Yunli Shao carried out the studies, participated in collecting data, and drafted the manuscript. Tong Qin performed the statistical analysis and participated in its design. All authors read and approved the final manuscript.
Funding
The author(s) received no financial support for the research, authorship, and/or publication of this article.
Declaration of conflicting interests
The author(s) declared no potential conflicts of interest with respect to the research, authorship, and/or publication of this article.
Data availability
Supplemental material
Supplemental material for this article is available online.
References
Supplementary Material
Please find the following supplemental material available below.
For Open Access articles published under a Creative Commons License, all supplemental material carries the same license as the article it is associated with.
For non-Open Access articles published, all supplemental material carries a non-exclusive license, and permission requests for re-use of supplemental material or any part of supplemental material shall be sent directly to the copyright owner as specified in the copyright notice associated with the article.