
Abstract
This article puts Down’s instrumental voter model (IVM) to a formal test using data of the 2017 Chilean national elections. It aims at two novel exercises in the research in the calculus of voting. Using a brand-new questionnaire with indicators on instrumental and consumption motivations for voting, we reassess the voting equation in Santiago de Chile. Furthermore, we analyse whether instrumental and consumption motivations have distinctive effects for individuals with different socio-demographic characteristics. Our results show that they do: women, younger, lower educated, and unmarried citizens are more responsive to both instrumental and consumption motivations. Moreover, the factors of the IVM travel better to Santiago de Chile than those of the consumption model.
Introduction
Voting is the most central mode of participation in politics (van Deth, 2017; Gallego, 2015). Answering the question of why people vote has thus become, after the seminal book by Downs (1957), one of the most researched fields in political science (Aldrich and Jenke, 2017; Aldrich, 1993). It now contains numerous responses, a bewildering number of correlates, and a large list of factors associated with the decision to voting or abstaining (Smets and van Ham, 2013; Wass and Blais, 2017). Many of the causal mechanisms related to these factors are based on Downs’ instrumental voter model (IVM), which stresses the role of the subjective perception of the importance of one’s vote (P), the party differential or personal benefit if the preferred party wins the election (B), and the costs of voting (C). Many others are related to the key alternative explanation, namely the consumption voter models (CVMs), which emphasise the role of factors such as the belief that there is a duty to vote (DV), the will to sustain democracy (SD), or the social pressure to vote (SP).
Take, for instance, amongst many others, a trade union member. Union membership may foster electoral participation because, on top of mobilising the rank-and-file, unions can enhance the perception of the importance of one’s vote by insisting that all votes count (Radcliff and Davis, 2000), magnify the party differential by stressing the differences amongst parties or candidates (Palfrey and Poole, 1987: 511), and lower the costs of voting by facilitating access to political information (Santana and Aguilar, 2019a). Likewise, political interest may increase the predisposition to vote inasmuch as it increases the perceived importance of one’s vote (Rosenstone and Hansen, 1993), the party differential (Campbell et al., 1960; Mueller, 1989: 357), the costs of voting (Santana and Aguilar, 2019b), and duty (Blais, 2000).
However, empirical research testing the IVM at the individual level is scarce and mainly focused on a few advanced democracies. As far as we know, variants of the calculus of voting equation have only been tested with survey data for Canada (Blais and Young, 1999; Blais et al., 1995; Blais, 2000; Blais et al., 2000; Bol et al., 2018), the Netherlands (Santana, 2008, Santana, 2014), and Spain (Lavezzolo et al., 2010; Mata, 2013). Data to test the IVM comes mainly from these countries’ National Election Studies, but also from the Making Electoral Democracy Work datasets, which contain surveys for Canada, France, Germany, Spain, and Switzerland (Stephenson et al., 2018). Some studies have provided supplementary evidence resorting to experiments, as for instance a test of whether people are more likely to vote as the expected payoff increases (Blais et al., 2014), an evaluation of the effects of instrumental and consumptive benefits in California (Panagopoulos, 2013), or another one on the effect of the subjective probability of affecting election results (Duffy and Tavits, 2008).
On top of being scarce, empirical research on the IVM and CVM has more often than not focussed on establishing whether the key factors in those models have a statistically significant effect on the propensity to vote, and how large these eventual effects are. Research aimed at uncovering whether some instrumental or consumption factors have larger or smaller effects depending on the levels of other factors is rare, although some studies have addressed the interaction between factors of the IVM, like the party differential, and the CVM, like duty (Blais and Achen, 2019; Bol et al., 2018). Some research has also been carried out on how the effects of IVM and CVM factors vary in function of institutional factors (Lavezzolo et al., 2010).
In addition, this article undertakes two empirical tests that as far as we know are still lacking in the field of models of voting. On the one hand, it carries out an empirical replication in Latin America, a region in which this type of research simply does not exist, at least at the individual level, perhaps due to the absence of datasets with appropriate indicators of the models. 1 Filling this gap is obviously important because the effects of several factors may differ in more recent democracies that usually elicit lower levels of support. In the following pages, we will thus test the empirical support for IVMs and CVMs in the November 2017 Chilean presidential and parliamentary elections. On the other hand, this article aims at disclosing whether the effects of instrumental and consumption factors vary for individuals with different socio-demographic characteristics. Although similar relationships have been found for other factors, the study of the interaction between socio-demographic characteristics and the factors in the calculus of voting equation remains a second major lacuna in the field, with a few exceptions, such as the studies on whether social pressure affects voting differently for men and women (Matland and Murray, 2016; Weinschenk et al., 2018). We know that different individuals process information differently, and that reasoning is affected by feelings (Lodge and Taber, 2000), prior knowledge (Popkin and Dimock, 2000), and institutions (Lupia and McCubbins, 2000). There are thus good reasons to anticipate that citizens’ socio-demographic traits could condition their responses to instrumental and non-instrumental incentives. For instance, it has been shown that the effects of institutional incentives (like voting facilities) are conditioned by individual level factors in Western European countries (Anduiza, 1999, 2002). Since voting facilities are most likely related to the costs of voting, this suggests that its effect on voting could be conditioned by individual-level factors.
The article is organised into seven sections. Whereas the second is a reminder of the basics of the instrumental and consumption models, the third examines the suitability of the Chilean case. The fourth section presents our hypotheses, and the fifth one, the data and indicators as included in the Chilean survey. The next two sections discuss our empirical results to the questions of whether the IVM and the CVM fare in Santiago de Chile and whether its citizens are similarly responsive to the motivations of each model. The final section briefly concludes. Our main findings are twofold. Firstly, we demonstrate that the IVM works in the same way in Santiago de Chile as in other countries, and its indicators do a fairly good job at explaining the propensity to vote or to abstain; in contrast, the CVM performs quite poorly. And secondly, we show that different citizens respond in heterogenous ways to instrumental and consumption motivations; their effects depend upon citizen’s sex, age, education, and civil status.
The Instrumental and Consumption Voter Models: a Reminder
There are two main strands of research to account for the individuals’ decision to turn out or not: IVMs and CVMs. Instrumental voter models, as outlined in the classic book by Downs (1957) and elaborated by Riker and Ordeshook (1968), Tullock (1968), and more recently Aldrich and Jenke (2017), are an application of rational choice models to the voting decision. Rational choice accounts of political phenomena and, especially so, the IVMs are closely connected with the attempt to apply economic rationality to political science: thus, in his 1957 seminal book, Downs applied this logic not only to the voting decision but also to the concurrence amongst parties, the problem of the acquisition of political information by citizens, or the difficulties posed by retrospective and prospective voting approaches, amongst many others. For orthodox IVMs, voting is intrinsically worthless: it acquires value only as a means or instrument to affect election results. These tenets can be summarised by the well-known voting equation:

where R stands for the net payoff of voting; P, for the probability that one’s vote affects election outcomes (Darmofal, 2010; Usher, 2014); B, for the party differential, or the private benefit that the citizen enjoys if party J instead of party K wins the election (Wang, 2013); and C, for the (net) costs of voting (Fraga and Hersh, 2011; Goodman and Stokes, 2018). In large electorates, P is objectively negligible, so if voting entails costs, purely instrumental citizens should abstain. But, as Copeland and Laband (2002) and many others noted, the ensuing prediction of overspread abstention is systematically contradicted by medium to high levels of electoral participation. This mismatch between the prediction of generalised abstention and actual turnout figures is known as the “paradox of not voting” or the “paradox of voting” (Ferejohn and Fiorina, 1974; Krajina and Prochazka, 2018).
Possibly, the best known attempt to solve the paradox within the rational model rests on the assumption that citizens vote to avoid the regret they would feel if they had stayed at home and their party had lost by one vote (Ferejohn and Fiorina, 1974; Fiorina, 1976). There have been other interesting proposals, such as modelling the decision to vote or to abstain in game-theoretic terms (Battaglini et al., 2010; Palfrey and Poole, 1987). Still, most scholars agree that a proper account of voting cannot be exclusively instrumental.
Consumption voter models construe voting as an end in itself. Citizens vote because they place value on the very (f)act of voting. The key to CVMs is that the benefits of voting are intrinsic, in that they stem from the act of voting regardless of election results. Oftentimes, these intrinsic benefits (customarily labelled as D) are added to instrumental ones (captured by the P*B term). There is no commonly agreed, standardised corpus of dimensions of intrinsic benefits, so the precise form in which the calculus of voting equation is re-written depends on the sources of intrinsic benefits that are considered. One of its most popular roots is citizens’ belief that voting constitutes a social or moral duty, and their will to conform to it (Blais and Achen, 2019; Galais and Blais, 2016; Riker and Ordeshook, 1968: 28). A second one is their belief that voting contributes to sustain democracy, and their resolve to do so (Downs, 1957: 270; Hillman, 2010). Still a third one is their perception of a social pressure to vote, that is, the belief that voting brings about social approval, whereas abstaining elicits censorship (Blais et al., 2018; Dellavigna et al., 2017; Gerber et al., 2016; Gerber et al., 2008, Rogers et al., 2017). Insofar as voting allows to reap the former and avoid the latter, it can be conceived of as having selective social incentives (Knack, 1992), and hence, as a special type of Olson (1971) solution to the collective action problem. Some scholars also point to an expressive value of voting (Fieldhouse, 2018; Hamlin and Jennings, 2011; Panova, 2015; Schuessler, 2000), linked to the drive to express one’s political preferences, and even to a consumptive altruistic term (Aimone et al., 2018; Edlin et al., 2007; Etang et al., 2016; Fowler, 2006).
Why Chile?
With the aid of a brand-new dataset on the 2017 Chilean presidential and parliamentary elections, which incorporates the main indicators of the IVM and CVM, we are able to test them in Santiago de Chile. But this window of opportunity is reinforced by two broad theoretical considerations about the increasing levels of non-voting in Chile and the type of explanatory factors discussed in the Chilean literature about turnout.
Chile fulfils the features that Blais (2006) identified as ideal for having high levels of turnout, that is, it is a medium size country, has the best economic indicators in Latin America, enjoys well-working institutions, and holds highly competitive elections which, since 2005, have been moreover concurrent. However, its turnout levels have decreased almost steadily in the last three decades, from 89 per cent in the 1988 plebiscite to only 46 per cent in the first round of the last 2017 presidential and parliamentary elections – a decline of no less than 39 percentage points. 2 Whilst in the last twenty-five years, turnout has increased in Latin America (PNUD, 2017: 8), Chile became the most abstentionist country in the region (Contreras et al., 2016; PNUD, 2017; Santana et al., 2019).
Most experts point at two factors for explaining the decreasing trend of Chilean turnout: one is institutional, the voluntary registration; the other is socio-demographic, age. Regarding the former, Valenzuela (2004) has qualified it as “the most tortuous registration system,” and Altman and Castiglioni (2018: 111) simply as “perverse.” It was designed by Pinochet’s military regime to discourage the registration of citizens who did not have too much interest in voting. For the 1988 plebiscite for democracy, and contrary to what the leaders of the dictatorship expected, the opportunity to defeat Pinochet led to a massive inscription: no less than 7.5 million Chileans, or 92 per cent of the voting age population. In the following decades, however, Chileans had few incentives to register and therefore to vote. Consequently, about six out of ten of the citizens who in the 1990s came of age to vote, and no less than eight out of ten since the 2000s, failed to register. In 2012, when an electoral reform changed the register from voluntary to automatic, only around 10 per cent of Chileans between 18 and 29 years were registered (Morales et al., 2010: 14). As Luna (2011) claimed, young Chileans were close to becoming an “electorate threatened to extinction.” 3
That young citizens have a problematic relationship with turnout is nothing new. In Latin America, a large study in 17 countries with more than 22,000 cases found that “the demographic characteristics of voters (age and education) […] are strong predictors of electoral participation” (Carreras and Castañeda-Angarita, 2014: 1079). The relevance of age to turnout is related to the habit of voting (Dinas, 2017; Franklin, 2004). Thus, those who go for the first time to the ballot box have a higher probability to vote in the subsequent elections, whereas those who do not cast a vote when they achieve the required age are more likely to become chronic abstainers. Several authors have also documented the positive and significant effect of age on turnout in Chile (Contreras and Morales, 2014; Mackenna, 2015), both before and after the 2012 institutional reform, and the results (analysing different kinds of elections, e.g. presidential, parliamentary, and local) are consistent to the extent that the young have few incentives- and therefore weaker voting habits- to turnout on election day. As emphasised by Corvalán and Cox (2013), “there is no other country where the division between the old and young electorate is as striking as in Chile. For older voters, turnout exceeded, on average, 90 per cent in 2009; for those aged less than 30, it fell below 30 per cent.” 4 (Contreras and Morales, 2014, 2015; Mackenna, 2015).
The Chilean case is also relevant in advancing our knowledge of the motivations for voting. It should prove especially hard to find that socio-demographic individual characteristics condition the effects of IVM or CVM factors on voting. Previous research has repeatedly shown that, with the exception of age, socio-demographic factors did not play a significant role in the propensity to vote in Chile (Guzmán et al., 2015; Contreras and Morales, 2015: 16). This has been at least the dominant interpretation in those elections before the 2012 electoral reform, which brought about a change from a non-automatic registration and mandatory vote to an automatic registration and voluntary vote (Mackenna, 2014, 2015). 5 After the reform, some contributions highlighted that the profile of abstentionists changed: due to the higher levels of inequality in Chile,4 low educated, low social strata and working-class citizens turn out in a lesser extent than those enjoying higher education and belonging to the upper classes (Guzmán et al., 2015). 6 Thus, if the effects of IVM or CVM factors are found to be contingent on socio-demographic traits even in Chile, we should a fortiori expect them to be similarly related in other settings, where socio-demographic characteristics play a stronger role in explaining turnout (Smets and van Ham, 2013).
Two Basic Hypotheses
Consistent with the two related goals of this paper, we will first put forward a hypothesis (H1) regarding the effects of IVM and CVM factors in Santiago de Chile to test how well these models fare there; and then, a second hypothesis (H2), on how the IVM and CVM factors work for individuals with different socio-demographic characteristics. In principle, the arguments of the IVM should apply to Chile in a similar way to those in more established democracies. In the case of the perceived probability that one’s vote affects election outcomes, as in the advanced democracies where Downs’ model has been tested, its objective value should be low. Therefore, its effect on voting should largely rest on the magnitude of its overestimation, which is likely to be similar in Santiago de Chile.
Moreover, the large ideological differences amongst parties in Chile should imply especially strong (positive) effects of the party differential and regret (Luna, 2008). 7 However, the low levels of party identification and high levels of mistrust in parties (Luna and Altman, 2011), as well as the difficulties of the Chilean party system to incorporate the demands from the society (Morgan and Meléndez, 2016), should work in the opposite direction. Hence, on balance, we expect party differential (and regret) to have similar effects in Santiago de Chile to those found in advanced democracies. As to the costs of voting, considering that registration was automatic in the 2017 elections (Cox and González, 2016), it is plausible to believe that for most Chileans the costs of voting were, as in most advanced democracies, moderate or low.
Finally, although the direction of the effects of the factors of the CVM should be similar in all countries, their magnitude possibly depends largely on the level of support for democracies. Given that the fraction of those who consider democracy to be the best political system is lower in Chile than in longer established democracies (Castiglioni and Rovira Kaltwasser, 2016; Santana et al., 2019), it makes sense to expect that duty to vote, sustain democracy, and social pressure will have smaller effects (if at all) in Chile than in the cases where the CVM has been tested. Thus, considering all the former arguments, we formulate our first hypothesis:
Let us now turn to the relationship between IVM and CVM factors, on the one hand, and socio-demographic variables, on the other. It makes sense to expect that the potential benefits of voting, whether instrumental or not, will be especially influential in driving those individuals to the polls who might otherwise be more likely to abstain; a similar argument would apply to the costs. Electoral research has shown that also in Chile younger individuals vote less than older ones (Contreras and Morales, 2014), partly due to an age effect and partly to a cohort effect, as the cohorts who voted in the 1988 Plebiscite vote more than the subsequent ones (Bargsted et al., 2019); and that those who are female, less educated, and not married vote less than their counterparts – men, higher educated, married (Montero et al., 2019). 8 We may thus expect, for instance, that the effect of the perceived probability that one’s vote affects election outcomes should be larger for women. More generally, our second hypothesis reads as follows:
Data and Methods
As already said, to test our hypotheses we will utilise a post-election survey undertaken after the 2017 Chilean presidential and parliamentary elections and carried out by the Faculty of Government, Universidad del Desarrollo, Santiago (UDD, 2018). The survey consists of four hundred and eighty-nine face-to-face interviews undertaken in January 2018, shortly after the second round of the presidential elections. It covers a representative sample of 23 out of 32 comunas, or administrative units, of Santiago; the sampling is probabilistic with a random selection of households and interviewees; for a confidence level of 95 per cent, the margin of error is ±4.36 per cent. Although it is broadly representative of the population of Santiago in socio-demographic terms, weights have been applied in all the statistical analyses so as to further guarantee the representativeness also in terms of voter turnout.
Following the standard practice, the dependent variable, which originally distinguished amongst four types of abstention (could not vote, did not want to vote, usually votes but this time did not want to, and usually votes but this time could not do so), has been coded as binary (1 = voted, 0 = abstained). Consequently, binary logistic models have been estimated to uncover the effects of independent and control variables upon voting.
The UDD survey includes indicators for the subjective probability of affecting election results (“so many people vote, that my vote does not affect electoral results”); regret (“I would have felt badly if I had not voted and my preferred candidate had lost by just one vote”); perceived costs of voting (“voting costs me a lot of effort”); agreement with the idea that voting contributes to sustain democracy (“voting contributes to sustain democracy”); and perceived social pressure to vote (“my family, friends and acquaintances would look down on me if I did not vote”). Originally, they were all four-item ordinal scales (strongly agree, agree, disagree, or strongly disagree) and have been recoded as binary (1 = high, 0 = low). Reasons are twofold: because of the relatively low sampling size and because it allows to enhance the comparability of our results with those of most extant research, which has generally employed a dichotomous categorisation as well. The survey includes also an indicator for the belief that voting is a duty (“for some people voting is a right that may be excercised or not, and for others it is a duty”), which is binary from the outset (1 = a duty, 0 = a right). Given that no question was directly asked to uncover the size of the perceived party differential, this concept has been proxied by the closest available alternative, namely whether interviewees acknowledged feeling identified with a party (“could you tell me whether you feel close to any political party or coalition?” 1 = yes, 0 = no) ‒ the assumption being that those who feel identified experience a larger party differential than those who do not.
Also following the standard practice in electoral research (Smets and van Ham, 2013), models have been tested that include four socio-demographic variables which could affect the tendency to vote or to abstain. They are sex (binary: 1 = woman), age (captured by an ordinal variable with six intervals), education (given the low number of those who only have primary education, a binary variable has been used, which tells apart those who enjoy higher education, coded as 1, from those who do not, coded as 0), and civil status (originally a nominal variable with five options: married, divorced, separated, widow/er, and single; recoded as binary: 1 = married). On top of variables of the IVM and CVM, only socio-demographic controls are considered; hence, variables such as ideology and political interest do not form part of any of the models. All the variables can be simultaneously included in the model without arising collinearity problems: the highest correlation amongst them is 0.45; the highest variance inflation factor (VIF), 1.58, and the mean VIF, 1.24. Table 1 presents the descriptive statistics (observations, mean, standard deviation, minimum, and maximum), as well as the VIFs of the variables.
Descriptive Statistics of the Independent and Control Variables
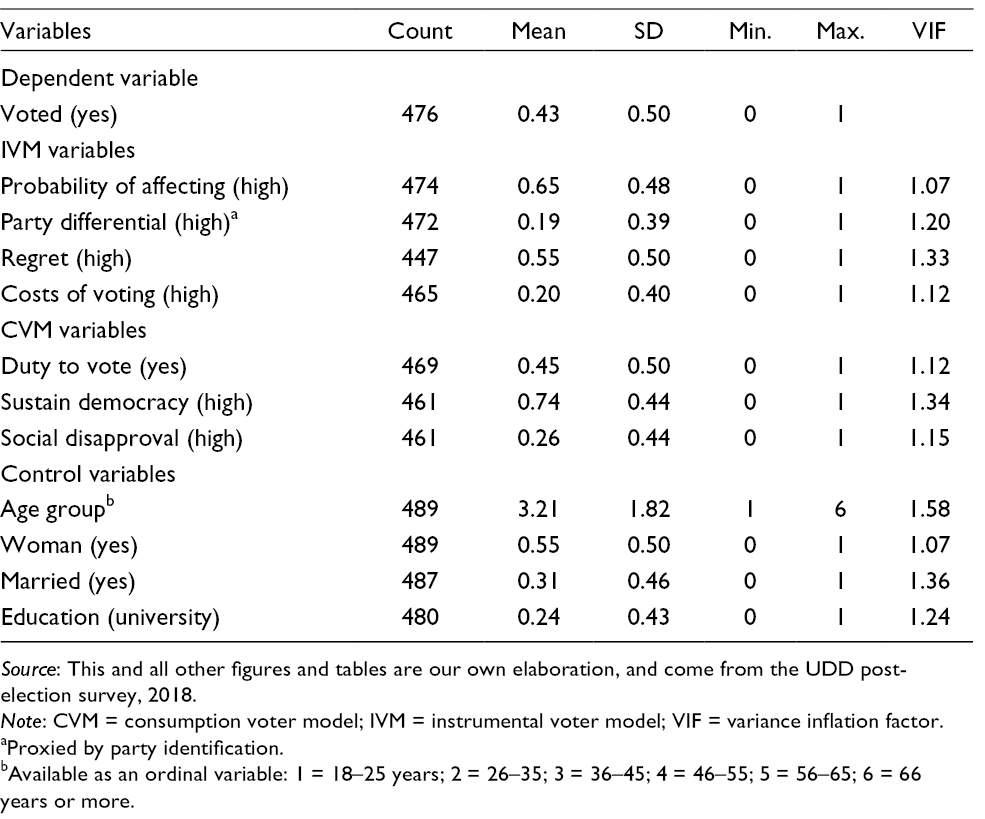
Source: This and all other figures and tables are our own elaboration, and come from the UDD post-election survey, 2018.
Note: CVM = consumption voter model; IVM = instrumental voter model; VIF = variance inflation factor.
aProxied by party identification.
bAvailable as an ordinal variable: 1 = 18–25 years; 2 = 26–35; 3 = 36–45; 4 = 46–55; 5 = 56–65; 6 = 66 years or more.
Although the majority of articles in the top social sciences journals still get it wrong (Mize, 2019), methodologists and statisticians have demonstrated that regression coefficients are not useful for evaluating interactive hypotheses when the dependent variable is binary or, more generally, qualitative (Mustillo et al., 2018). The correct approach was pioneered in the social sciences by Ai and Norton (2003) and Norton et al. (2004). Following their advice and the strategies advocated by Mize (2019), and making use as well of the SPost 13 command (Long and Freese, 2014), we employ a graphical approach to discuss the results of our interactive hypotheses. Naturally, in all the interactive models we include all the constitutive terms as well as the interactive one, since failing to do so would open the possibility of obtaining biased estimations (Brambor et al., 2006).
How Well Do the IVM and CVM Fare in Santiago De Chile?
Figure 1 is a coefficient plot showing the results of a battery of models that consider alternative specifications of the calculus of voting equation. For each variable, the point represents the best estimation of its effects on voting; the horizontal line, the confidence intervals associated with that estimation. When the confidence intervals cross the vertical line, the variable is not statistically significant. Model 1 (IVM) only includes instrumental motivations: the subjectively perceived probability of affecting election results (P), the proxy for the party differential (B), the regret if the citizen abstained and her preferred party lost for only one vote, and the cost of voting (C). Model 2 is a purely consumptive model, including duty to vote, sustain democracy, and social disapproval (as well as C). Model 3 includes both types of motivations, and Model 4 adds the four socio-demographic variables: woman, age (treated as a quantitative variable; results remain qualitatively unaltered if age is treated as ordinal; see below), education, and married. Consistent with H1, the sign of the effects of the perceived probability of affecting election results, the party differential, regret, duty, sustain democracy, and social pressure are positive in all models, whilst that of the cost of voting is consistently negative. Except for the party differential, all the variables of the IVM are statistically significant (at the 5 per cent level) in all models. Duty to vote is never significant- this may be due to the recent institutional change from compulsory to voluntary voting (Guzmán et al., 2015); in the Chilean case, questions trying to measure the duty concept are not comparable to those asked in other countries, since interviewees may understand that they are being asked about the new legal standing of voting instead of about the existence of a social or moral obligation to vote. The other two variables of the CVM, sustain democracy and social pressure, are only significant in Model 2, but fail to be so when those of the IVM are also included. This is, again, consistent with H1, in that we expected much weaker effects of the IVM in Santiago de Chile, given its relatively lower levels of democratic support. Finally, as to the socio-demographic controls, notice that sex and civil status fall short of statistical significance, whereas education and age significantly increase the likelihood of voting.
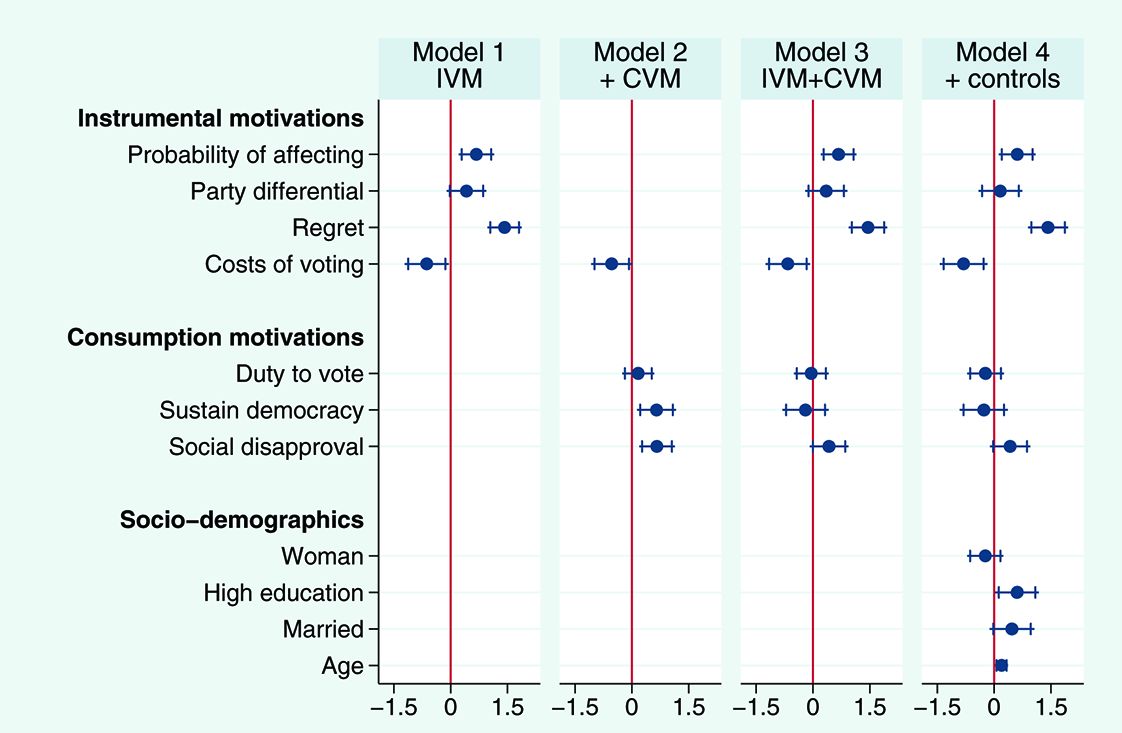
Coefficient Plot for the Effects of Instrumental and Non-Instrumental Motivations on Voting in Santiago de Chile, 2017.
Figure 1 informs us about the signs and statistical significance of the effects on voting of each variable in the models. But, given that the dependent variable (voting) is binary, the magnitudes of the estimated coefficients tell us little about substantive questions such as the relative strength of the effects of each independent variable. To remedy this, Figure 2 displays the average marginal effects (AMEs) on the probability of voting of each variable for the full model, as well as for an additional model in which we treat age as an ordinal variable. The AMEs are calculated as follows: for each observation of the dataset, they firstly estimate the marginal effect of a given variable (holding all other independent variables constant) on our dependent variable (voting), and then they average the marginal effects for all the observations calculated in the previous step. Intuitively, the AMEs compare the probability of voting between two populations that only differ in one trait (i.e. being male or female), but share all the remaining characteristics (Williams, 2012).
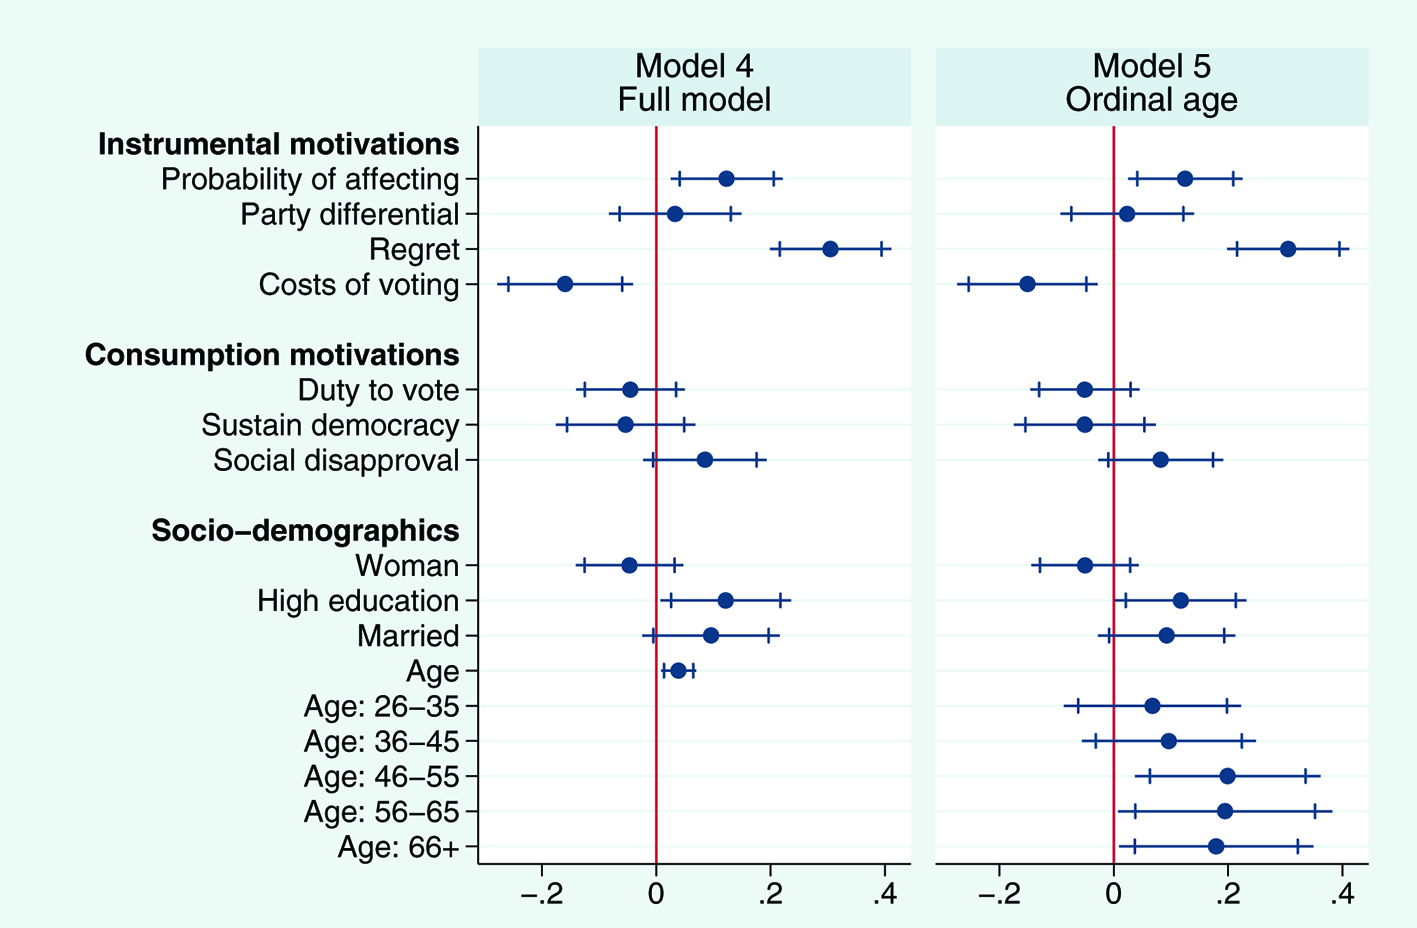
Average Marginal Effects of Instrumental and Non-Instrumental Motivations on Voting in Santiago de Chile, 2017.
The comparison of Models 4 and 5 in Figure 2 confirms that the effects of the independent variables are almost equal when we treat age as quantitative to those found when we consider it ordinal. Moreover, it shows that regret has a very large effect, slightly above 0.3. Hence, controlling for all the other variables, regret would be responsible for a change of about 30 percentage points in the probability of voting. The other two statistically significant variables, the perceived probability of affecting election results and the cost of voting, have more moderate and rather similar effects, ranging from 12 to 16 percentage points. Thus, instrumental benefits (as captured by the perceived probability of affecting election results and regret) have more weight on the voting decisions in Santiago de Chile than the cost of voting, and consumption benefits (duty, support democracy and social pressure) do not have any (statistically significant) weight at all.
Interestingly, as Model 5 in Figure 2 shows (the one where age is treated as ordinal), the second largest effects are associated with age: whilst those younger than 46 do not significantly differ from under-26-year-olds, those older than 45 exhibit a probability of voting between 18 and 20 percentage points higher. The salience of age in Santiago de Chile is probably due to the effects of its institutional rules until 2012, which combined voluntary registration and compulsory voting amongst those previously registered, therefore inhibiting registration and substantively reducing the electoral participation amongst younger cohorts.
In turn, Figure 3 displays the predictive margins of the probability of voting for each of the three variables in the calculus of voting equation that significantly affect the propensity to vote (the perceived probability of affecting election results, regret, and the cost of voting, as shown in Model 4). For each variable, the predictive margins are calculated holding all the other variables constant at their means. The probability of voting for those who think that their vote does not affect election results (i.e. that P is low) is 40 per cent, but it goes up to 53 per cent amongst those who believe that their vote can have an influence (i.e. that P is high). As we already know from Figure 2, the probability of voting changes most notably with regret; now we can see that it doubles from 31 per cent amongst those who would not regret having abstained if their party lost by only one vote and mounts to a full 62 per cent amongst those who would regret it. Finally, it drops from 51 per cent when the cost of voting is low to 35 per cent when it is high. Results are almost equal if the predictive margins are computed on the basis of Model 5.
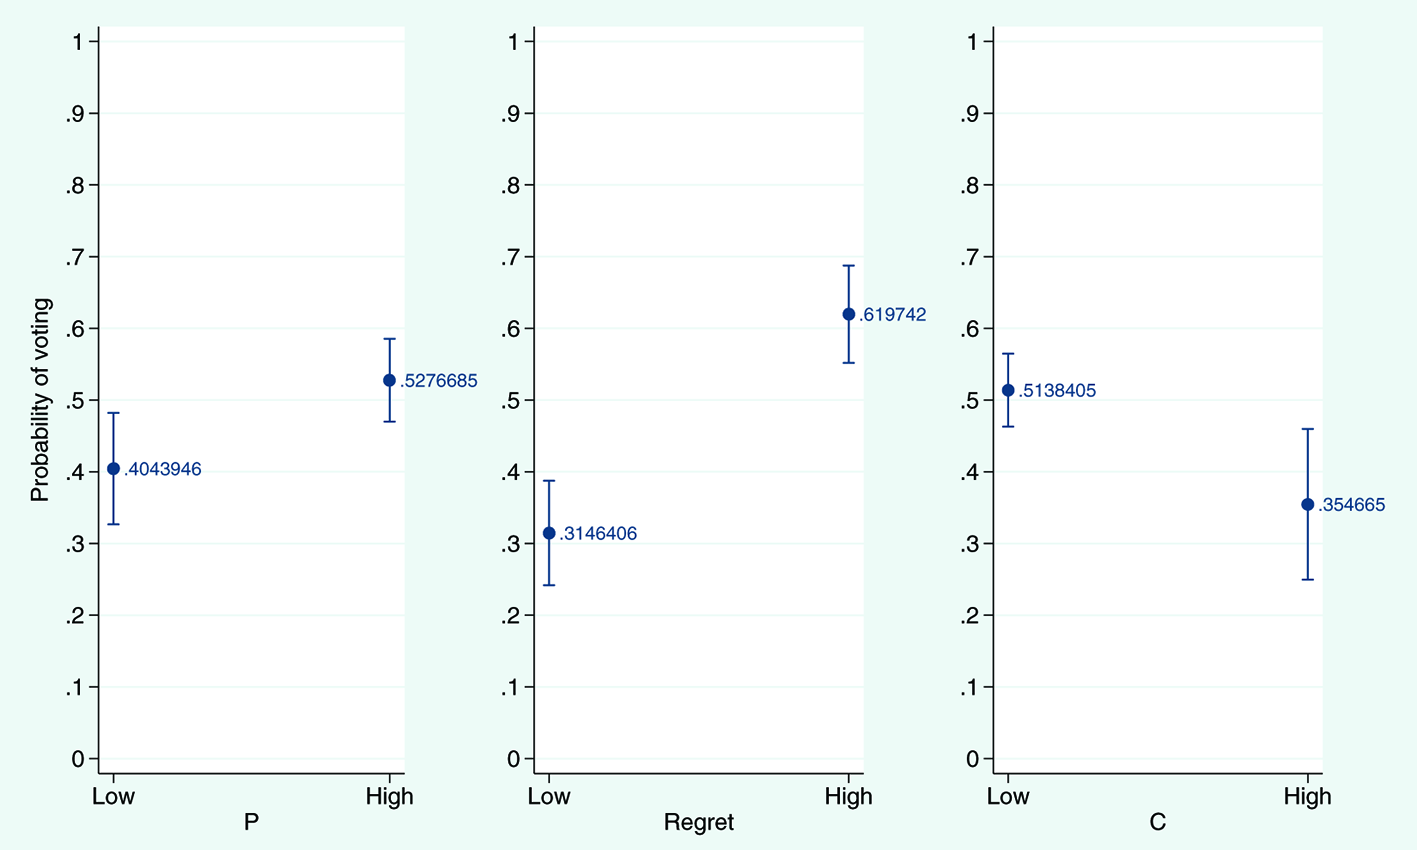
Predictive Margins of Voting as a Function of the Perceived Probability of Affecting Election Results, Regret, and Cost of Voting in Santiago de Chile, 2017
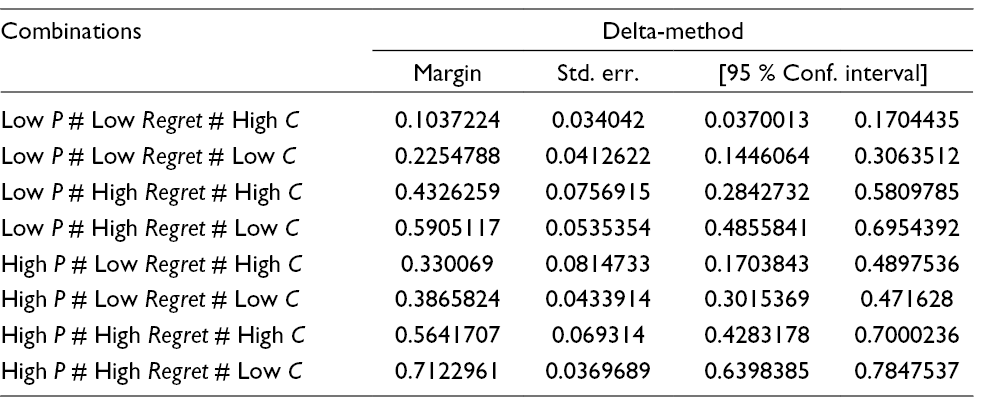
Table 2 shows the predictive margins of voting for each possible combination of the three variables that have turned out to be significant in the previous models – the perceived probability of affecting election results, regret, and the cost of voting. It shows that, considered together, these three variables of the IVM allow to explain changes in the predicted probability of voting ranging from roughly 0.10 (when the perceived probability of affecting election results and regret are low, and the cost of voting is high) to 0.71 (when the perceived probability of affecting election results and regret are high, and the cost of voting is low). Thus, these variables can account for differences of 60 percentage points in the probability of voting.
Predictive Margins of Voting for Combinations of Values of P, Regret, and C in Santiago de Chile, 2017
Are All Citizens Similarly Responsive to Instrumental and Non-Instrumental Motivations?
Figure 4 illustrates the interactive effects on voting of IVM or CVM variables and socio-demographic ones. To be more precise, it shows that the average marginal effects of IVM or CVM variables on voting depend on the levels of socio-demographic variables. An advantage of using AMEs is that they are not affected by unobserved heterogeneity that is unrelated to the independent variables (Mood, 2010). Of the twenty-eight potential interactions, nine display interesting interacting patterns. In other words, the effects of an IVM or CVM variable on voting vary in function of the values of a socio-demographic variable; Figure 4 only shows these.
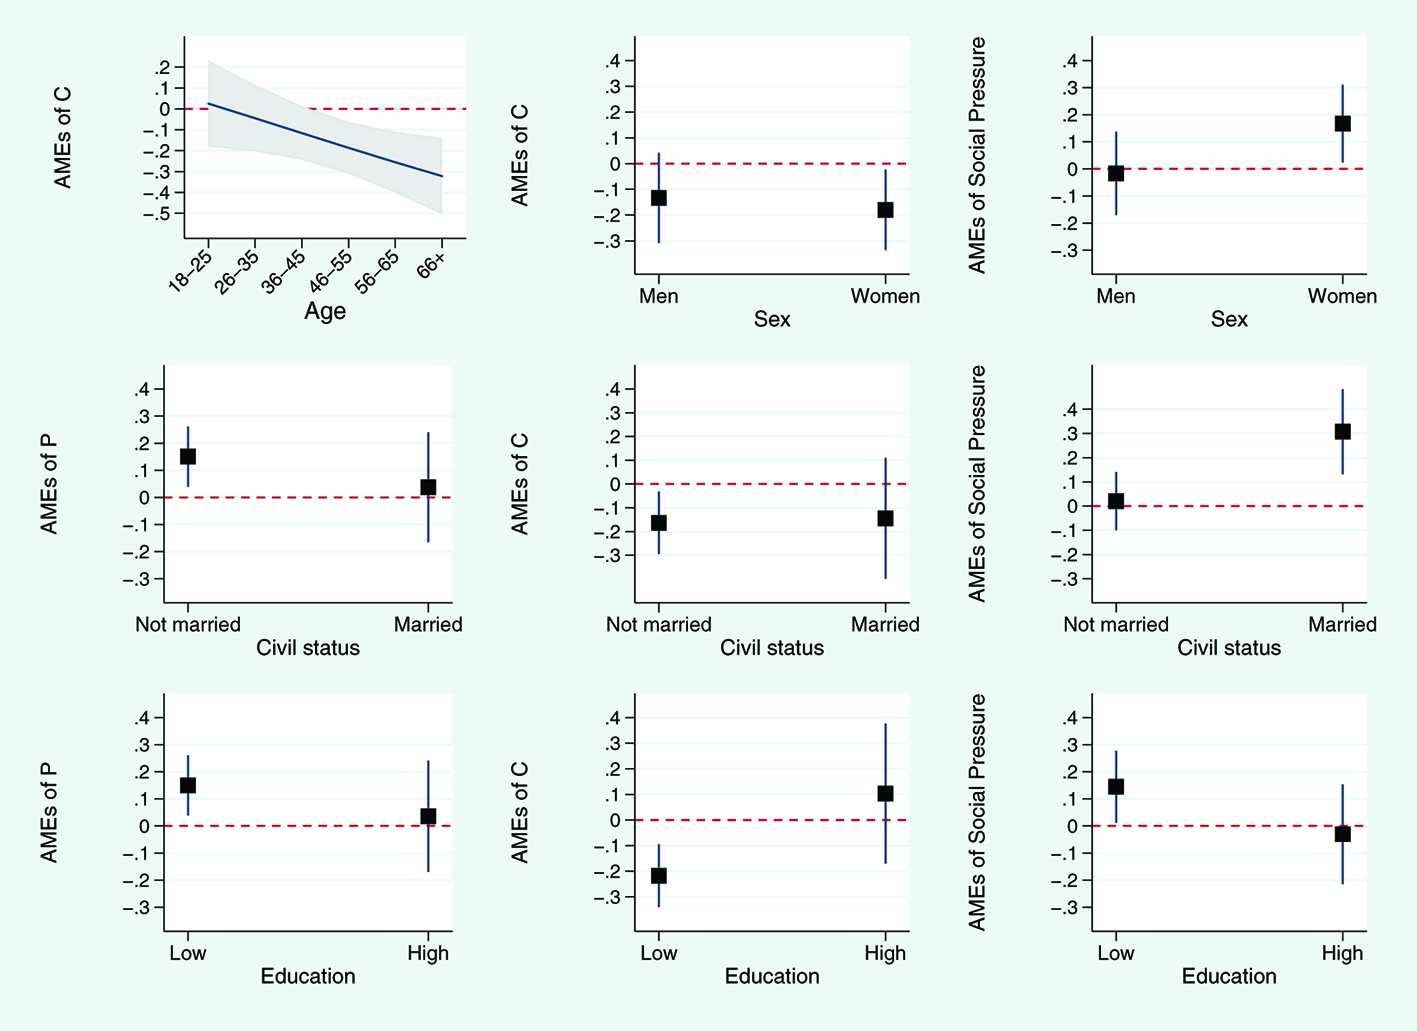
Average Marginal Effects of Instrumental and Non-Instrumental Motivations on Voting Depending on Socio-Demographic Factors in Santiago de Chile, 2017
The upper left panel of Figure 4 shows the average marginal effects of the cost of voting for the six age groups. Leaving aside the youngest individuals, for which the effect is close to zero, the effect of the cost of voting is consistently negative, and its magnitude increases markedly with age. Thus, whilst perceiving high instead of low costs of voting only depresses by 4.5 per cent the turnout of those in the 25–36 age group, this figure rises to 18.7 per cent for those in the 45–56 age group, and up to 32.2 per cent for those aged 66 or over. According to this, the (average marginal) effect of the cost of voting becomes statistically significant for the individuals in the 46 to 55, 56 to 65, and 66-plus age groups. That is to say, the cost of voting starts having a significant (and negative) impact on voting from 46 years on. This result is consistent with the idea that, from a certain age threshold, the costs of going to the polls will become increasingly onerous and shall therefore reduce the propensity to vote accordingly (Wass et al., 2017). 9
The central and right-hand side upper panels in Figure 4 show the two variables of the IVM and CVM that work differently depending on the sex of the citizen: the cost of voting and social pressure. In both cases, their effects have the expected sign for both men and women (the cost of voting has a negative effect, and social pressure a positive one), but they are only statistically significant for women. The next three graphs, that is, those below the upper panel, show the three variables whose effect on voting varies depending on the civil status of the respondent: the perceived probability of affecting election results, the cost of voting, and social pressure. The positive effect on voting of the perceived probability of affecting election results and the negative effect of the cost of voting are only statistically significant for those who are not married; however, the positive effect of social pressure is statistically significant only amongst those who are married.
Finally, the lower panel in Figure 4 shows the three variables for which the interactions with education display a noteworthy pattern: the perceived probability of affecting election results, the cost of voting, and social pressure. The left-hand side graph shows that the positive effect of the perceived probability of affecting election results on voting is restricted to those with low education; the central panel shows that the negative effect of the cost of voting is likewise constrained to the lower educated; and the right-hand side panel shows that the positive effect of social pressure is, as the other two, circumscribed to those without higher education.
Table 3 summarises the results on the intertwinement between the effects on voting of IVM or CVM variables, on the one hand, and socio-demographic ones, on the other. As formulated in H2, we expected weaker effects amongst older citizens, but we find instead stronger (negative) effects of the cost of voting. Our expectations and the evidence regarding sex are consistent; the (negative) effects of the cost of voting are only significant amongst women, as are the (positive) effects of social pressure. Also, our expectations of weaker effects amongst those who are married are supported by our findings, since the perceived probability of affecting election results and the cost of voting only have statistically significant effects amongst those who are not married. Yet, running at odds with our expectation, social pressure only has effects on voting for those who are married. Finally, we expected weaker effects for those who have high than for those who have low education and, consistently with our expectation, the perceived probability of affecting election results, the cost of voting, and social pressure only have significant effects on voting for those with low education.
Summary of Interactions amongst Individual Characteristics and Voter Models in Santiago de Chile, 2017
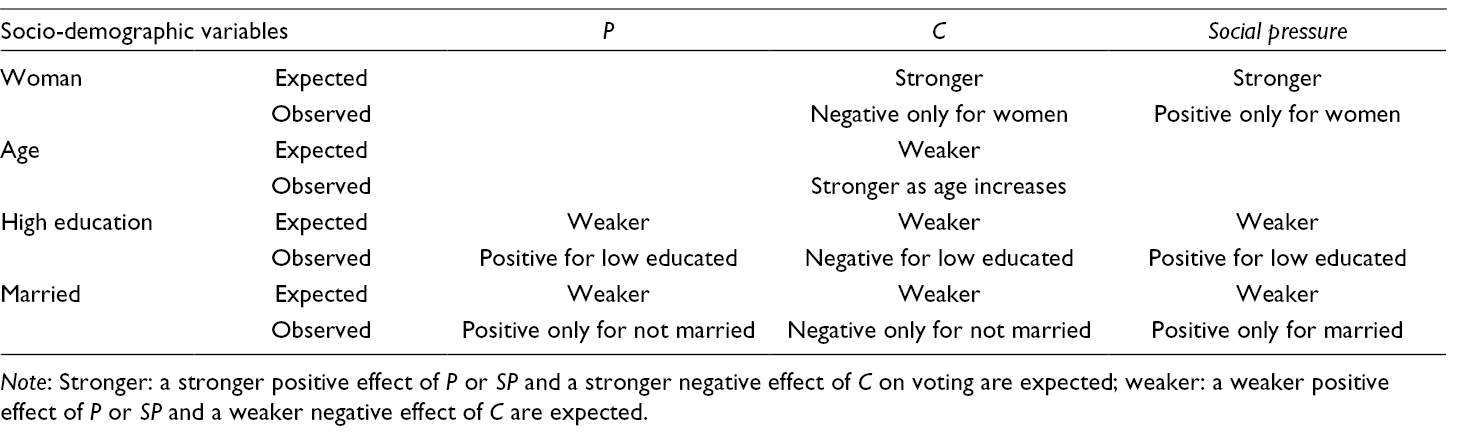
Note: Stronger: a stronger positive effect of P or SP and a stronger negative effect of C on voting are expected; weaker: a weaker positive effect of P or SP and a weaker negative effect of C are expected.
Conclusions
Although very influential worldwide, but particularly in the US political science scene, both the instrumental and consumption voter models (IVM and CVM, respectively) have many critics that have stated some limitations (Green and Shapiro, 1994). Moreover, the scarcity of empirical tests makes it difficult to clarify the extent to which these models are useful to understand voters’ decisions in different settings. As Maravall and Sánchez-Cuenca (2008: 2) put it, “although formal modeling has reinvigorated the theory of democracy and defined the relevant questions in a sharp and rigorous way, we still have some reservations about its empirical relevance.” In relation to this, it may be argued that, if the instrumental and consumption voter models are sound, they should apply in every democratic context. Put differently, if the hypotheses are solid, they should travel. Similar claims have been repeatedly advanced by other authors in comparative works. 10 Using a post-election survey of the 2017 Chilean national elections with adequate indicators, we have reassessed the instrumental and consumption voter models in Santiago de Chile. To our knowledge, it is the very first time that this exercise has been undertaken in a Latin American context with a full array of instrumental and consumption variables. The immediate question is whether the extension to other polity of the empirical findings obtained in Western democracies could be taken for granted or not.
Our answer is mixed. Our results show that the IVM travels well to Santiago de Chile, but the CVM does not. In particular, we find statistically significant effects for three out of four variables of the IVM: the probability of being pivotal (P), the regret a voter would have if he/she abstained and his/her party lost by only one vote, and the costs of voting (C); only the party differential, B, fails to attain statistical significance. In contrast to this, none of the variables of the consumption voter model (the belief that voting is a duty, the will to sustain democracy, and the perception that there is social pressure to vote) are significant.
The failure of the consumption voter model calls for further reflection and opens the door for more research. The irrelevance of the CVM factors is especially striking in the case of duty to vote, one of the key factors in the voting literature. The absence of significant effects may have to do with the fact that the measures used in this paper may be capturing different concepts in earlier studies (as those in Canada, the Netherlands, and Spain) than in Santiago de Chile. In the former, they are related to the belief that there exists a social or moral duty to vote. In the latter, they may uncover perceptions on the legal status of voting, given that this status had changed from compulsory to voluntary voting in the 2012 electoral reform, together with registration, which changed from voluntary to automatic. Does this mean that duty works differently in countries where voting has always been voluntary, where it has always been compulsory, and in countries that have switched from a voluntary to a compulsory system or vice versa? We certainly need more research on this. More generally, the lack of significance of all the CVM variables is possibly related to the fact that more than 25 per cent of Chileans were indifferent amongst a democratic or an authoritarian regime or even preferred the latter. 11
We have also sought to advance our general knowledge on the working of the IVM and CVM by inquiring on how the effects of the factors of these models vary for individuals with different socio-demographic characteristics. This is also a novel inquiry. Scholars have so far focussed the bulk of their attention on whether these factors are significant or not and on how large their effects are, but efforts to determine what factors condition the existence or size of such effects are extremely rare, at best. We show that citizens do not respond in a unanimous, synchronised, and similar way to the instrumental and consumption motivations facing them. Individuals of different sex, age, education, and civil status display different sensibilities to both instrumental motivations (for instance, P matters only for those who are not married), and consumption ones (for instance, social pressure matters only for the low educated), as well as for the costs of voting (e.g. their effect is larger for older citizens).
Footnotes
Appendix
Acknowledgements
We would like to express our gratitude to Eugenio Guzmán and Rodrigo Arellano, Facultad de Gobierno, Universidad del Desarrollo, Santiago (Chile), for making us available the data of the survey they carried out after the November 2017 Chilean presidential election. We are also grateful to the participants in the “It’s My Party and I’ll Vote if I Want To: Parties and Political Participation” panel at the 77th Annual Midwest Political Science Association Conference held in Chicago in April 2019 as well as to two anonymous reviewers of the JPLA for their valuable comments.
Declaration of Conflicting Interests
The authors declared no potential conflicts of interest with respect to the research, authorship, and/or publication of this article.
Funding
The authors received no financial support for the research, authorship, and/or publication of this article.
Notes
Author Biographies
E-mail:
E-mail:
E-mail: