
Abstract
This paper analyzes the relationship between malapportionment and electoral bases of support for Brazilian senators. The conventional wisdom asserts that malapportionment contributes to the “politics of backwardness” – that it facilitates clientelism and hinders issue-based campaigns, reducing electoral competition and producing geographically concentrated patterns of votes. Our study partially confirms, yet partially refutes this wisdom. Our research indicates that malapportionment affects the competitiveness of elections: senators from overrepresented states tend to dominate their key municipalities electorally, whereas senators from underrepresented states tend to share their core municipalities. In addition, overrepresentation reduces the likelihood that leftist candidates will be elected. These findings are consistent with the traditional understanding. However, contrary to the conventional wisdom, we find that senators from underrepresented states tend to exhibit geographically concentrated patterns of electoral bases, whereas those from overrepresented areas show much more scattered bases of support. Hence, our findings suggest that the relationship between malapportionment and elections may be more complex than commonly acknowledged.
Introduction
Thanks to the richness of the data and theoretical and methodological sophistication of Latin American legislative research, over the last decade we have accumulated a considerable amount of knowledge about executive– legislative relations, legislative processes, and behavior of legislators and legislative parties in Latin American countries. However, most of these studies have focused on the lower houses of bicameral legislatures or on unicameral congresses. With a few exceptions (for example, Crisp and Ingall 2002; Llanos and Sánchez 2006; Hiroi 2008a, 2008b; Lemos 2008; Neiva 2011), research on bicameralism or the upper house in the region is rare. Yet many Latin American countries, especially larger ones including Brazil, Mexico, Argentina, Colombia and Chile, have bicameral legislatures, some of which with quite “strong” upper houses. Clearly, it is imperative to understand the rules, procedures, and practices of these second houses and the members that comprise these bodies in order to further our understanding of legislative politics and institutions.
This paper contributes to this understudied yet crucial area in Latin American legislative research by examining geographical patterns of electoral votes for Brazilian senators. Geospatial patterns of electoral votes for Brazilian deputies have been well studied and documented (Ames 1995, 2001; Carvalho 2003); however, to our knowledge no such study has been conducted on Brazilian senators. In this paper, we look into both the level of electoral support Brazilian senators enjoy in each municipality in their states and their spatial relationships, as well as the extent of support that senators receive state-wide. We will explore whether and to what extent personal, political, geographical and socioeconomic attributes influence the location and the level of electoral support for Brazilian senators.
Understanding the spatial distribution of electoral support for the senators is important for various reasons: For one, such knowledge can help us understand the workings of the house that they occupy. Its importance only intensifies when we take into consideration the powers and features of the Brazilian Senate. The Brazilian Senate is one of the most powerful in the world (Neiva 2006) with considerable territorial and federative characteristics. Such traits are evident in its representational and constitutional features and prerogatives, such as its highly malapportioned representation and its prerogative to determine in exclusivity the external debt that state and local governments are allowed to contract. Senators are also a distinct group of political actors because they are political elites: many of them have already held key public offices before, including such positions as mayors, federal deputies, governors, vice-governors, ministers, and even presidents and vice-presidents of the nation (Llanos and Sánchez 2006).
Fundamental in the study of senatorial elections is malapportionment, or disproportionality between the allocation of seats and population size, which causes some states (or electoral districts) to be overrepresented and others to be underrepresented given their relative population size. 1 The Brazilian Senate is one of the most malapportioned legislative bodies in the world, second only to the Argentine Senate (Mainwaring 1999; Samuels and Snyder 2001). Scholars have argued that malapportionment will lead to overrepresentation of politically conservative rural interests and agricultural sectors at the detriment of urban, progressive interests (Samuels and Snyder 2001).
Strictly speaking, malapportionment is an institutional characteristic while over- or underrepresentation is a characteristic of the constituent electoral district. In this paper, we use these terms interchangeably following the practice in the literature (Lee and Oppenheimer 1997, 1999; Gordin 2010).
In Brazil, this disproportionality in representation occurs due to the constitutional provision establishing equality of representation among states in the upper house of the congress, with each unit of federation having three representatives regardless of population size, resulting in the overrepresentation of less populated states and underrepresentation of more populous states. We find the largest distortions when comparing the state of São Paulo – the most populous state, with 22 percent of the national electorate in 2010 – with Roraima and Amapa, the least populous states with 0.2 percent and 0.31 percent of the voters, respectively. By our calculation, in 2010 it was necessary to win 10,100,466 votes, on average, to be elected to the Senate from São Paulo. In contrast, to be elected a senator from Roraima, one needed only 90,630 votes, and in Amapa, 140,266 votes. This means in effect that a Roraimense's vote was worth 111 times more than a Paulista's vote, violating the democratic principle of equality in voting. Indeed, the disproportionality in the Brazilian Senate is greater than the well-known case of the United States Senate, where a senator from the least populous state, Wyoming, represents approximately 69 times more voters than a Californian senator (Mayhew 2009).
In the United States, some scholars have demonstrated that malapportionment in the U.S. Senate favors rural and conservative regions with respect to civil rights and racial questions (for instance, Lee and Oppenheimer 1999; Griffin 2006). Recent studies on the Brazilian Senate also show that malapportionment has important consequences. For example, senators from smaller states, which altogether have only 15 percent of the national population, hold enough seats to form a majority in the Senate, with the ability to veto any legislation (Backes 1999). Malapportionment is also linked to the support the Senate gives to executive initiatives. Neiva and Soares (2010) discovered that senators from overrepresented states tend to support presidential agendas more than senators from underrepresented states do.
The aforementioned studies investigate the impact of malapportionment on legislative processes and outcomes. In this paper, we examine the ways in which malapportionment influences the election of senators. Does disproportionality between seats and population size affect patterns of electoral campaigns and bases of support for senators? If so, to what extent does malapportionment affect the degree to which senators electorally dominate or share their key municipalities and the spatial distribution of their bases of support?
The conventional wisdom in Brazil and in comparative politics in general is that malapportionment contributes to the “politics of backwardness”; it is said to facilitate clientelistic politics and hinders issue-based campaigns, reducing electoral competition and producing geographically concentrated patterns of votes. Our study partially confirms yet partially refutes this wisdom. Our research indicates that malapportionment affects the competitiveness of elections and representation: senators from overrepresented states tend to dominate their key municipalities electorally and receive most of their votes from fewer municipalities, whereas senators from underrepresented states tend to share their core municipalities. In addition, overrepresentation reduces the likelihood that leftist candidates will be elected. These findings support the conventional wisdom. However, contrary to the traditional understanding, we find that senators from underrepresented states tend to exhibit geographically concentrated patterns of electoral bases, whereas those from overrepresented areas show much more scattered bases of support. Hence, our findings suggest that the relationship between malapportionment and elections may be more complex than commonly acknowledged and that more research is needed to unravel this question.
Elections and Malapportionment
Scholars of comparative and Brazilian politics have argued that malapportionment hinders the development of “modern” politics. By making programmatic electoral campaigns less appealing and less successful, and by making clientelism and patronage a more viable electoral strategy for politicians, malapportionment is thought to diminish competitiveness of elections and lead to geographically concentrated patterns of electoral support.
Such hypotheses find justifications in various studies. For example, prior research has shown that the heterogeneity of a political community and the diversity of interests within it increase as the size of the political community itself increases (Dahl and Tufte 1973; Abramowitz 1988; Black 1974; Hibbing and Brandes 1983; Madison 1787). In their study of senatorial elections in the United States, Lee and Oppenheimer (1997, 1999) contend that malapportionment (or overrepresentation) reduces the competitiveness of elections for the U.S. Senate. This is because the diversity of voter interest in the district increases with the size of the electorate, and where voter interest is diverse, it is difficult to satisfy all the voters in the state, inducing electoral competition. In contrast, the relative absence of diversity in smaller districts hinders electoral competition. Similarly, Abramowitz (1988) argues that electorate size and the mode of electoral strategy are related: in highly populous districts, personal contact with voters becomes an impractical electoral strategy, raising the importance of the media for effective campaigning. Mass media–based campaigns in turn expand the reach of the candidate to all corners of the district, generating dispersed patterns of electoral support.
The question of malapportionment and its consequences has also attracted substantial interest in Brazil. Prior studies have asserted the predominance of “backward” politics in poor and rural regions, exhibiting modes of relationships commonly known as clientelistic, parochial, oligarchic, traditional and non-ideological. In these areas, conservative parties are strong and traditional politicians enjoy captive votes based on clientelism. On the other hand, “progressive” politics is the name of the game in urban, industrialized regions, where “progressive” voters would vote based on ideological, programmatic considerations (Avelar and Walter 2008; Britto 1965; Carvalho 2009; Leal 1949; Mainwaring 1999; Soares 1973a, 1973b; Souza 1976; Tavares 1995).
In his classic work, Soares (1973a) argues that malapportionment actually hurts the majority of those who reside in the overrepresented areas by artificially elevating the representation of the traditional, backward political culture held by local political leaders and rural agricultural elites. According to Soares:
By elevating the political power of the elite representing rural, traditional and pre-ideological political culture, and by overrepresenting – in both Congress and the Senate – the interests of this area, which is economically, socially, and politically underdeveloped, the probability that reforms benefiting the majority of the rural population living in these areas will be approved by Congress is diminished (Soares 1973a: 27–28; authors’ translation).
According to Soares (1973a), two types of politicians exist: coronéis, who represent backward and non-ideological politics, elected with captive and concentrated votes, and ideológicos, elected through votes scattered across their states. Although this proposition has been widely held as true, a few subsequent empirical studies have presented disconfirming evidence, finding that many federal deputies from more urban, underrepresented states were elected with votes that were geographically concentrated (Fleischer 1974, 1981; Indjaian 1981; Dias 1991; see also Ames 2001).
Carvalho (2003) analyzes the spatial distribution of votes received by Brazilian federal deputies in the 1994 and 1998 elections. His study reveals that the centrist, catch-all PMDB (Partido do Movimento Democrático Brasileiro) and the conservative, right-wing PFL (Partido da Frente Liberal) and PPB (Partido Progressista Brasileiro) had more fragmented and dominant electoral bases compared to the more ideologically left PT (Partido dos Trabalhadores). The PMDB and PFL had fragmented and dominant bases in 52 percent and 49 percent, respectively, of their votes. However, 58 percent of the PT vote presented a concentrated but non-dominant (shared) pattern of vote. By comparison, the PPB had only 35 percent of the vote with concentrated, shared distributions. Therefore, Carvalho argues that concentrated votes are not characteristic of traditional politics or clientelist bases. On the contrary, this pattern is characteristic of politicians affiliated with ideological parties, strong in populous and developed regions. In contrast, scattered bases of electoral support are an attribute of catch-all parties, such as the PMDB and PFL.
These studies have made important contributions to our understanding of the political geography of electoral votes. However, all the prior work has focused on the elections for the lower house but not the upper house, where malapportionment is much greater. Furthermore, in these studies underdevelopment, traditional politics, and malapportionment are all considered one variable jointly affecting electoral dominance and the spatial distribution of votes, and as a result we cannot discern independent impacts of these factors. 2 Does malapportionment affect the patterns of electoral support independent of the degree of development and political culture? Or is the conventionally asserted relationship between overrepresentation and dominant and concentrated patterns of votes spurious, one that would not even exist once development and culture are controlled for? Is it really less likely that overrepresented districts elect ideological, leftist candidates in favor of more conservative politicians? We seek to answer these questions using data for the last four senatorial elections in Brazil.
See Gordin (2010) for a discussion of the endogeneity problems in malapportionment research.
Variables and Data
Our analysis inquires into the factors that affect both the degree to which senators dominate their key municipalities and the spatial distributions of their electoral bases. To construct our dependent variables, we use data from the last four senatorial elections held in Brazil: 1998, 2002, 2006 and 2010. Our unit of analysis is senator per election. The 1998 and 2006 elections renewed one-third of the Senate seats, and the 2002 and 2010 elections two-thirds of the seats. In total, 162 senators were elected during this period. Of these, our analysis considers 156 senators, excluding senators elected from the Federal District, because municipal-level electoral data are not available for them.
Our dependent variables are constructed based on electoral performance of senatorial candidates at the municipal level. To measure municipal dominance and spatial distribution of electoral votes for each candidate, we use the measures adopted by Ames (1995, 2001). 3 Municipal dominance is the mean share of municipal votes, in percentages, that senator s won in an election across all the state's municipalities, weighted by the share of the candidate's personal vote. Due to a highly skewed distribution of the data, we use a natural logarithm of this variable. This variable measures the degree to which senator s electorally dominates his or her key municipalities. Thus, electoral dominance is an indicator of competitiveness of an election at the disaggregated, municipal level, aggregated into the level of each candidate. If the conventional wisdom about the relationship between overrepresentation and captive votes and lack of competition is true, senators elected from overrepresented states should have higher municipal dominance scores than those elected from underrepresented states.
Ames calculated mean municipal dominance and spatial distribution of the vote for federal deputies.
For the geographical distribution of votes, we computed spatial autocorrelation indices called Moran's I, which is calculated in the following way:
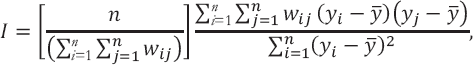
Our third dependent variable uses the Herfindahl–Hirschman Index (HHI) of market concentration. This index, bounded between 0 and 1, comes from business economics, and higher values (closer to 1) indicate monopoly (if the HHI = 1) or oligopoly – meaning lack of competition. For our purposes, the HHI is calculated as the sum of the squared proportion of the total votes a candidate wins in each municipality. Thus, if senator s receives most of his/her votes in a few municipalities, or to put it differently, if relatively few municipalities can elect a senator (a situation analogous to oligopoly in representation), this index will take a higher value. Conversely, if votes from many different municipalities contribute equally to the senator's election, this index will have a lower value. Crisp and Ingall (2002) also use the HHI as a measure of electoral support for Colombian senators. Although Crisp and Ingall call it “concentration,” since the HHI does not imply geographical clustering, we call this variable concentration ratio to differentiate it from Moran's I index.
Finally, we also examine the type of candidates elected in each state. As we discussed in the previous section, various scholars (for example, Soares 1973a, 1973b) claim that malapportionment contributes to the election of conservative, clientelistic politicians in overrepresented districts, hindering the election of more progressive, ideological, issue-oriented politicians. We thus analyze the likelihood that politicians affiliated with leftist parties will be elected. 4
For classification of parties, see our discussion below on candidates’ ideologies.
Our key explanatory variable is malapportionment. Since district magnitude does not vary across states – one or two seats per state depending on the election year – we use relative population size of the states (the percentage share of the total population in the country) as a measure of malapportionment. 5 Constructed in this way, higher values of malapportionment indicate underrepresentation, and lower values, overrepresentation.
Population data were collected from IPEA Data.
In addition, subsequent analysis will control for economic development, degree of urbanization, and regional political culture. As pointed out previously, these factors often conflate the relationship between malapportionment and patterns of electoral support. We therefore need to control for the effects of these variables to accurately gauge the independent impact of malapportionment on electoral bases of support. We measure economic development with gross state product per capita, 6 urbanization with the percentage of state population living in rural areas, and political culture with regional dummy variables of North, Northeast, Central-West, and South, using the most urban, industrialized region, the Southeast as the reference category.
Gross state product per capita in thousands of reais is in the 2000 constant value and was obtained from IPEA Data.
There are other factors also likely to influence the patterns of electoral support and candidates’ electability. Previous research has identified significant variations among senators and parties in terms of their relationships with their constituencies depending on their ideological orientations. We therefore include senators’ ideological placements based on their party affiliations at the time of election. 7
Parties are categorized as follows: left: PCdoB, PDT, PSB, PSOL, PT; center: PMDB, PPS, PSDB; right: PFL/DEM, PL, PMN, PP/PPB, PR, PRB, PRTB, PSC, PSD, PTB.
The data analysis also considers senators’ career trajectories. Senatorial candidates who have previously held notable public offices may have cultivated unique electoral bases thanks to their previous positions. For example, candidates who once were governors may enjoy widespread support throughout their states, whereas former mayors and federal deputies are more likely to have dominant and concentrated bases of support. In an earlier study, Ames (2001) shows that previous occupations of Brazilian federal deputies influence where they receive votes. We created dummy variables for senator, state governor, federal deputy, mayor, and federal government minister and coded as 1 if candidates held these positions prior to their respective elections.
In addition, we control for the number of senatorial candidates as a measure of ex ante competitiveness of the senatorial race in a state. The number of competitors in an electoral contest, especially when they are competing for only one or two seats, is likely to affect where candidates campaign and the degree to which they can control votes in each municipality. 8 We also consider socio-demographic and geographical factors by including in the analysis the percentage of the state electorate who voted in the state capital, along with each state's size in thousands of square kilometers. 9 Finally, the analysis also includes dummy variables for different years of election.
Data on the number of candidates were obtained from the TSE.
Information on the size of the electorate in state capitals was obtained from the TSE, and states’ geographical size from the IBGE.
Methodology
Our research questions require us to combine information collected at different levels. Some variables are measured at the individual (senator) level, while other variables are measured at the district (state) level. This means that our data have a multilevel structure where observations at one level (senators) are nested within the other (states). This type of data structure can create various statistical problems, such as correlated error terms and underestimated standard errors due to the clustering of the data (Steenbergen and Jones 2002). As a result, a standard regression modeling, such as OLS regression, is often inadequate to analyze multilevel data.
Two different approaches have recently been widely adopted to deal with these problems. One way to address correlated residuals is to use clustered standard errors, which takes into account the within-cluster dependence of the residuals. If the dependence among residuals is seen as a nuisance, using the clustered standard errors approach is appropriate (Rabe-Hesketh and Skrondal 2005; Primo, Jacobsmeier, and Milyo 2007). However, if non-constant variance is of substantive interest, one can explicitly model the dependence using multilevel analysis (Steenbergen and Jones 2002; Rabe-Hesketh and Skrondal 2005). For example, multilevel modeling with random intercepts allows different intercepts for different groups.
Since there remains some dispute about the selection of particular approaches used to examine multilevel data, and since the appropriateness of various methods is partly an empirical question, in what follows, we present our analysis using both the clustered standard errors approach and multilevel modeling with random intercepts where senators are nested within states. 10
One might wonder whether our regional dummy variables present higher levels. To determine whether a variable should be treated as a level or a variable, Rebecca Pillinger (n.d.) recommends that one consider a variable as such when categories have special meanings and when the number of categories is small. Since there are only five regions and they represent different cultures in our research, we treat regions as variables.
Empirical Analysis
Table 1 presents mean relative state population size, mean dominance, mean concentration, and mean concentration ratio for the senators in Brazil's five regions. Consistent with the common understanding, states in the North, Northeast and Central-West regions are on average overrepresented in the Senate, and states in the South and, especially, in the Southeast, are underrepresented. The table also reveals interesting information: while the higher mean dominance scores in the relatively overrepresented North, Northeast, and Central-West regions provide initial support for the “politics of backwardness” hypothesis, these regions have on average lower concentration indices than do the underrepresented Southeast and South regions. This suggests that senators from overrepresented states, on average, tend to electorally dominate their key municipalities, yet such bases of support are geographically scattered rather than concentrated. In contrast, senators elected from underrepresented states tend to have geographically contiguous core municipalities and tend to share them with other candidates.
Municipal Dominance and Distribution of Votes, Brazilian Senators
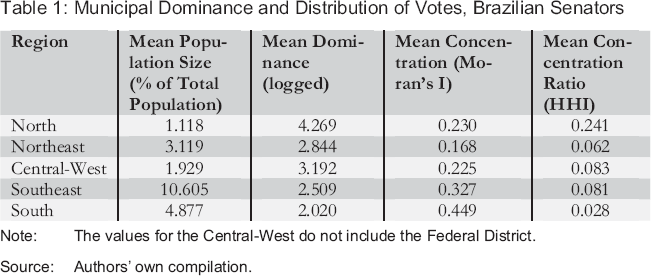
Note: The values for the Central-West do not include the Federal District.
Source: Authors’ own compilation.
The regional patterns of support with respect to the concentration ratios are less clear-cut. The most overrepresented region, the North, has the largest mean HHI index, as expected. However, the lowest mean HHI index is observed in the South. The remaining three regions, including the most underrepresented, the Southeast, have comparable mean indices.
The following maps of electoral support are illustrative examples of the patterns found above with respect to dominance and concentration. Figure 1 is the electoral map of Senator José Alencar based on the 1998 election outcomes. A successful businessman who later became President Luiz Inácio Lula da Silva's vice president from 2003 to 2010, Alencar was elected senator in 1998 from the Southeastern state of Minas Gerais, which with 10.61 percent of the national population is one of the most underrepresented states. The map shows that most of his votes were won in geographically contiguous municipalities, spreading outward from the state's capital, Belo Horizonte, indicating a pattern of “concentration.” Also, he did not strongly command any of the municipalities electorally. Even where he did the best, only 38 percent of the total votes were cast for him.
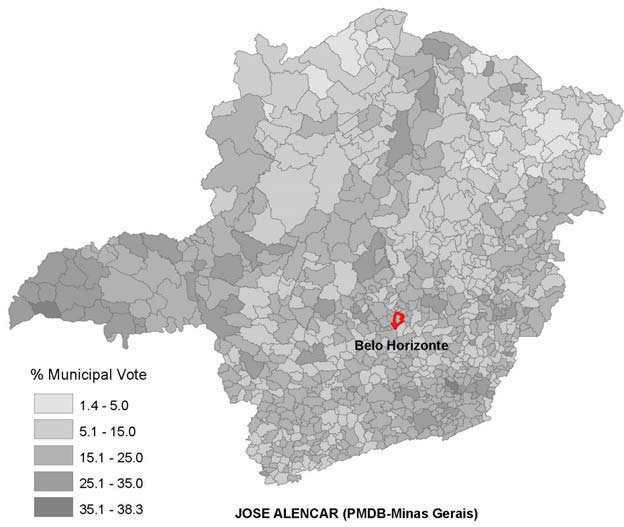
Electoral Map of Senator José Alencar, 1998 Election
Figure 2 is the 1998 electoral map of Senator Eduardo Suplicy, of the Workers’ Party (Partido dos Trabalhadores). Senator Suplicy was elected from the state of São Paulo, the most underrepresented state in Brazil, with 21.7 percent of the national population. The map suggests that Senator Suplicy's electoral strongholds are geographically contiguous and relatively concentrated in the São Paulo metropolitan area, including such municipalities as Campinas, Santo André, São Bernardo do Campo, Osasco, Guarulhos, Diadema, Sorocaba, São José dos Campos and so forth. Yet, he does not dominate his key municipalities; rather he shares these municipalities with other candidates. Hence, Senator Suplicy has electoral bases that are shared but concentrated. But São Paulo is the most industrialized state in the nation and home to important labor movements in Brazil. Senator Suplicy was a professor of economics and is best known for his “minimum income” project, which has spurred various anti-poverty programs, including the Bolsa Família (“Family Scholarship”). His profile is almost the opposite of what one would expect for a politician practicing backward politics.
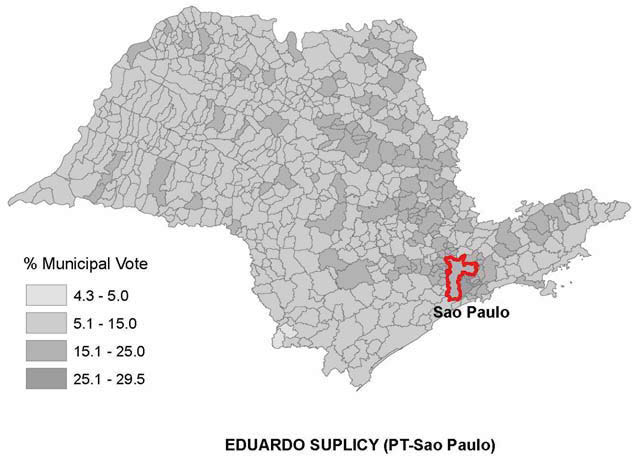
Electoral Map of Senator Eduardo Suplicy, 1998 Election
The map below (Figure 3) represents votes for Senator Vicente Alves de Oliveira, elected in 2010 from the northern state of Tocantins. With less than one percent of the national population, Tocantins is one of the most overrepresented districts and the newest state in Brazil, whose primary economic activity is agriculture. A former mayor and state and federal deputy, Senator Alves is an agriculturalist. His electoral map reveals a pattern that is dissimilar to the concentrated-shared electoral bases found for José Alencar and Eduardo Suplicy: Vicente Alves’ map indicates that his key municipalities are discontiguous and spread out across the state, and that his grip of these municipalities is much stronger than Alencar's and Suplicy's over their core municipalities. Thus we find that a senator from an overrepresented state has a pattern of electoral support that is dominant, which is consistent with the conventional hypothesis, but scattered, which disconfirms it.
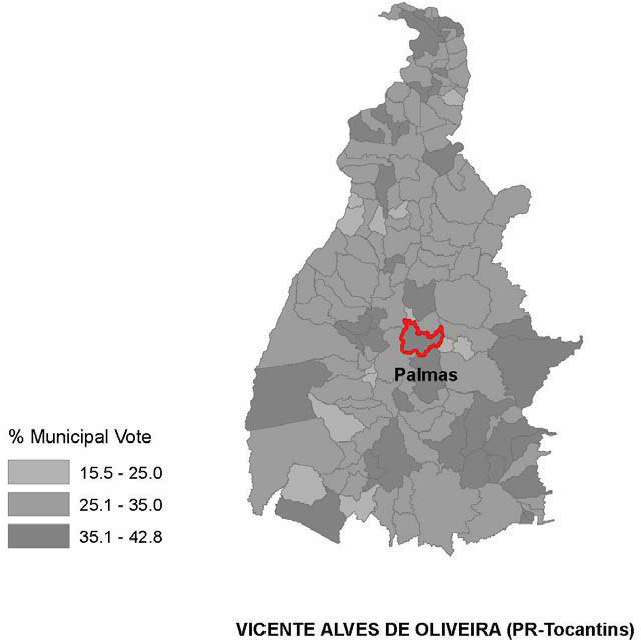
Electoral Map of Senator Vicente Alves de Oliveria, 2010 Election
The analyses of electoral maps and descriptive statistics so far have been quite supportive of the idea that the relationship between malapportionment, on one hand, and the degrees to which senators electorally dominate different municipalities and their spatial relationships, on the other, may be more complex than was commonly thought. Although this analysis proved informative, we are unable to isolate the effects of malapportionment from other socioeconomic and cultural factors that tend to vary with it. We thus need to move to a multivariate analysis.
Table 2 summarizes the results of the multivariate single-level OLS regression analyses with clustered standard errors and multilevel analyses with random intercepts. It presents estimation results for electoral dominance, concentration, and concentration ratios. Likelihood ratio tests and intra-class correlations indicate that multilevel modeling is appropriate for the analyses of dominance and concentration ratios, but a single-level regression analysis is adequate for the analysis of geographical concentration of votes. The results of multivariate analyses confirm tentative conclusions based on the analyses of descriptive statistics and electoral maps. They also highlight the importance of malapportionment in understanding the electoral bases of senators in all three cases; we find that malapportionment has statistically significant effects on municipal dominance, geographical concentration, and concentration ratios even when other potentially confounding factors are controlled for and even when a multilevel modeling method is used.
Electoral Dominance, Concentration, and Concentration Ratio by Brazilian Senators, 1998–2010
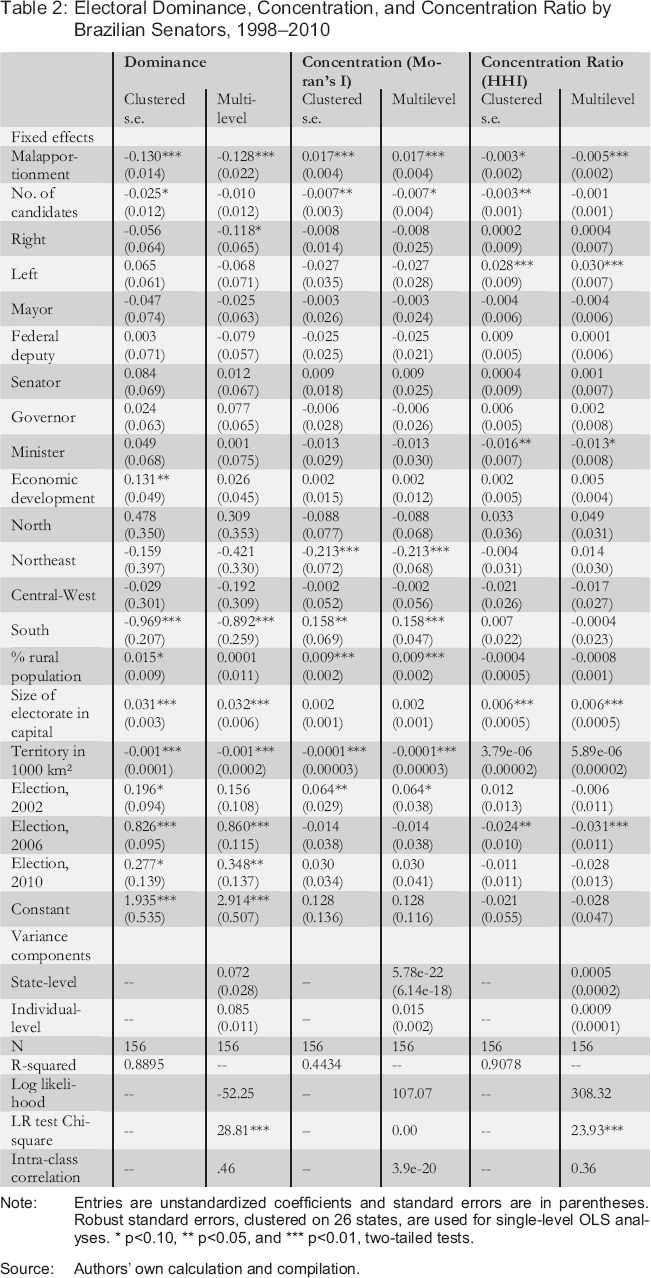
Note: Entries are unstandardized coefficients and standard errors are in parentheses. Robust standard errors, clustered on 26 states, are used for single-level OLS analyses.
p≤0.10
p≤0.05
p≤0.01, two-tailed tests.
Source: Authors’ own calculation and compilation.
Since interpreting coefficients to gauge the effects of independent variables on these indices is not straightforward, we can gauge substantive impacts by examining their influences on the dependent variables when the values of the statistically significant variables move from their minimum to their maximum, as shown in Table 3. The estimation results indicate that malapportionment is not only statistically significant but also the most powerful predictor of municipal dominance and the second most important predictor of concentration and concentration ratio. In our data, the values of dominance vary from −0.578 to 6.003, concentration (Moran's I) from −0.196 to 0.683, and concentration ratio (HHI) from 0.015 to 0.564. When the value of malapportionment measured by relative population size changes from 0.157 (minimum) to 21.810 (maximum), the expected value of dominance decreases by 2.78. In other words, underrepresentation is associated with a decrease in electoral dominance, and overrepresentation with an increase in dominance. Moreover, the same amount of change in malapportionment toward underrepresentation is expected to decrease the concentration ratio by 0.107. Both of these findings support the hypotheses that senators from underrepresented states will share their core electoral bases with other candidates and have broader bases of electoral support than senators from overrepresented states, who tend to dominate their key municipalities and whose supporters may be concentrated in a limited number of municipalities. However, underrepresentation will lead to geographical concentration of key municipalities (by 0.358 if the value changes from the minimum to the maximum), refuting the long-standing notion that underrepresentation is associated with dispersed patterns of votes, and overrepresentation with concentration of votes.
Marginal Effects on Dominance, Concentration, and Concentration Ratio
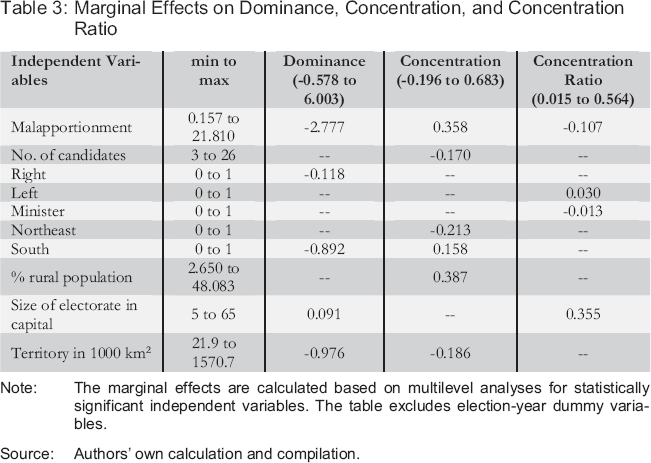
Note: The marginal effects are calculated based on multilevel analyses for statistically significant independent variables. The table excludes election-year dummy variables.
Source: Authors’ own calculation and compilation.
Socioeconomic and cultural factors have, if any, only weak effects. Economic development measured by gross state product per capita is not statistically significant in any of the multilevel models. Certain regional cultures have weak effects on dominance and concentration, but not the concentration ratio. The bases of support for senators from the Northeastern states tend to display less geographical concentration than those from the most developed and modern, Southeastern, states. Senators from the Southern states tend to dominate their key municipalities less and have more concentrated patterns of support than their Southeastern counterparts. Rural population size is a statistically significant predictor for geographical concentration; the change in the rural population size from 2.65 percent to 48 percent is associated with an increase of 0.387 in Moran's I, which is approximately the same amount of change expected with malapportionment.
Other state-level factors had moderate to strong effects. An increase in the size of the electorate in capital is associated with a slight increase in the dominance index (by 0.091) and a large increase in the concentration ratio (0.355). The territorial size of the districts also matters: the larger the states, the lower the dominance and concentration indices. The number of candidates in the race, an ex ante measure of the competitiveness of elections, is only significant in explaining geographic concentration. As hypothesized, an increase in the number of candidates decreases geographical concentration of votes.
Interestingly, most of the attributes at the candidate level – candidates’ political trajectories – are not associated with patterns of electoral support. One would expect, for example, that former mayors would have concentrated electoral bases, and former governors more dispersed ones. Yet, none of the previously held public offices is statistically significant except for that of the federal minister, which reduces the concentration ratio only slightly, by 0.013. Moreover, senators’ ideological orientations based on their party affiliations have somewhat surprising effects. Senators of right-wing parties dominate their key constituencies less than those of centrist parties, and the concentration ratio is on average greater for leftist senators than for senators from centrist parties.
One of the implications of the traditional literature on the relationship between malapportionment and representation is that programmatic politicians are more likely to be elected in underrepresented districts whereas conservative, clientelistic politicians continue to dominate overrepresented districts. Since the measurement of conservatism and clientelist orientations is not straightforward, 11 Table 4 shows the results of the analysis of the election of candidates affiliated with leftist parties. As with the previous case, we ran both single-level logit regression with clustered standard errors and multilevel logit to address the clustering of our data.
Election of Leftists to the Brazilian Senate, 1998–2010
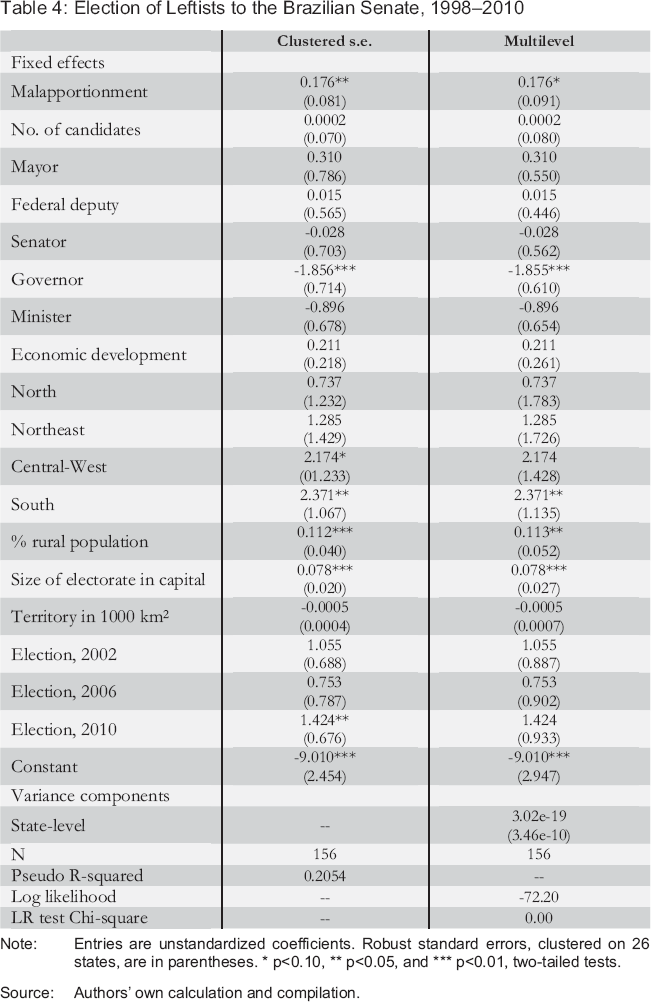
Note: Entries are unstandardized coefficients. Robust standard errors, clustered on 26 states, are in parentheses.
p≤0.10
p≤0.05, and
p≤0.01, two-tailed tests.
Source: Authors’ own calculation and compilation.
For example, many politicians switch parties, especially within and between rightist and centrist parties.
The likelihood ratio test indicates that single-level logit is adequate; in fact, these two models produce almost identical results.
Once again, our analysis indicates that malapportionment is a key factor in explaining senatorial election results. Overrepresented states are less likely to elect candidates of leftist parties, and underrepresented states are more likely to elect leftist senators. Thus, we confirm that malapportionment matters not only in the nature of the relationship between senators and their electoral bases but also the kind of senators to be elected.
Conclusion
Latin American legislative studies have made remarkable progress over the last decade. While research on single-house legislatures and lower houses of bicameral legislatures abounds, empirical analyses of upper houses and their memberships and processes are comparatively few. This study contributes to filling in this lacuna in Latin American legislative research by examining geographical patterns of electoral votes for Brazilian senators.
Such study is important for many reasons, the most compelling of which is that the Brazilian Senate is one of the most malapportioned in the world, a fact likely to have significant consequences for its members’ bases of electoral support and thus for representation. The conventional wisdom asserts that malapportionment contributes to the politics of backwardness – that is, it facilitates clientelistic politics and hinders programmatic campaigns, reducing electoral competition and producing geographically concentrated patterns of votes.
Our empirical study partially confirms yet partially negates this wisdom. Our examination of descriptive and geospatial data and multivariate multilevel regression analyses indicate that malapportionment affects competitiveness of elections: senators from overrepresented states tend to dominate their key municipalities electorally, whereas senators from underrepresented states tend to share their core municipalities. Moreover, senators from underrepresented states have broader bases of support than senators from overrepresented states. We also discovered that malapportionment is related to the type of senators elected; leftist candidates are less likely to be elected in overrepresented states. These findings are consistent with the traditional view. However, contrary to the previous understanding, we find that senators from underrepresented states tend to have electoral bases that are geographically concentrated, whereas those from overrepresented areas tend to have much more scattered bases of support. Hence, our findings suggest that the relationships between malapportionment and elections may be more complex than commonly acknowledged.