
Abstract
Purpose:
The purpose of this study was to define how different force environments by neuromuscular diagnosis (hypertonic versus hypotonic) impact the growth and morphology of the proximal femoral and acetabular regions relative to typically developing children.
Methods:
Children with cerebral palsy and spinal muscular atrophy were compared with typically developing children aged 6 months to 11 years. Routine pelvic radiographs were evaluated using measures of hip geometry for the proximal femur and acetabulum. The data were analyzed using general linear models to estimate the developmental patterns according to age and diagnosis.
Results:
One hundred eighty-four children met the inclusion criteria: 58 spastic cerebral palsy Gross Motor Function Classification System I–V (263 hips), 32 spinal muscular atrophy (79 hips)), and 94 typically developing (187 hips) were included with a mean age of 4.9 ± 3.1 years. Using spinal muscular atrophy as a reference, significant differences in proximal femoral development included long thin versus short neck (p < 0.01) and round versus flat epiphysis (p = 0.001). A thin neck-wide epiphysis was found in spinal muscular atrophy versus thick neck-small epiphysis for typically developing (p < 0.05). The ratio of acetabular width to proximal femoral epiphysis width differed significantly for typically developing (p = 0.001) compared with cerebral palsy and spinal muscular atrophy. There was a negative correlation between migration percentage and acetabular width to epiphysis width in children with cerebral palsy, but no correlation in children with spinal muscular atrophy.
Conclusion:
Hip geometry was impacted by the force environment experienced during growth. These findings emphasize the crucial roles of gross motor function, muscle tone, and strength differences in determining hip morphology.
Level of Evidence:
III, retrospective case control.
Keywords
Introduction
In neuromuscular disorders, the proximal femoral region is susceptible to acquired deformities during growth that can lead to hip instability, which is directly correlated to level of neurologic impairment. 1 The force environment profoundly influences the shape development of the hip joint, with nonambulatory patients at greatest risk of pathologic changes in bony geometry. 2 Hip dysplasia in cerebral palsy (CP) is the most widely studied and is associated with proximal femoral and acetabular deformities. 3 Although the spastic motor type is most prevalent in CP and has been reported to be associated with hip dysplasia, 4 functional level as defined by the Gross Motor Function Classification System (GMFCS) is most strongly correlated to the incidence of hip dysplasia.5,6 Several reports have found that muscle tone is not a good predictor of hip instability in CP, with hypertonic and hypotonic motor types having similar risks and incidence.6 –8 Despite these data, the specific proximal femoral shape alterations associated with hip instability present with neuromuscular diagnoses may be different for those with hypertonia (e.g., spastic CP) versus hypotonia (e.g., spinal muscular atrophy (SMA)).
SMA is a genetic condition typified by hypotonia and progressive muscle weakness. Linked to ambulatory status and functional level, hip subluxation is common and associated with proximal femoral shape alteration and acetabular dysplasia.3,8,9 Periarticular hip muscle forces in spastic CP and SMA represent two distinct influences on the developing hip joint.3,9 The hip joint reaction force in nonambulatory children is generated from spastic muscle and abnormal limb posture. These forces were reported to be high and abnormally directed. 10
The purpose of this article was to define how the different force environments in SMA and CP impact the formation and morphology of the proximal femoral region compared with typically developing (TD) children.
Methods
This single-center retrospective case-control study, approved by the Institutional Review Board, analyzed the hip radiographic images of children aged 6 months to 11 years. The study encompassed children with spastic CP GMFCS I–V, SMA types 1–2, and TD children who had no lower extremity pathology. Patients with CP were stratified into groups based on GMFCS levels I–III and IV–V.
The study analyzed routine radiographic records from a tertiary pediatric hospital collected between 2006 and 2021. Inclusion criteria were X-rays that belong to children aged 6 months to 11 years diagnosed with spastic CP, SMA types 1–2, and TD children. Exclusion criteria were any X-rays that belong to children with SMA type 3 and other neuromuscular disorders, a history of prior lower extremity trauma, infection, tumor, or previous surgical procedures affecting the shape of the hip and proximal femora. SMA type 3 was excluded from the study primarily because we do not have a sufficient number of type 3 radiographs to separately analyze this group and because SMA type 3 does not completely represent the hypotonic and non-weight-bearing environment around the hip. We excluded TD children if they had any delay in walking or any treatment for lower extremity conditions that impacted gait or walking ability prior to the radiograph. To avoid issues related to rotational problems during the acquisition of the X-rays, images not showing the greater trochanter and lesser trochanter in profile, asymmetrical femoral heads, obturator foramen, and iliac bones were excluded.
Radiographic measurements included the femoral neck shape defined by femoral neck length to femoral neck width ratio (FNL/FNW), epiphyseal shape defined by epiphysis width to epiphysis height ratio, and epiphysis width relative to neck width defined by epiphysis width to femoral neck width ratio (EW/FNW). Acetabular size relative to epiphysis size was defined by the straight-line length of the roof of the acetabulum from the lateral edge to the triradiate cartilage divided by the maximum width of the epiphysis (roof width to epiphysis width ratio (RW/EW)). The growth plate neck angle was measured as the angle between the capital growth plate and long axis of the femoral neck, and the migration percentage (MP) was measured as the ratio of the epiphysis that is lateral to the edge of the acetabulum divided by the whole width of the epiphysis (Figure 1).11 –15 After a dedicated time of education with the senior author, the first author of this research who is an experienced orthopedic surgeon conducted these measurements under standardized conditions, ensuring consistency and accuracy. All measurements were converted to ratios to remove the impact of age, patient size, and variable image magnification.
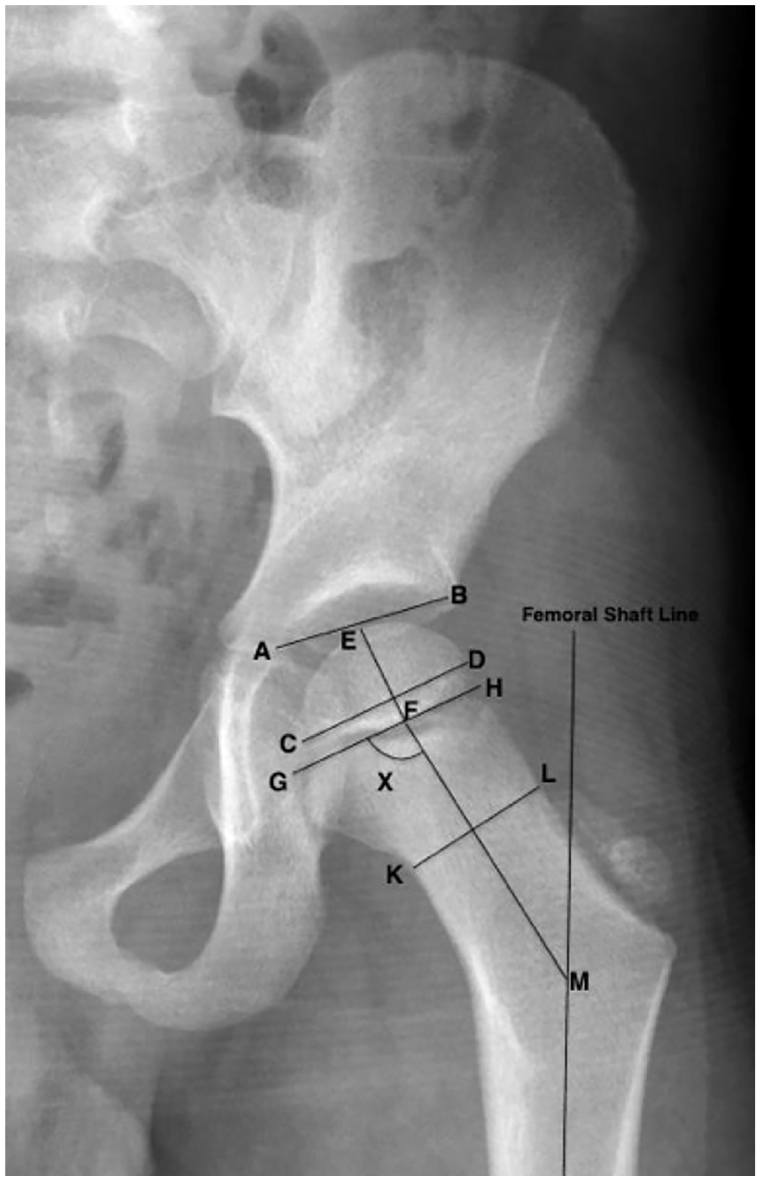
Measurements done in this study are depicted on this X-ray and include femoral neck length to neck width ratio (FM/KL), epiphysis width to epiphysis height ratio (CD/EF), acetabular size relative to epiphysis size (AB/CD), growth plate neck angle (X angle: the angle between the FM and GH lines).
Statistical analysis
Our statistical analysis used a general linear model with a gamma, inverse Gaussian, Poisson, or negative binomial depending on the distribution of the variable, executed using R statistical software. 16 This model was selected for its aptness in managing data involving ratios and distributions that are typically skewed.
The analysis aimed to explore the relationships between various radiographic outcomes (dependent variables) and key predictive factors such as age and the diagnostic category of the children (CP GMFCS I–III and GMFCS IV–V; SMA; or TD). In this analysis, the SMA group served as a reference category for two main reasons. First, to facilitate a comparative evaluation between groups affected by different neurological conditions and TD children. Second, to evaluate the distinct biomechanical environment surrounding the hip in SMA with hypotonia, severe muscular weakness, and a lack of weight-bearing capacity, which has the lowest hip joint reaction force. The other three groups had varying levels of hip force and weight-bearing ambulatory ability. Statistical significance of the predictive factors was determined through p-values, assessing the probability of observing the obtained coefficients if there was no actual effect.
Results
This study included a total of 184 patients mean age of 4.9 years (standard deviation (SD): 3.1) with 529 hips. The cohort comprised 29 patients mean age 4.9 years (SD: 2.9) with CP GMFCS I-III (139 hips), 32 patients mean age 5.1 years (SD: 2.4) with SMA (79 hips), 29 patients mean age 5 years (SD: 3.1) with CP GMFCS IV–V (124 hips), and 94 TD children mean age 4.9 years (SD: 3.6; 187 hips). Sex distribution for patients was 96 (52%) female and 88 (48%) male and for hips, 299 (56%) female and 230 (43%) male.
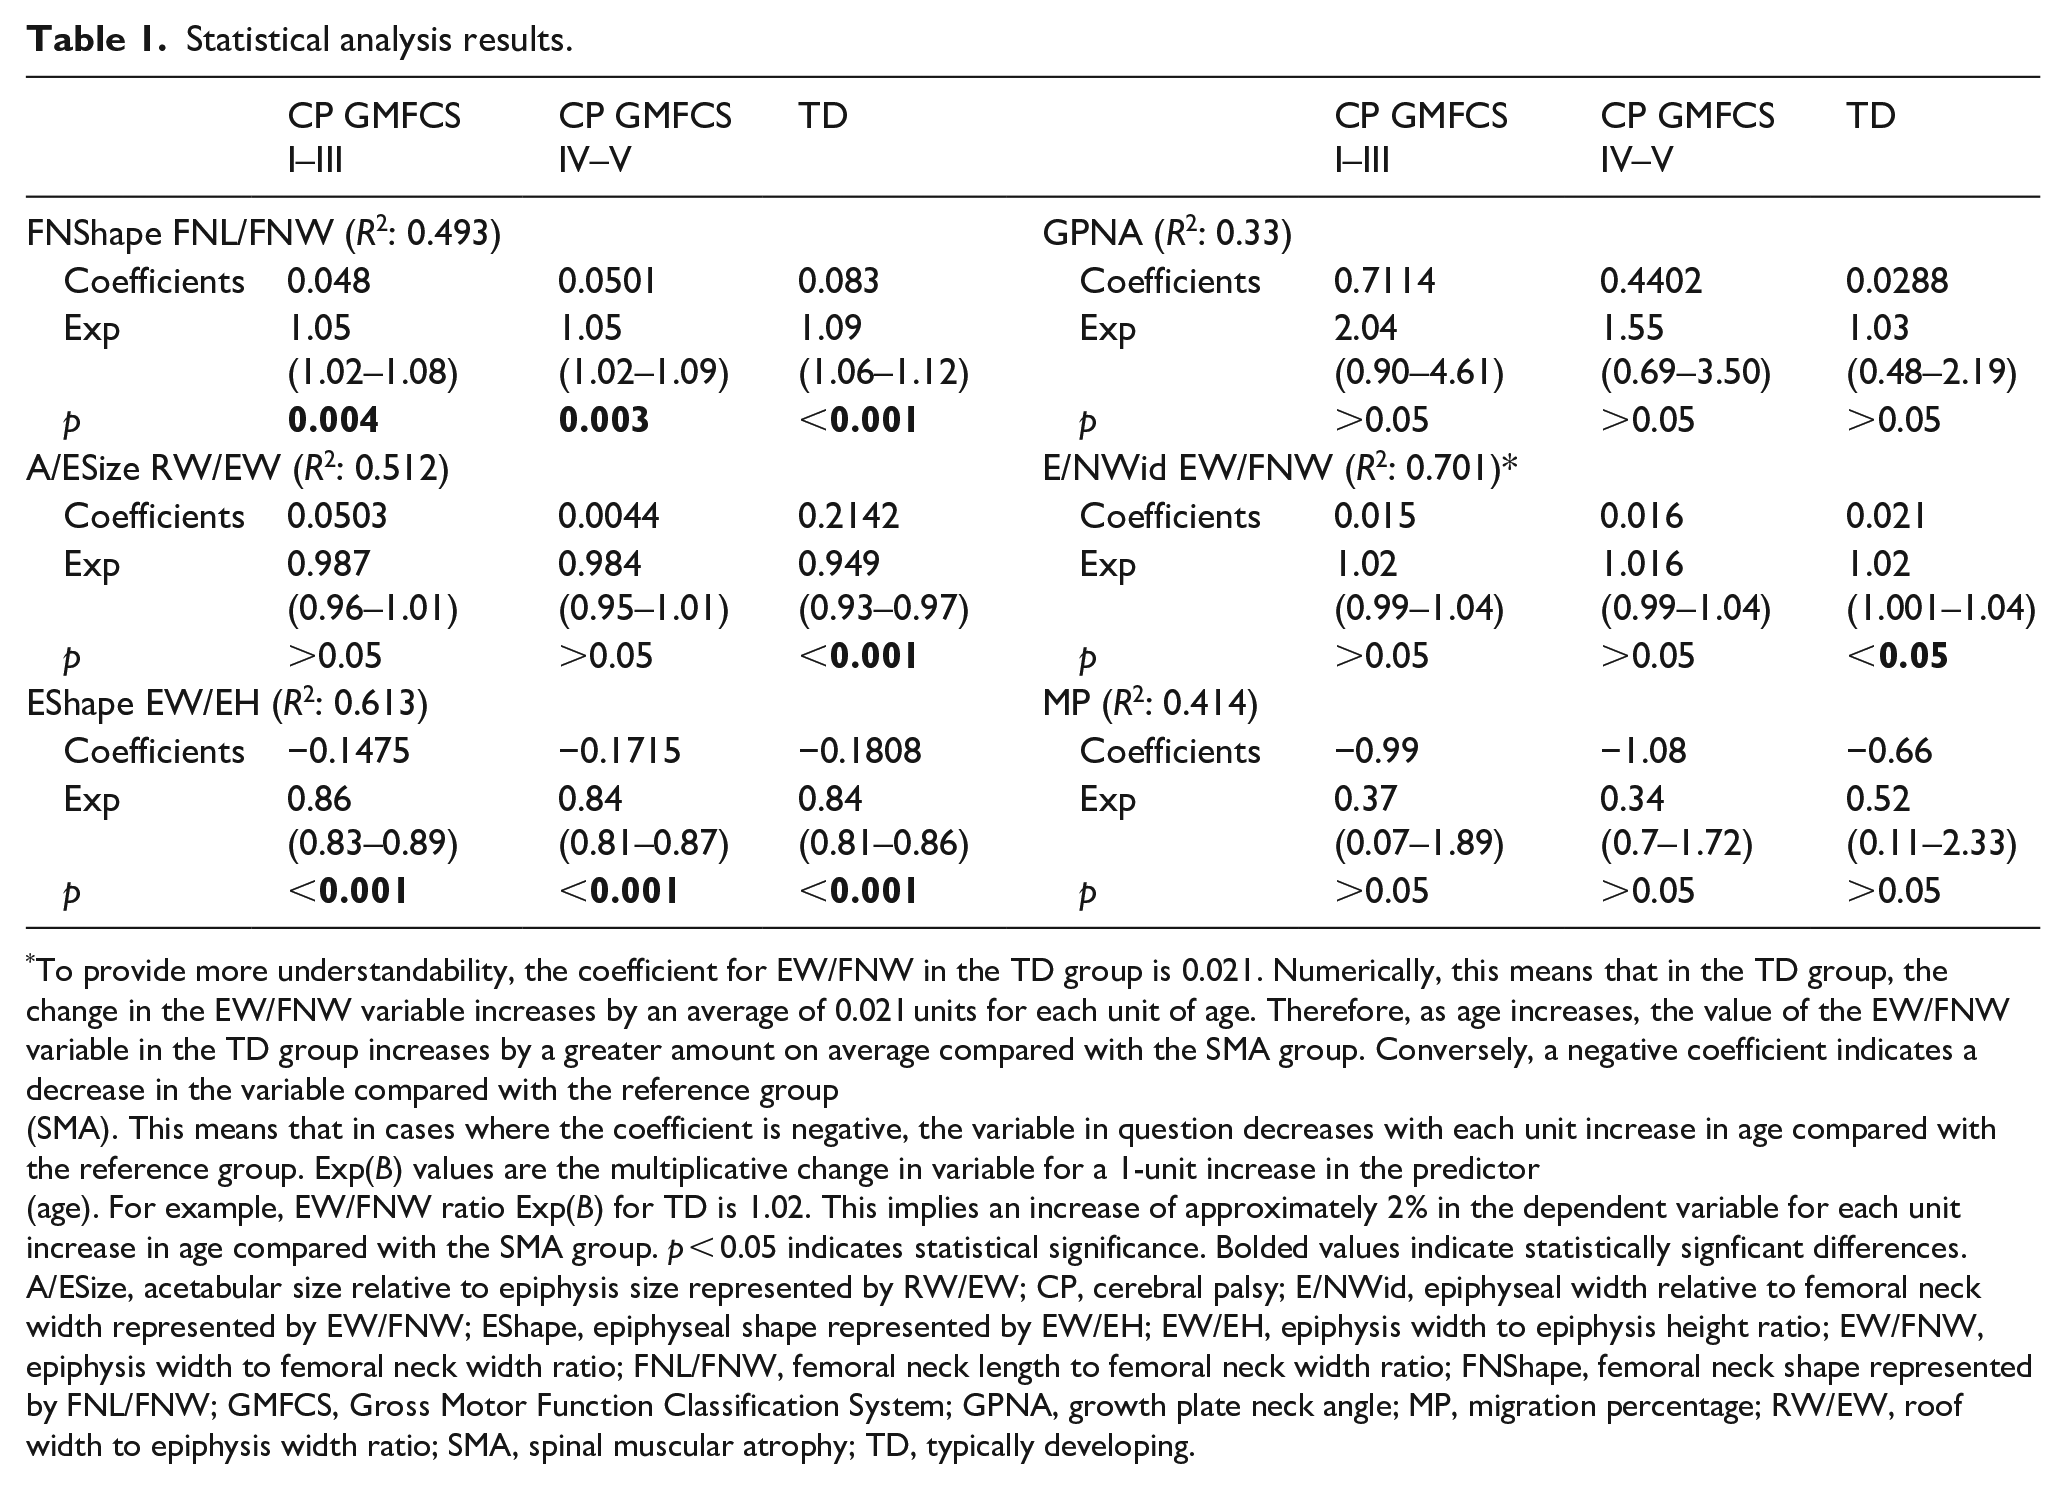
The analysis, using the SMA group as a reference, showed that changes in FNL/FNW and epiphysis width to epiphysis height ratios with age revealed significant differences between the groups. For each year increase in age, there was a corresponding increase in the femoral neck becoming longer and thinner, which started as longer and thinner in SMA and shorter and wider in others (FNL/FNW) by 4.8% for the CP GMFCS I–III group, 5% for the CP GMFCS IV–V group, and 8.3% for the TD children group compared with SMA (Table 1). When plotted over time, the femoral neck in SMA remained relatively unchanged, whereas the other groups were approaching the SMA shape by becoming longer and thinner as they got older (Figure 2(a)). Similarly, the epiphysis shape becomes flatter in both CP groups and TD compared with SMA, which maintained a more rounded epiphysis. This change was statistically significant across all three groups compared with SMA (Table 1 and Figure 2(b)). The width of the epiphysis relative to the femoral neck showed a trend to increase with age in all groups; however, the rate of increase in the SMA group was statistically significantly slower compared with TD. This means that SMA starts with a larger epiphysis and thinner neck that remains unchanged while the others start with a thicker neck relative to the epiphysis that becomes thinner relative to the epiphysis (Figure 2(c)). The acetabular width relative to the epiphysis width has a pronounced decreasing trend in TD as opposed to all other groups (Figure 2(d)). No intergroup differences in the trend of change with age were observed in the MP (Figure 3(a)) and growth plate neck angle values (Figure 3(b) and Table 1).
Statistical analysis results.
To provide more understandability, the coefficient for EW/FNW in the TD group is 0.021. Numerically, this means that in the TD group, the change in the EW/FNW variable increases by an average of 0.021 units for each unit of age. Therefore, as age increases, the value of the EW/FNW variable in the TD group increases by a greater amount on average compared with the SMA group. Conversely, a negative coefficient indicates a decrease in the variable compared with the reference group (SMA). This means that in cases where the coefficient is negative, the variable in question decreases with each unit increase in age compared with the reference group. Exp(B) values are the multiplicative change in variable for a 1-unit increase in the predictor (age). For example, EW/FNW ratio Exp(B) for TD is 1.02. This implies an increase of approximately 2% in the dependent variable for each unit increase in age compared with the SMA group. p < 0.05 indicates statistical significance. Bolded values indicate statistically signficant differences.
A/ESize, acetabular size relative to epiphysis size represented by RW/EW; CP, cerebral palsy; E/NWid, epiphyseal width relative to femoral neck width represented by EW/FNW; EShape, epiphyseal shape represented by EW/EH; EW/EH, epiphysis width to epiphysis height ratio; EW/FNW, epiphysis width to femoral neck width ratio; FNL/FNW, femoral neck length to femoral neck width ratio; FNShape, femoral neck shape represented by FNL/FNW; GMFCS, Gross Motor Function Classification System; GPNA, growth plate neck angle; MP, migration percentage; RW/EW, roof width to epiphysis width ratio; SMA, spinal muscular atrophy; TD, typically developing.
This graphic, drawn based on the predicted values of the dependent variables investigated in the study, illustrates the changes over time in different groups. Also, two radiographic images have been attached to the graphic indicating how the femoral head looks as the variable gets higher and lower. (a) femoral neck shape—FNL/FNW by age and group, (b) epiphyseal shape—EW/EH by age and group, (c) EW/FNW by age and group, and (d) acetabular size relative to epiphysis size—RW/EW by age and group. Changes on the Y-axis are indicated by the bolded labels, (A) short thick femoral neck increasing to a more long thin neck, (B) a round epiphysis changing to wide and flat, (C) a femoral head and neck of similiar width changing to a larger femoral head compared to femoral neck, (D) smaller acetabulum relative to femoral epiphysis with changing to larger acetabulum relative to smaller femoral epiphysis.
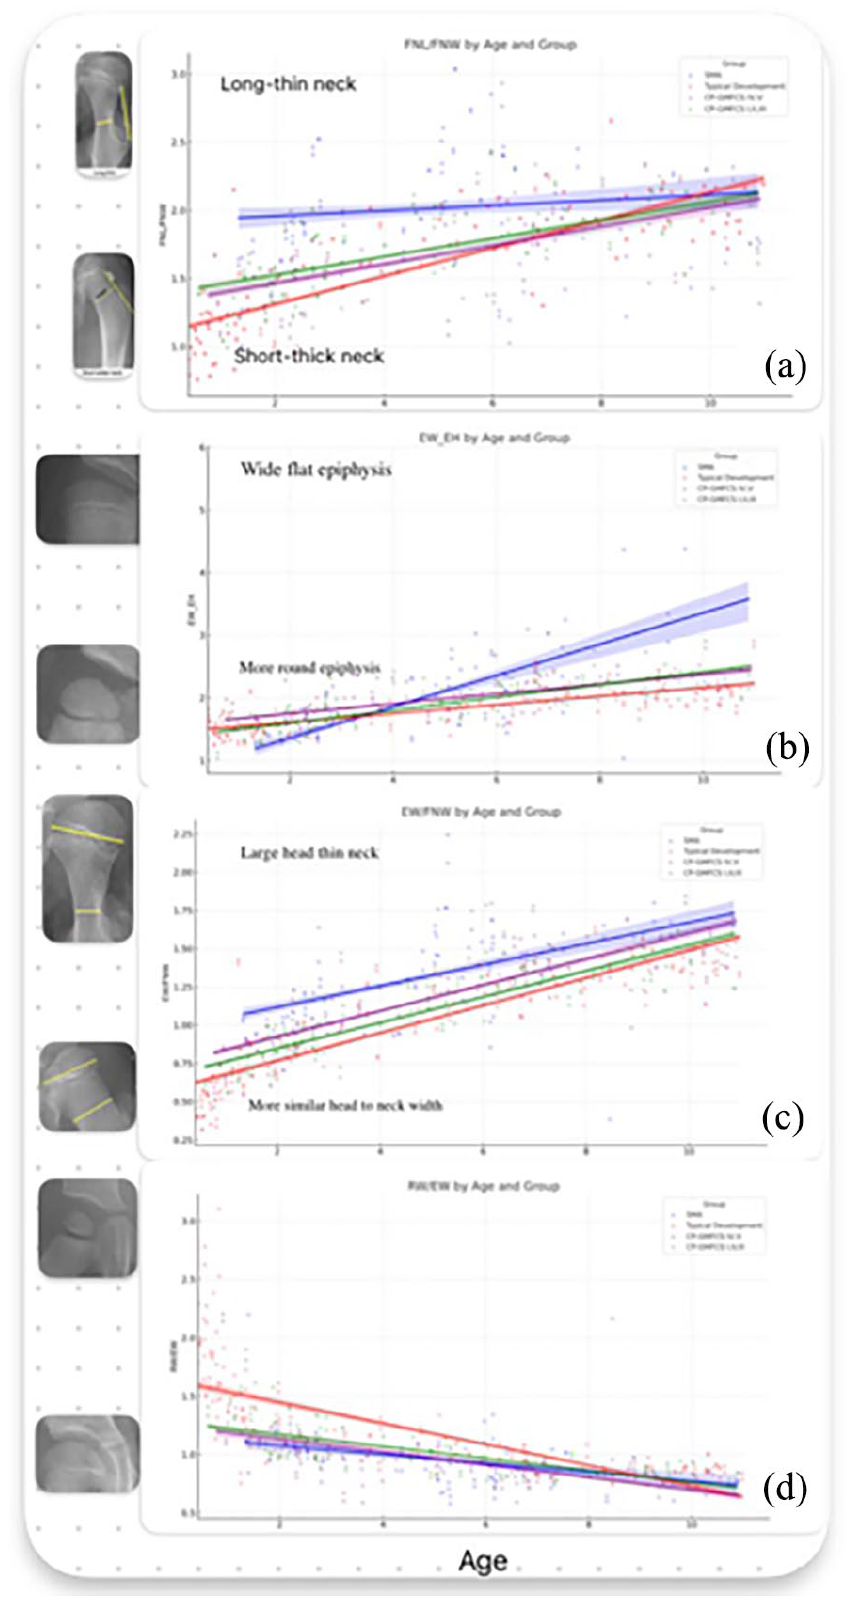
This graphic is based on the predicted values of hip MP (a) and GPNA (b) and depicts the temporal changes across various groups. It is important to note that hip MP consistently exhibits higher values in the SMA group across all ages despite the absence of a distinct pattern in its change over time. Similarly, GPNA decreases with age in all groups, and although this decline is somewhat more pronounced in the SMA group, it does not reach statistical significance (Table 1).
There was a consistently higher MP value in the SMA group relative to others, even though the overall age variation was consistent across all groups. The CP groups displayed a statistically significant negative correlation between the MP and acetabular size relative to epiphysis size. This correlation was absent in the SMA group (Table 2 and Figure 4). The TD group was excluded from this analysis due to most of the MP values being zero.
Correlation analysis results between RW/EW and hip MP.
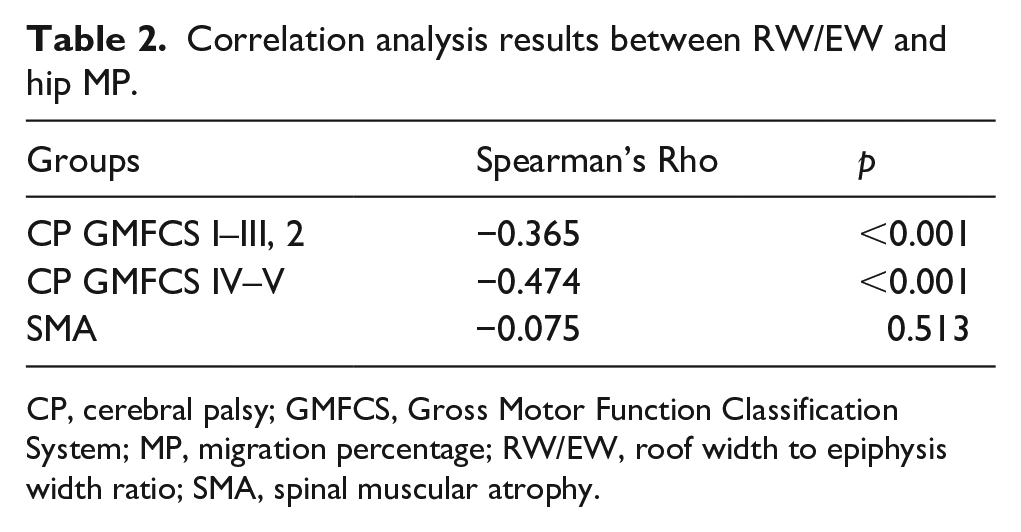
CP, cerebral palsy; GMFCS, Gross Motor Function Classification System; MP, migration percentage; RW/EW, roof width to epiphysis width ratio; SMA, spinal muscular atrophy.
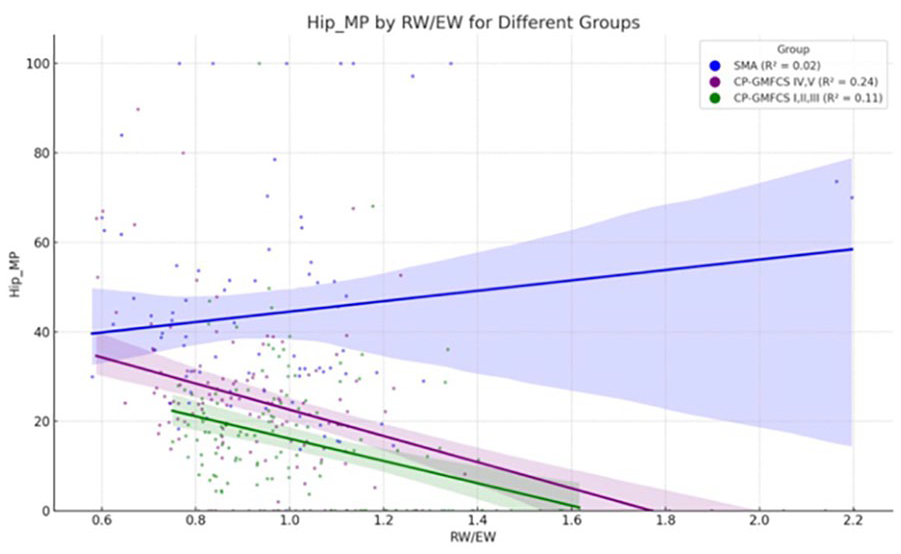
This graphic illustrates the correlation between RW/EW and hip MP across different groups.
Discussion
This study’s observations on proximal femoral morphology alterations in children with CP, SMA, and TD provide a multifaceted view of how neuromuscular forces influence skeletal development. The force environment surrounding the hip joint is complex, involving not only the muscle tone but also the loading patterns influenced by mobility, weight-bearing status, and therapeutic interventions. We have found that the proximal femur of children with SMA whose hips experience a very low force environment due to muscle weakness starting at birth and nonambulatory status develop long thin femoral necks with larger round femoral heads and a relatively smaller acetabulum compared with their femoral heads. Based on these measurements, there was little difference between the hips in ambulatory CP GMFCS I–III compared with nonambulatory hips (GMFCS IV–V) and hips of TD ambulatory children. Only the TD children developed bigger acetabula relative to the femoral heads compared with all other groups. There were no significant differences between ambulatory and nonambulatory children relative to femoral head and epiphysis shape; however, this population was chosen from a clinic where aggressive hip monitoring and treatment of spastic CP hips occurred. All hips that had bone surgery prior to acquisition of a radiograph were excluded likely impacting the natural history of the CP groups. This is also likely the reason the relationship between hip MP and acetabular head size ratio was only significant between the SMA group compared with the other groups.
There have been no other reports evaluating shape parameters reported in the current study; however, femoral neck valgus and anteversion have been reported to be different between ambulatory and nonambulatory children with CP concluding that femoral shape difference is due to weight-bearing ambulation. 7 Hermanson et al. also reported that the femoral head-shaft angle along with GMFCS are predictive factors for hip displacement. 17 We did not report on either of these measures in this report. On the other hand, based on the measures done in the current study, although there were no significant differences between the ambulatory and nonambulatory children with CP, the significant differences with SMA hips show that the force environment contributed by both muscle activity and weight-bearing are important parameters for femoral shape development. There was also no difference in the femoral neck to epiphyseal plate angle between any group.
There is increasing interest in guided growth of the proximal femur to treat hip subluxation in children with neurologic impairments.18 –20 Guided growth can favorably alter the growth trajectory in CP,18,20 but outcomes in SMA are less clear. Guided growth of the proximal femur would either impact the epiphyseal line to femoral neck angle or the length of the femoral neck. Based on the results of the current study, the femoral neck shortening effect experienced with guided growth might be useful in SMA since it would accentuate the natural trend, but it is not clear what the impact of altering the angle of the epiphyseal growth plate would be since it is not different from typical development. Moreover, based on this study of SMA femoral neck being abnormally long and thin, we speculate that placing a central guided growth screw might be useful in making the neck shorter and wider in SMA, which will help make varus derotation osteotomy easier compared with performing it in a hip with a narrow neck that causes technical issues. The unchanged trend of the long, thin femoral neck and the increasing trend of the large femoral head with age in the SMA group suggests that the proximal femur remains longer and thinner naturally over time, while the other groups follow a different developmental trajectory, becoming longer and thinner while shorter and thicker at the beginning. Based on previous studies, there are clear differences in neck-shaft angle and head-shaft angles; therefore, altering the epiphyseal plate neck angle might create a compensatory correction for the abnormal neck-shaft angle.7,20
The earlier onset and more severe progression of hip displacement in SMA compared with CP, as noted in our study, aligns with the findings of Ulusaloglu et al. 21 This could be indicative of a more unifying cause for hip displacement development stemming from features common to both hypertonic and hypotonic disorders, such as abductor muscle weakness and lack of functional weight bearing. This impact of weakness is present very early, at birth, in patients with SMA, whereas children with CP tend to present with increasing spasticity during early childhood with delayed or limited weight bearing and abnormal hip joint reaction force vectors due to lower extremity posturing caused by spasticity. 22 The early life impact of the low force environment in SMA probably increases the effect due to the more rapid growth of the proximal femur relative to the distal femur in early life.21,22
In this study, we found that the SMA group differs from others primarily by the severe muscle weakness and the correlation between relative acetabular and femoral head growth as it correlates to hip MP. This is likely due to the low force vector directing the femoral head into the acetabulum. Based on previous studies, the femoral head pressure against the acetabulum is required for normal acetabular growth and the femoral head contained in the acetabulum prevents it from overgrowing.23,24,27 This is contrasted by findings in CP, where the relationship between hip displacement and gross motor function has been well-established.5,17,25 This is consistent with our current findings where there was less difference between the normal developing hip and the CP hips, suggesting that the force magnitude is less of a problem compared with the force direction. This is consistent with previously reported modeling. 10 In this retrospective study, we used iliac width measured on anteroposterior X-rays as a surrogate for acetabular size, acknowledging that this is not equivalent to acetabular volume. Although computed tomography scans would provide a more accurate acetabular volume assessment, they were unavailable in this retrospective study. It is also very scarce in the literature. There is a study investigating acetabular volume of neuromuscular hips, which has been done using the data of CP population. 26 Therefore, we emphasize that the measurement of iliac width is the closest approximation we could use, and we recognize the limitations of this approach in assessing true acetabular volume.
Limitations of this study include the retrospective nature of the case-control design that imposes constraints on causal inference due to the potential for selection bias and the inability to directly control for all confounding variables. Second, the reliance on two-dimensional radiographic data limits our understanding of morphological and volume insights without a direct correlation to functional outcomes. Additionally, the exclusion of patients with prior surgical interventions, thereby impacting the population’s natural history, may limit the generalizability of our findings. Furthermore, the categorization of CP and SMA based on clinical classification systems, while necessary, may oversimplify the spectrum of neuromuscular involvement and its impact on hip development. Moreover, the lack of reliability and the situation that the measurements were done by a single orthopedic surgeon instead of at least two might be acknowledged as another limitation of this study. Last, the study’s cross-sectional analysis provides a snapshot in time and lacks the longitudinal follow-up necessary to fully understand the progression of hip morphology changes over time and in response to interventions.
Conclusion
This study delineates a clear contrast in the proximal femoral morphology between children with spastic CP and SMA, highlighting the distinct impact of neuromuscular disorders on hip development. Our findings emphasize the crucial role of normal motor function, muscle tone, and strength differences in shaping hip morphology in these conditions. Specifically, the study reveals a more pronounced and earlier onset of proximal femoral shape alteration in SMA, underscoring the significant influence of hypotonia and muscle weakness. These insights may help tailor intervention strategies to the specific needs of each patient based on the hip force environment.
Supplemental Material
sj-pdf-1-cho-10.1177_18632521241291768 – Supplemental material for The impact of neurological impairment and tone on hip joint development
Supplemental material, sj-pdf-1-cho-10.1177_18632521241291768 for The impact of neurological impairment and tone on hip joint development by Sadettin Ciftci, Luiz Carlos Almeida da Silva, Jason J Howard, Michael Wade Shrader and Freeman Miller in Journal of Children’s Orthopaedics
Footnotes
Acknowledgements
The authors would like to thank Dr. Kenneth J. Rogers for help with study design and statistical support.
Author contributions
S.C.: conception or design of the work; acquisition, analysis, or interpretation of data for the work; drafting the work; final approval of the version to be published; agreement to be accountable for all aspects of the work in ensuring that questions related to the accuracy or integrity of any part of the work are appropriately investigated and resolved. L.C.A.S.: conception or design of the work; acquisition, analysis, or interpretation of data for the work; revising the work critically for important intellectual content; final approval of the version to be published; agreement to be accountable for all aspects of the work in ensuring that questions related to the accuracy or integrity of any part of the work are appropriately investigated and resolved. J.J.H.: acquisition, analysis, or interpretation of data for the work; revising the work critically for important intellectual content; final approval of the version to be published; agreement to be accountable for all aspects of the work in ensuring that questions related to the accuracy or integrity of any part of the work are appropriately investigated and resolved. M.W.S.: acquisition, analysis, or interpretation of data for the work; revising the work critically for important intellectual content; final approval of the version to be published; agreement to be accountable for all aspects of the work in ensuring that questions related to the accuracy or integrity of any part of the work are appropriately investigated and resolved. F.M.: drafting the work; acquisition, analysis, or interpretation of data for the work; revising the work critically for important intellectual content; final approval of the version to be published; agreement to be accountable for all aspects of the work in ensuring that questions related to the accuracy or integrity of any part of the work are appropriately investigated and resolved.
Declaration of conflicting interests
The author(s) declared no potential conflicts of interest with respect to the research, authorship, and/or publication of this article.
Funding
The author(s) received no financial support for the research, authorship, and/or publication of this article.
Ethical statement
This study received approval from the Nemours Institutional Review Board and conforms to all tenets of the Declaration of Helsinki.
Supplemental material
Supplemental material for this article is available online.
References
Supplementary Material
Please find the following supplemental material available below.
For Open Access articles published under a Creative Commons License, all supplemental material carries the same license as the article it is associated with.
For non-Open Access articles published, all supplemental material carries a non-exclusive license, and permission requests for re-use of supplemental material or any part of supplemental material shall be sent directly to the copyright owner as specified in the copyright notice associated with the article.