
Abstract
Purpose:
Greulich and Pyle is the most used system to estimate skeletal maturity but has significant drawbacks, prompting the development of newer skeletal maturity systems, such as the modified Fels skeletal maturity systems based on knee radiographs. To create a new skeletal maturity system, an outcome variable, termed a “skeletal maturity standard,” must be selected for calibration of the system. Peak height velocity and 90% of final height are both considered reasonable skeletal maturity standards for skeletal maturity system development. We sought to answer two questions: (1) Does a skeletal maturity system developed using 90% of final height estimate skeletal age as well as it would if it was instead developed using peak height velocity? (2) Does a skeletal maturity system developed using 90% of final height perform as well in lower extremity length prediction as it would if it was instead developed using peak height velocity?
Methods:
The modified Fels knee skeletal maturity system was recalibrated based on 90% of final height and peak height velocity skeletal maturity standards. These models were applied to 133 serially obtained, peripubertal antero-posterior knee radiographs collected from 38 subjects. Each model was used to estimate the skeletal age of each radiograph. Skeletal age estimates were also used to predict each patient’s ultimate femoral and tibial length using the White–Menelaus method.
Results:
The skeletal maturity system calibrated with 90% of final height produced more accurate skeletal age estimates than the same skeletal maturity system calibrated with peak height velocity (p < 0.05). The 90% of final height and peak height velocity models made similar femoral and tibial length predictions (p > 0.05).
Conclusion:
Using the 90% of final height skeletal maturity standard allows for simpler skeletal maturity system development than peak height velocity with potentially more accuracy.
Introduction
Accurate estimation of skeletal maturity is critical for decision-making in many pediatric orthopedic conditions, including scoliosis, slipped capital femoral epiphysis, and limb-length discrepancy. Classically, Greulich and Pyle (GP) is the most used system to estimate maturity but has multiple drawbacks.1-5 The GP system itself is based on matching a current patient’s hand X-ray to a reference bone atlas which was created from white children from upper socio-economic families. The GP system is also missing data for 14.5 year old males, along with 11.5 year old and 12.5 year old females.5–13 During the peripubertal years, the GP system also distinguishes skeletal maturity at 6-month intervals, giving it inherently limited accuracy. Issues with GP inter-rater reliability have also been reported. 14 Finally, the need to obtain an additional left-hand radiograph can be burdensome when radiographs of other joints are already obtained for clinical care.
To address these concerns, multiple newer skeletal maturity systems (SMSs) have been developed using reliable parameters, modern statistical computing, and radiographs of different joints.15–18 To create a new system, an outcome variable, termed a “skeletal maturity standard,” must be selected for calibration of the system. Developing an SMS using the peak height velocity (PHV) skeletal maturity standard leads to more accurate SMS calibration than chronological age. 19 However, PHV is a very difficult skeletal maturity standard to use as it requires obtaining frequent height measurements over a long period of time to mathematically model the velocity of growth. 19 Obtaining so many height measurements is rarely feasible in an outpatient setting, where heights are usually recorded on a yearly basis.20–22
Recently, 90% of final height (90% FH) was identified as a reliable reference point in growth that may be easier to implement on longitudinal data sets compared to PHV.18,19 Age at PHV and 90% FH occur at nearly the same time and thus are thought to be equivalent. 19 Importantly, determining 90% FH requires much less computation and fewer height measurements than PHV.18,19 Skeletal maturity systems developed using the 90% FH standard have had promising performance to date. For example, the modified Fels knee and wrist systems developed with a 90% FH standard have both been found to estimate skeletal maturity more accurately than GP.16,17,22,23
Given the ease of use and presumed equivalence to PHV, our group has developed newer SMS based on the 90% FH standard, rather than PHV. However, the equivalence of 90% FH to PHV in developing an SMS has not been studied. In this study, we sought to answer the following: (1) Does an SMS developed using 90% FH estimate skeletal maturity as well as it would if it was instead developed using PHV? (2) Does an SMS developed using 90% FH performs as well in lower extremity length prediction as it would it was instead developed using PHV?
Materials and methods
The Institutional Review Board (IRB) approval was obtained for this study. There are no human participants in this article, and informed consent is not applicable.
Source data sets
We first queried the Bolton–Brush collection, a prospectively collected longitudinal study on healthy child growth that was conducted with predominantly middle- to upper-class Caucasian children primarily from 1929 to 1942. We utilized a Bolton–Brush database of 326 serially obtained, peripubertal antero-posterior (AP) knee radiographs from the 78 subjects with previously reported measurements of 14 Roche–Wainer–Thissen (RWT) knee parameters. This data set was previously reported in development of the Modified Fels system. 22 For each radiograph, the associated sex, chronologic age, and clinical measurements (standing height, tibial length, and femoral length) were recorded. In the original prospective study, standing height was measured free-standing from the vertex of the skull to the floor with an anthropometric rod. Femoral length was calculated by subtracting Knee height from Anterior Iliac Spinous (ASIS) height. 24 Knee height was measured from the superior border of the medial condyle of the tibia to the floor. ASIS height was measured from the highest point on the curve of the anterior superior spine of the ilium to the floor. ASIS height—knee height produced femoral length. Tibial Length (T) was measured in the recumbent position, from the proximal margin of the medial condyle of the tibia to the distal border of the medial malleolus. 24
We used a previously constructed database of age at PHV values determined by fitting each patient’s growth curve to the source data using cubic splines, taking the derivative of fitted growth curves, and extrapolating when necessary. 22 Thirty-eight subjects (133 radiographs; girls 7–15 years, boys 10–16 years) had all necessary data and were included in skeletal age and lower extremity length analyses.
Calculating 90% FH
Completion of growth was defined as less than 1 cm/year (or smaller) difference between the final annual visits. This height was defined as 100% of final height and then used to calculate 90% FH for each subject. Despite meticulous measurement by Bolton–Brush researchers, some variability was noted among repeat height measurement at completion of growth. In cases where the largest standing height measurement occurred at the final Bolton–Brush visit, that value was used as the subject’s final standing height. However, in cases where the subject’s largest standing height measurement did not occur at the final visit, the measurements within 1% of the maximum value were averaged to determine the final standing height.
Following determination of the final standing height (100% FH) of each subject, the age associated with 90% FH was calculated based on the Bolton–Brush visit before and after 90% FH was reached, assuming linear growth between time points. Subtracting the age at which a patient reached 90% FH from the age at which a knee radiograph was taken produced actual “years from 90% FH.”
Question 1: Does an SMS developed using 90% FH estimate skeletal age as well as it would if it was instead developed using PHV?
Please see Figure 1 for an overall schematic of study methods. Chronological age, sex, and the 14 RWT knee parameters were utilized as predictor variables in a linear regression analysis to create a best-fit model that predicts “years from 90% FH” (outcome variable). Statistical analysis was used specifically to account for longitudinal patient data (see Supplemental Material for details).
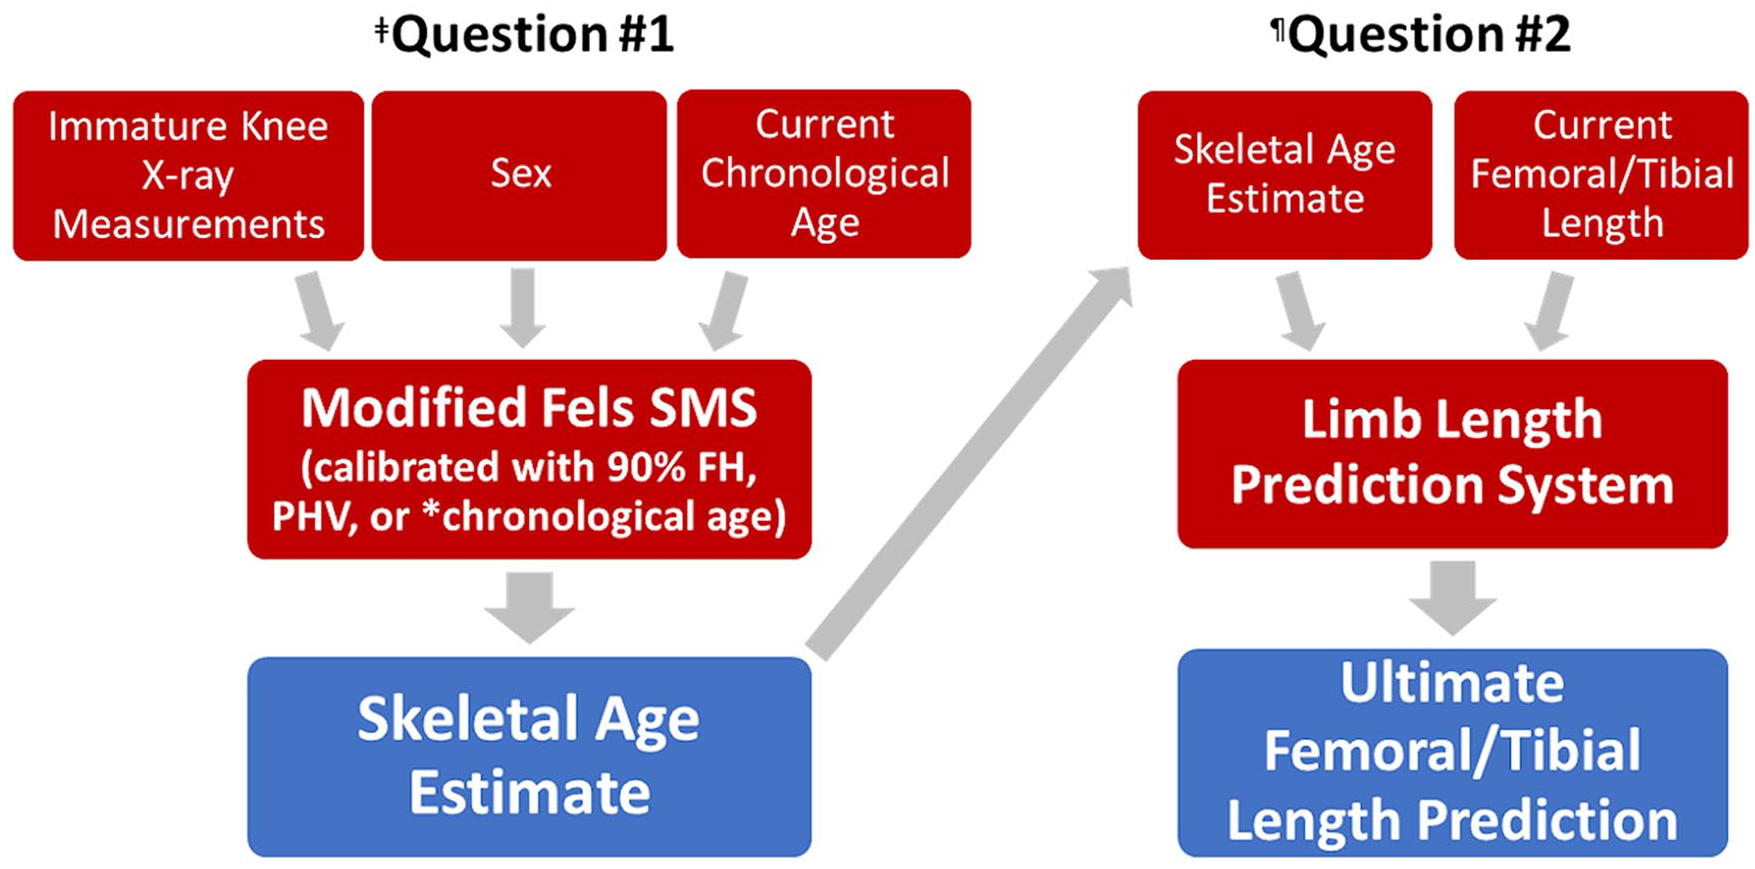
Overall study design.
Next, PHV calibration was applied to the Modified Fels knee SMS parameters. A similar regression model was created using the same predictor variables as the 90% FH model. “Years from PHV” was used as the outcome variable for this model.
To further validate our models, we directly compared them to chronological age. A third variation of the Modified Fels SMS was created using chronological age as the skeletal maturity reference. Chronological age serves as a negative control for 90% FH and PHV SMS, as it is known to be less accurate.25–27 90% FH and PHV models should perform superiorly to chronological age, which is known to be a less accurate measurement of final height.
Evaluation of skeletal age estimation
Each model’s output was converted to a skeletal age estimate. Utilizing the 90% FH model, this was done by adding the model output (years before or after 90% FH) for each subject visit to the average age that all male subjects reached 90% FH (13.1 years). The same process was followed for females (11.4 years) and subsequently repeated for each of the other two skeletal maturity models.
For each radiograph, the parameters and demographics were placed into each model to estimate skeletal age, and then compared to actual skeletal age based on years from 90% FH. The average discrepancy was reported for each model. In addition, the proportion of “outlier” skeletal age estimates with greater than 1-year discrepancy made by each model were compared.
Question 2: Does an SMS developed using 90% FH perform as well in lower extremity length prediction as it would if it was instead developed using PHV?
To further test skeletal ages produced by the 90% FH, PHV, and chronological age models, each were used as inputs for lower extremity length prediction systems. Testing focused on using the White–Menelaus method. 28 This method assumes that total femoral growth is 13.4 mm/year and total tibial growth is 11.1 mm/year. Males and females are assumed to grow until they reach skeletal ages of 16 and 14 years, respectively. 29 For male patients, ultimate femoral length was predicted by the following equation: Final femoral length = Current femoral length + (16 − skeletal age) × 13.4 mm. Skeletal age estimates from each of the three skeletal maturity models were applied to the appropriate sex’s version of the White–Menelaus equation. The accuracy of the resulting femoral/tibial length predictions were compared between skeletal maturity models.
Lower extremity length calculations were further validated with the Multiplier method and Growth Remaining Limb Length Systems (see Supplemental Material).30–32
Results
Question 1: Does an SMS developed using 90% FH estimate skeletal age as well as it would if it was instead developed using PHV?
The 90% FH model produced more accurate estimates of skeletal age than the PHV model with mean prediction discrepancy of only 0.31 ± 0.22 years compared to 0.42 ± 0.37 years (p = 0.01), respectively. Chronological age models performed worse than both systems, with mean prediction discrepancy of 0.61 ± 0.44 years (Table 1) (p < 0.001). Outlier predictions, defined as >1 year from actual age, were only 1.5% in the 90% FH group compared to 9.8% in the PHV group (p = 0.001) and 21.8% in the chronological age group (p < 0.001).
Skeletal age estimation.
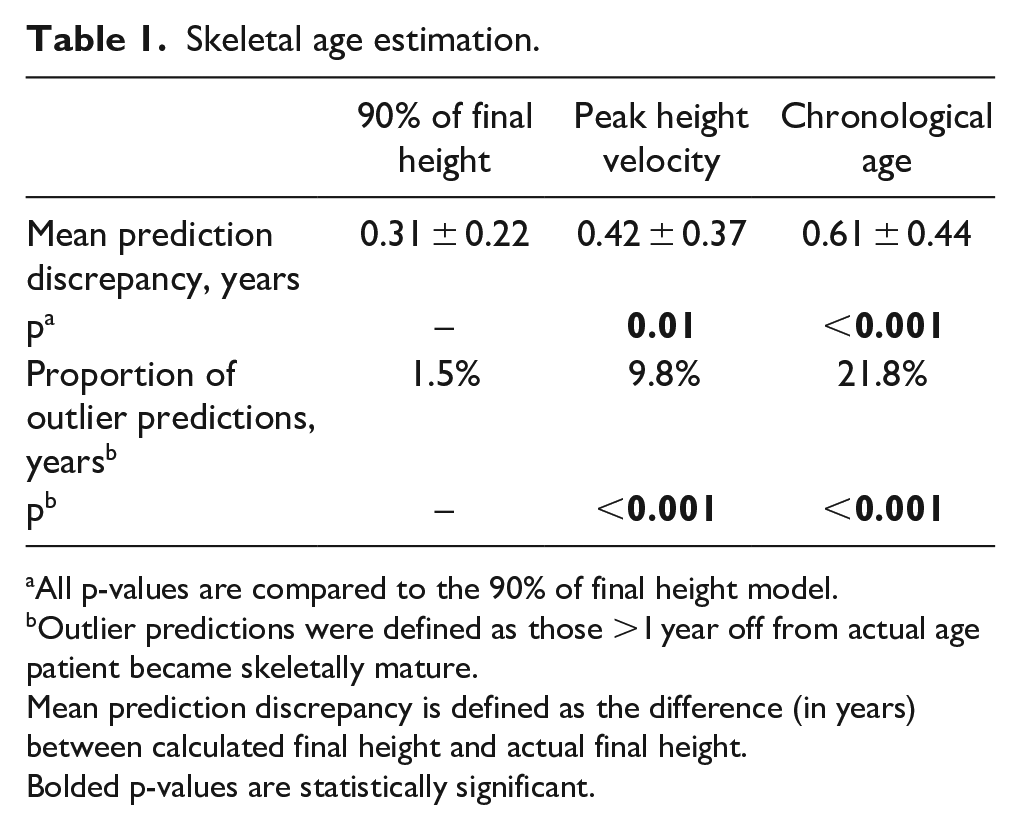
All p-values are compared to the 90% of final height model.
Outlier predictions were defined as those >1 year off from actual age patient became skeletally mature.
Mean prediction discrepancy is defined as the difference (in years) between calculated final height and actual final height.
Bolded p-values are statistically significant.
Question 2: Does an SMS developed using 90% FH perform as well in lower extremity length prediction as it would if it was instead developed using PHV?
When using the White–Menelaus prediction systems, the 90% FH model performed similar to the PHV calibrated models in prediction of femoral length, tibial length, and outlier prediction percentages for both femoral and tibial length. 90% FH and PHV calibration were superior to chronological age calibration for tibial length but not for femoral length (Table 2). These findings were replicated with the Growth Remaining Limb Length System, where tibial length calculations were superior to chronological age with 90% FH and PHV systems, while femoral length calculations did not differ (see Supplemental Material). For the Multiplier method, 90% FH and PHV were superior to chronological age for femoral length calculations, while tibial length calculations did not differ (see Supplemental Material).
Ultimate lower extremity length prediction.
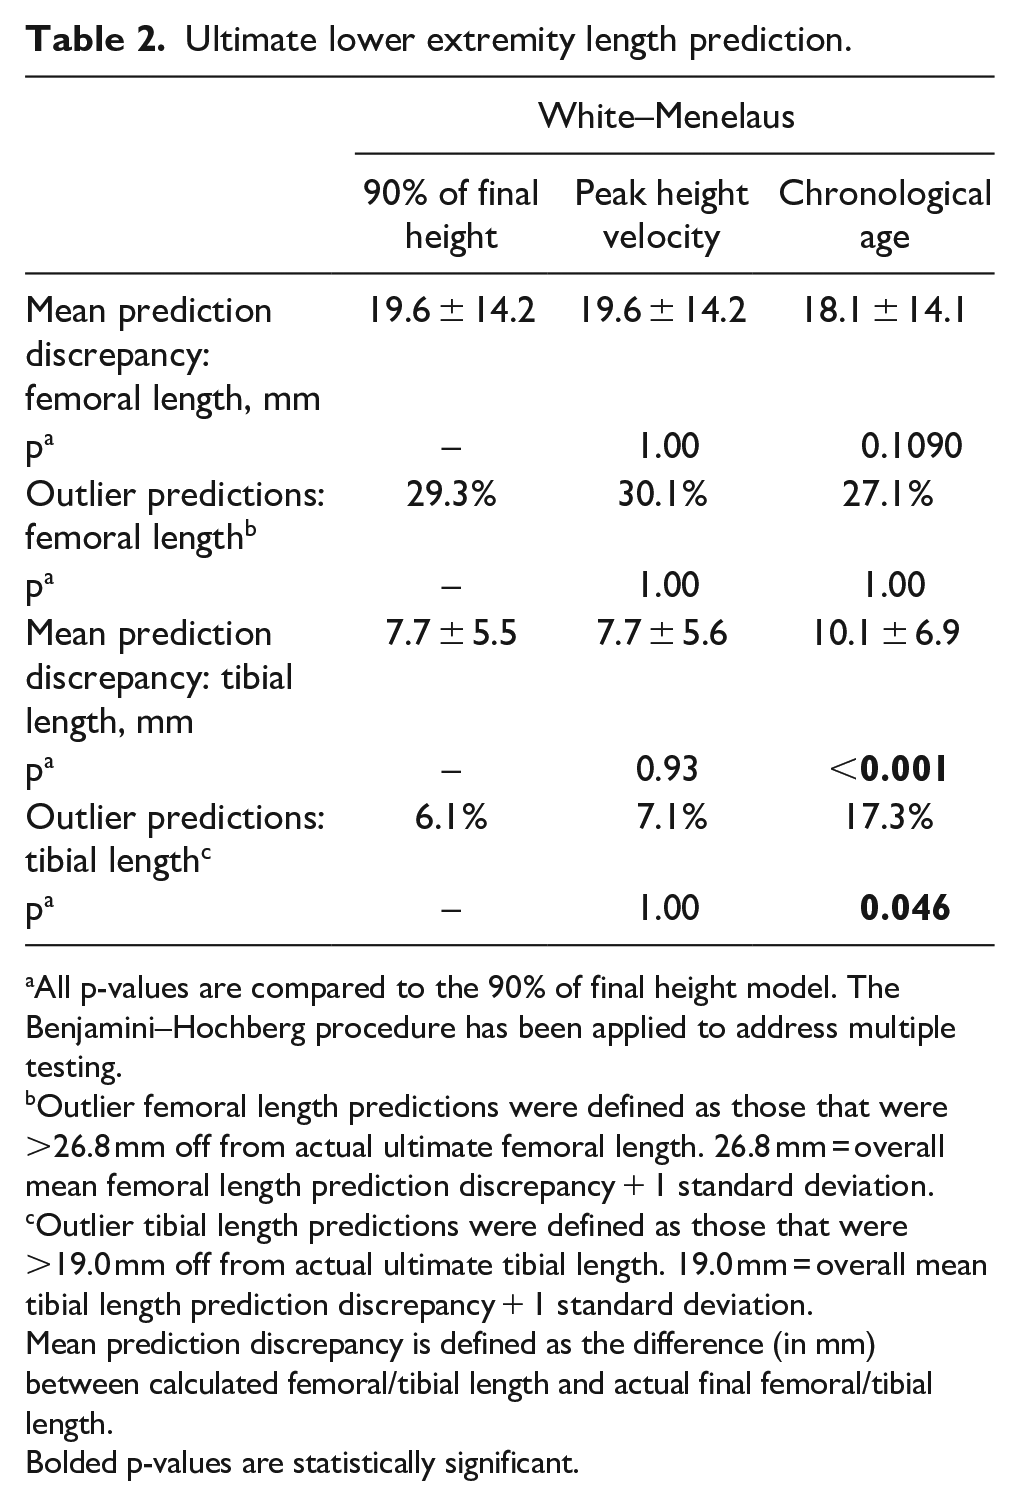
All p-values are compared to the 90% of final height model. The Benjamini–Hochberg procedure has been applied to address multiple testing.
Outlier femoral length predictions were defined as those that were >26.8 mm off from actual ultimate femoral length. 26.8 mm = overall mean femoral length prediction discrepancy + 1 standard deviation.
Outlier tibial length predictions were defined as those that were >19.0 mm off from actual ultimate tibial length. 19.0 mm = overall mean tibial length prediction discrepancy + 1 standard deviation.
Mean prediction discrepancy is defined as the difference (in mm) between calculated femoral/tibial length and actual final femoral/tibial length.
Bolded p-values are statistically significant.
Discussion
This study sought to characterize the performance of 90% FH SMS and PHV SMS in calculating skeletal age (Question 1) and lower extremity length (Question 2). Use of a 90% FH standard created a skeletal maturity system which produced more accurate skeletal ages than PHV. However, since 90% FH values were used to judge the accuracy of both approaches, there was some inherent bias toward it as a standard. Thus, it was important to also test subsequent lower extremity length prediction with the two systems, with equivalent results. Overall, use of a 90% FH standard may potentially outperform PHV but appears to at least perform equivalently. Given that PHV is difficult to calculate due to the complex mathematical modeling required, the use of 90% FH in calibrating a skeletal maturity model is logistically preferable.
The validity of percent final height is also supported by recent literature. O’Marr et al. recognized the need to modernize skeletal maturity systems using modern data and employed a novel approach of retrospectively using existing serial height measurements in modern patients. They chose to analyze the Dimeglio system specifically and were able to demonstrate relatively high correlation (R 2 = 0.79) between Dimeglio skeletal age and 90% FH. 33 Their work supports the ability to modernize skeletal maturity systems based on percent final height.
The inferior performance of the chronological age model in both skeletal age estimation and lower extremity length prediction supports the validity of our results. Chronological age is less useful than other skeletal maturity standards in the treatment of limb-length discrepancy in the peripubertal period, likely due to high variability in timing of the adolescent growth spurt.26,29
This study’s limitations stem primarily from its reliance on a historical data set collected from a predominantly wealthy Caucasian population.19,22 Modern validations of skeletal maturity models have required corrections made along race and sex lines to maintain accuracy in skeletal age estimation.20,34 However, this is a comparative study testing the ability of creating a novel SMS based on 90% FH and PHV. The performance of all three versions of the Modified Fels knee SMS should be equally affected using this data set. Furthermore, the comprehensive nature of Bolton–Brush data set allows for accurate comparison to known serial height data points.
Another study limitation is that in creating our skeletal maturity systems using chronological age for calibration, we were unable to use chronological age as a predictor variable, while we were able to include chronological age as a predictor when calibrating to PHV and 90% FH. This clearly disadvantaged chronological age, but this same disadvantage exists in the real-life development of skeletal maturity systems and so we did not correct for this.
A third study limitation was the relatively poor performance of PHV and 90% FH-based SMS in femoral length prediction when using White–Menelaus (Table 1). Notably, PHV and 90% FH SMS led to more accurate femoral length predictions when applied to the Growth Remaining System or Multiplier method (Supplementary Table 1). Our results contrast with those of Makarov et al., 29 which found that the White–Menelaus system was the most accurate of four lower extremity length prediction systems when predicting ultimate lower extremity length based on GP skeletal age. Although the reasons for these differences in results are not fully clear, one potential cause is that our group relied on clinical femoral length measurements (ASIS height − knee height) while Makarov et al. relied on radiographic lower extremity measurements. Alternatively, the differences may reflect the relatively small data sets for both studies. Future studies assessing limb-length prediction should consider multiple systems to help clarify this discrepancy. Overall, since our objective was to compare different skeletal maturity standards rather than choose an optimal limb-length prediction method, this limitation should not affect our final conclusions.
A final study limitation represents the overall ability to accurately predict leg length. While precautions were taken to standardize the measurements and to minimize variability in this historical longitudinal study, it was not possible to fully eliminate variability in anthropomorphic measurements. Furthermore, without radiographic data, it is hard to define when exactly lower extremity growth reached completion relative to the 90% FH reconciliation point. Overall, the suspected increased variability of our femoral and tibial lengths likely led to less consistency in our results. While the Growth Remaining and White–Menelaus systems showed improved tibial length predictions with no difference in femoral length predictions, the Multiplier method showed the opposite, with improved femoral length predictions. Due to this, the authors recommend exercising precaution when using 90% FH to predict final limb length and especially femoral length.
Ultimately, these data show that modern skeletal maturity systems can be calibrated to 90% FH. While this does not change current clinical practice, especially when predicting limb length, this is an important step toward the development of updated systems based on modern data sets. The Bolton–Brush data set is now nearly 100 years old and does not fully represent the skeletal maturation of modern pediatric populations. New skeletal maturity systems based on current pediatric patients are important for applicability. However, the methodology used in the Bolton–Brush collection cannot be repeated in modern times due to concern for serial radiation exposure to healthy children. 90% FH represents a parameter that not only allows for accuracy comparable to PHV but also can theoretically be done in a modern clinical setting without unnecessary exposure and cost to both clinics and patients alike. This study is an important first step toward identifying a process for calibrating the skeletal age of modern children to create updated skeletal maturity systems.
In summary, use of the 90% FH standard allows for simpler development of skeletal maturity systems than the PHV standard and outperforms chronologic age. Developing SMS using 90% FH allows for accurate calculation of skeletal age and could potentially improve prediction of lower extremity length with improved methodology. These findings will facilitate the development and optimization of improved skeletal maturity systems using longitudinal data sets.
Supplemental Material
sj-docx-2-cho-10.1177_18632521241229954 – Supplemental material for Optimizing calibration of modern skeletal maturity systems
Supplemental material, sj-docx-2-cho-10.1177_18632521241229954 for Optimizing calibration of modern skeletal maturity systems by Ryan J Furdock, Andrew J Moyal, Alexander Benedick, Feng-Chang Lin, Yajing Hao, Daniel R Cooperman, James O Sanders and Raymond W Liu in Journal of Children’s Orthopaedics
Supplemental Material
sj-pdf-1-cho-10.1177_18632521241229954 – Supplemental material for Optimizing calibration of modern skeletal maturity systems
Supplemental material, sj-pdf-1-cho-10.1177_18632521241229954 for Optimizing calibration of modern skeletal maturity systems by Ryan J Furdock, Andrew J Moyal, Alexander Benedick, Feng-Chang Lin, Yajing Hao, Daniel R Cooperman, James O Sanders and Raymond W Liu in Journal of Children’s Orthopaedics
Footnotes
Acknowledgements
The authors thank Naveen Jasty, MD for his assistance with revising a previous version of this manuscript.
Author contributions
R.J.F. contributed to methodology, investigation, formal analysis, and writing—original draft. A.J.M. contributed to methodology and writing—original draft. A.B. contributed to methodology, investigation, formal analysis, and writing—review and editing. F.-C.L. contributed to methodology, formal analysis, and writing—review and editing. Y.H. contributed to methodology, formal analysis, and writing—review and editing. D.R.C. contributed to conceptualization, methodology, and writing—review and editing. J.O.S. contributed to conceptualization, methodology, and writing—review and editing. R.W.L. contributed to conceptualization, methodology, supervision, and writing—review and editing.
Declaration of conflicting interests
The author(s) declared no potential conflicts of interest with respect to the research, authorship, and/or publication of this article.
Funding
The author(s) received no financial support for the research, authorship, and/or publication of this article.
Ethical committee
Institutional Review Board approval was granted at University Hospitals/Case Western Reserve University (IRB 08-14-28). There are no human participants in this article, and informed consent is not applicable.
Supplemental material
Supplemental material for this article is available online.
References
Supplementary Material
Please find the following supplemental material available below.
For Open Access articles published under a Creative Commons License, all supplemental material carries the same license as the article it is associated with.
For non-Open Access articles published, all supplemental material carries a non-exclusive license, and permission requests for re-use of supplemental material or any part of supplemental material shall be sent directly to the copyright owner as specified in the copyright notice associated with the article.