
Abstract
Waterproof dam concrete’s permeability stability in goaf waterlogged environments critically impacts coal mine safety and groundwater sustainability. Underwater immersion, weak infiltration pathways are formed at the joint interfaces of the composite structure (concrete-concrete), potentially triggering water damage incidents. Optimization research on interface anti-seepage performance is urgently required. This study focuses on the composite structure of waterproof concrete dams, analyzing permeability modification by nano SiO2/TiO2/Al2O3 at varying percentages on bi-material specimens post-immersion. Gas permeability, Liquid-measured porosity test, Ultrasonic velocity, and SEM were performed to evaluate the permeability evolution and interface stability of nanomaterial-modified concrete after different days of water immersion. Results indicate that post 14-day immersion, the permeability of ordinary concrete monomer specimens (OC) and bi-material specimens (C-C) increased to 0.236×10⁻⁵μm2 and 0.760×10⁻³μm2, respectively, corresponding to degradation levels of 220.5% and 88.5%. Moreover, the permeability of C-C remained two orders of magnitude higher than that of OC, and their degradation followed a three-stage pattern: rapid amplification, moderate development, and gradual stabilization. Nanomaterial incorporation suppressed permeability deterioration, particularly the 0.5% TiO2 group, showing optimal performance. Post-immersion, the 0.5%TiO2 group showed 0.236×10⁻³μm2 permeability, representing a 69.0% improvement relative to the C-C. Other groups demonstrated modification effects of 55.9% for 0.5%Al2O3, 52.6% for 1.0%Al2O3, 42.1% for 1.0%TiO2, and 24.4% for 0.5%SiO2, while the addition of 1.0%SiO2 exhibited no significant improvement. Liquid-measured and ultrasonic tests showed the 0.5% TiO2 group had 16.4% lower porosity and 14.2% higher wave velocity post-immersion. SEM analysis demonstrated that nano-TiO2 effectively suppressed the expansion of interface cracks, and image binarization processing revealed a 49.6% reduction in fracture surface porosity in the 0.5%TiO2 group, resulting in a denser interface microstructure and enhanced permeability stability. This study establishes key technical foundations for optimizing composite structural materials for waterproof concrete dams, thereby enhancing permeability stability in underground storage facilities and related engineering structures.
1. Introduction
In the process of coal mine resource development in China, the problem of mine water infiltration and discharge has intensified with the continuation of high-intensity extraction activities. In western mining areas, where water resources are scarce, statistics indicate that annual mine water production reaches approximately 8×10⁹ m3, with up to 5×10⁹ m3 wasted due to infiltration deterioration.
1
To address this challenge, a technical approach of storage and utilization of mine water using underground reservoirs of coal mine was proposed. Transforming mined-out areas into underground reservoirs and utilizing waterproof concrete dams for mine water storage and protective use have become key strategies for water resource recycling in coal mines. However, the long-term stability of underground reservoirs largely depends on the impermeability of waterproof concrete dams. Under prolonged water immersion,2,3 the joint interface of the composite structure of waterproof concrete dams (Figure 1) becomes a weak link,
4
making it highly susceptible to infiltration deterioration. This deterioration threatens the safety of mine reservoirs5,6 and may lead to severe water damage accidents in coal mines. Composite structure of underground reservoir and waterproof concrete dam body. (The left panel of the figure refers to reference [7])
The interface of concrete composite structures is a critical factor affecting their durability. 8 To investigate interface properties in depth, at the level of interface characterization, the permeability difference and mechanical-permeability synergy at interfaces such as old-new concrete and rock-concrete9,10 have been systematically quantified using ultrasonic non-destructive testing, 11 static chloride diffusion, 12 argon gas permeation, and diagonal shear experiments.13–15 At the level of permeability mechanism analysis, a series of models, including the stress-permeability negative index model and the interface influence coefficient evaluation model, have been developed.16,17 These models have revealed the influence of key factors such as aggregate gradation, water-cement ratio, and magnetic conductivity on interface properties,8,18 providing an effective theoretical basis for evaluating the interface’s effect on the integrity of composite structures. This has significantly advanced research on the durability and safety of concrete composite structures.
To address the technical challenge posed by the interface as the vulnerable zone in composite concrete structures, extensive research has been conducted on optimizing interfacial permeability. Among these, some studies employed techniques such as directional deposition and zeta potential modulation to regulate the permeability characteristics at the interface of plastic concrete materials.19–21 Other investigations utilized the synergistic effect of alkali activation and mineral admixtures to optimize the pore structure, achieving a certain degree of interfacial modification.22–25 In the field of nano-modification,22,26–29 TiO2 and its novel compounds have attracted attention due to their outstanding physical and chemical properties. Research indicates that new titanium dioxide-based compounds, prepared through optimized processes, exhibit not only high thermal stability but also excellent chemical and water stability. 30 This provides new insights for enhancing material performance in extreme environments. Furthermore, other studies have directly applied spray technologies using nanomaterials or graphene-modified epoxy resin to coat the surface of concrete materials, thereby improving the impermeability of the interface.31–35 The aforementioned research has played a positive role in optimizing concrete interface characteristics. However, certain limitations remain, such as restricted applicability under specific environmental conditions and concerns regarding the long-term performance of the interface. Further optimization and breakthroughs are therefore urgently required.
Current research on the evolution mechanism of interfacial permeability deterioration in waterproof concrete composite structures under waterlogged conditions and the effects of nano-modification remains limited. Once a waterlogged environment forms in the mining area, the impermeability of the concrete dam deteriorates further due to prolonged water immersion. Under long-term water erosion, the joint interface of the waterproof concrete dam composite structure is more prone to forming seepage channels, making it a weak link that induces severe coal mine water damage accidents. Therefore, when investigating the permeability characteristics and structural stability of waterproof concrete dams under waterlogging conditions in mining areas, the permeability evolution of the interface and the optimization of interfacial materials should be considered. This approach provides a more comprehensive understanding of the permeability characteristics of waterproof concrete dams and facilitates the optimization of dam materials accordingly.
Based on this, the present study was conducted by preparing both nano-modified concrete monomer specimens and bi-material specimens. These were compared with ordinary concrete specimens as a control group. To simulate the water-accumulated environment of a goaf, cyclic immersion-drying tests were performed. A comparative analysis was then carried out on the porosity, non-metallic ultrasonic wave velocity, and permeability of the specimens both before and after water immersion. This approach revealed the permeability evolution patterns of different nano-modified concrete materials under the influence of water immersion.
2. Experimental programme design
Mixing ratio of various types of specimens.

Note. 4 specimens per group.
For the monomer specimens, cylindrical specimens of 25mm in diameter and 50mm in length were directly cast using a single type of concrete material. For the bi-material specimens, a semi-cylindrical mold was first placed into the specimen mold. The first concrete material was then cast into the mold. After this material reached a certain strength, the semi-cylindrical mold was removed, and the second concrete material was cast into the remaining space, allowing the two materials to bond tightly. This process produced a complete cylindrical specimen containing an interface. After demolding, the specimens were placed in a curing chamber for standard curing. They were removed after 28 days of curing. After maintenance completed, all specimens were categorized as follows: monomer specimens included the ordinary concrete group (OC), the nano-SiO2 group (MS), the nano-Al2O3 group (MA), and the nano-TiO2 group (MT); bi-material specimens included the ordinary concrete group (C-C), the nano-SiO2 group (C-S), the nano-Al2O3 group (C-A), and the nano-TiO2 group (C-T). The specimen preparation procedure is illustrated in Figure 2. Flow of specimen preparation.
To comprehensively evaluate the interfacial permeability and microstructural evolution characteristics of the concrete specimens, multiple characterization techniques were employed in this study. The main testing systems used in the experiments are illustrated in Figure 3. Following maintenance, specimens were subjected to water immersion treatment in a constant-temperature, constant-pressure water tank at room temperature. Immersion durations were set to 1d, 4d, 7d, and 14d to simulate the long-term soaking effect of water-accumulated goaf environments on concrete dam structures. After the designated days of water immersion, the immersed specimens were thoroughly dried prior to subsequent testing. Experimental test system.
Ultrasonic Wave Velocity Testing: Wave velocity measurements were conducted using a ZBL-U510 non-metallic ultrasonic detector. Before testing, the specimens were thoroughly dried to ensure stable transmission of acoustic waves through the specimen and reliable reception by the transducer. The wave velocity was calculated based on the measured propagation time of the acoustic wave through the specimen, providing an indirect assessment of material compactness and the evolution of interfacial defects.
Permeability measurements were performed on both monomer specimens and bi-material specimens using an STY-2 gas permeability testing system. Before testing, the specimens were thoroughly dried. Permeability was then calculated by applying the measured upstream and downstream pressures and gas flow rates to the standard gas permeability formula.
Liquid-measured porosity was determined using a high-precision electronic balance to measure the saturated-surface-dry weight and oven-dry weight of specimens before and after water immersion. Specimens were first subjected to water immersion for a specified duration in a constant-temperature, constant-pressure water tank at room temperature. After removal, they were thoroughly dried and weighed. The saturated weight was then obtained using the water saturation method.
Scanning Electron Microscopy (SEM) Observation: Microstructural analysis of the specimen interface regions was conducted using a ZEISS GeminiSEM-500 field emission scanning electron microscope. Specimens were sectioned and gold-coated before observation. Imaging was performed under high vacuum conditions at an accelerating voltage of 1kV using a secondary electron detector to obtain micro-morphological images of the interface.
Among the testing methods described above, gas permeability, liquid-measured porosity, and ultrasonic wave velocity tests were applied to both monomer and bi-material specimens. These techniques were employed to comprehensively evaluate the permeability characteristics and compactness evolution of both the interface and the material matrix. SEM observation, in contrast, was primarily focused on the interface regions of bi-material specimens to elucidate the microstructural evolution mechanisms and the modification effects of the nanomaterials. Specimens from the non-immersed group were tested directly after maintenance was completed to provide baseline reference data.
3. Analysis of permeability evolution at interfaces in nano-modified concrete

Gas permeability of the specimen with different immersion days.

Note. The data for each group of specimens in the table is the average of all specimens in this group. Monomer specimens included the ordinary concrete group (OC); bi-material specimens included the ordinary concrete group (C-C), the nano-SiO2 group (C-S), the nano-Al2O3 group (C-A), and the nano-TiO2 group (C-T).
To ensure the reliability of the experimental data, the standard deviations of the permeability data for each specimen group under different days of water immersion are presented in Table 2. These values are used as error bars to represent the data dispersion. The results indicate that, except for the 1.0%C-S group which exhibited relatively large data fluctuations (SD≈0.36∼0.55), the performance differences between the other groups were far greater than the variability within each group. Taking 14 days of immersion as an example, the average permeability of the 0.5%C-T group was 0.236×10⁻³μm2. This represents a 69.0% reduction compared to the OC group. The magnitude of this performance improvement significantly exceeded the fluctuation ranges observed across different immersion stages for all groups. This demonstrates that the modifying effect of nanomaterials on interfacial permeability is statistically significant.
3.1. Concrete interface permeability characteristics
Figure 4 illustrates the evolution trends of permeability over time for OC and C-C under water immersion. The permeability of both specimen types shows an increasing trend with prolonged immersion time, demonstrating a clear positive correlation and continuous deterioration. Notably, The permeability of both specimen types exhibits a three-stage pattern: rapid acceleration, moderate development, and progressive stabilization. Permeability-water immersion time relationship curves for OC and C-C.
To quantitatively characterize the stage-wise evolution pattern, a Logistic mathematical model was established based on the time-series permeability data of the specimen groups. The model expressions for the C-C and OC groups were obtained as equation 2 and equation 3, respectively. Taking the C-C group as an example, the days of water immersion were used as the independent variable in the equation 1 model for permeability prediction. The results show that the goodness of fit for each immersion period was 99.2%, 99.0%, 99.1.0%, 98.5%, and 99.6%. The model predictions closely align with the measured data, with a model goodness-of-fit of R2=0.99. This indicates that the Logistic mathematical model can accurately describe and predict the permeability evolution of specimens under water immersion.

Figure 4 Illustrates a progressive increase in the permeability of both specimen types with prolonged days of water immersion. For the OC, the average permeability before immersion was 0.735×10⁻⁶μm2. After 14 days of immersion, this value increased to 0.236×10⁻⁵μm2, representing a deterioration degree of 221.1%. The average permeability of the C-C before immersion was 0.403×10⁻³μm2. After 14 days of water immersion, this value increased to 0.760×10⁻³μm2, corresponding to a deterioration degree of 88.5%. A further comparison revealed that the permeability of the C-C was approximately 548 times and 322 times higher than that of the OC before immersion and after 14 days, respectively. It is evident that the permeability of the C-C is significantly higher, with the difference consistently maintained at about two orders of magnitude both before and after water immersion.
Based on the permeability evolution patterns of the two specimen types, it can be concluded that under identical water immersion conditions, the permeability of the C-C was significantly higher than that of the OC at all stages. The primary reason for this is that the scale of primary cracks formed at the interface of the C-C is considerably larger than that of the primary cracks within the structure of the OC. Under prolonged immersion, this larger crack scale further intensifies the water-concrete interaction, leading to a substantial decline in the permeability performance of the C-C.
3.2. Effect of nanomaterials on gasometric permeability of the concrete-nanoconcrete interface
The permeability trends of nanomaterial-containing bi-material concrete specimens (SiO2, TiO2, Al2O3) with weight fractions of 0.5% and 1.0% are presented in Figure 5. Under identical water immersion conditions, a positive correlation between permeability and immersion duration was observed for all specimens, mirroring the behavior of ordinary concrete. Similar to C-C, the permeability evolution progressed through three distinct phases: rapid growth, moderate progression, and stabilization. Permeability-water immersion time relationship curve for bi-material specimens.
From the analysis of the figure, the mean permeability of the 0.5% nano-SiO2 bi-material concrete specimens was 0.1863×10⁻³μm2 before water immersion. After 14 days of water immersion, this value increased to 0.577×10⁻³μm2, representing a degradation degree of 209.9%. For the Ti (0.5%) specimens, the mean permeability increased from 0.0953×10⁻³μm2 before water immersion to 0.2360×10⁻³μm2 after 14 days of water immersion, with a degradation degree of 147.5%. For the Al (0.5%) specimens, the mean permeability increased from 0.1207×10⁻³μm2 before water immersion to 0.3370×10⁻³μm2 after 14 days of water immersion, with a degradation degree of 179.3%. This indicates that the permeability of the concrete specimens increased progressively with extended water immersion duration.
A comparison of the different nanomaterial groups reveals that the modification effect of the 0.5% weight percentage was generally superior to that of the 1.0% weight percentage. Among these, the 0.5% nano-TiO2 specimens exhibited significantly lower permeability than the other groups across all water immersion periods, demonstrating the best performance in suppressing permeability degradation. Specifically, the permeability of the 0.5% nano-TiO2 specimens after 14 days of water immersion was 0.2360×10⁻³μm2, representing a 69.0% reduction compared to the bi-material ordinary concrete specimens. In contrast, the permeability of the 1.0% nano-SiO2 specimens was higher than that of the ordinary concrete control group across all periods, indicating no significant improvement in interfacial permeability.
In summary, the short-term permeability degradation of the nano-modified bi-material concrete specimens under water immersion was relatively pronounced, primarily occurring within the first day of immersion (the rapid increase reflects the low initial permeability). Over the long term, the degradation rate was essentially comparable to that observed for ordinary concrete. It is worth noting, however, that except for the 1.0% C-S group, the permeability of the other nano-modified bi-material concrete specimens was significantly lower than that of the ordinary concrete bi-material specimens.
4. Characterisation of permeation-related features of the concrete-nanoconcrete interface
4.1. Effect of nanomaterials on concrete porosity
Before permeability testing, measure the saturated water weight of various specimens and perform the Liquid-measured method porosity test on the specimens.
Porosity of the specimen with different immersion days.

After obtaining the saturated water weight value, dry weight, density, and other parameters of the specimen, the porosity of the specimens was calculated using equation 4.
37

The evolution of porosity in bi-material specimens during water immersion is illustrated in Figure 6. After 14 days of water immersion, the porosity of the C-C has significantly increased, with an average porosity increase of 43.0% compared to when the maintenance of the specimens was completed. Comparison of porosity of specimens after immersion in water.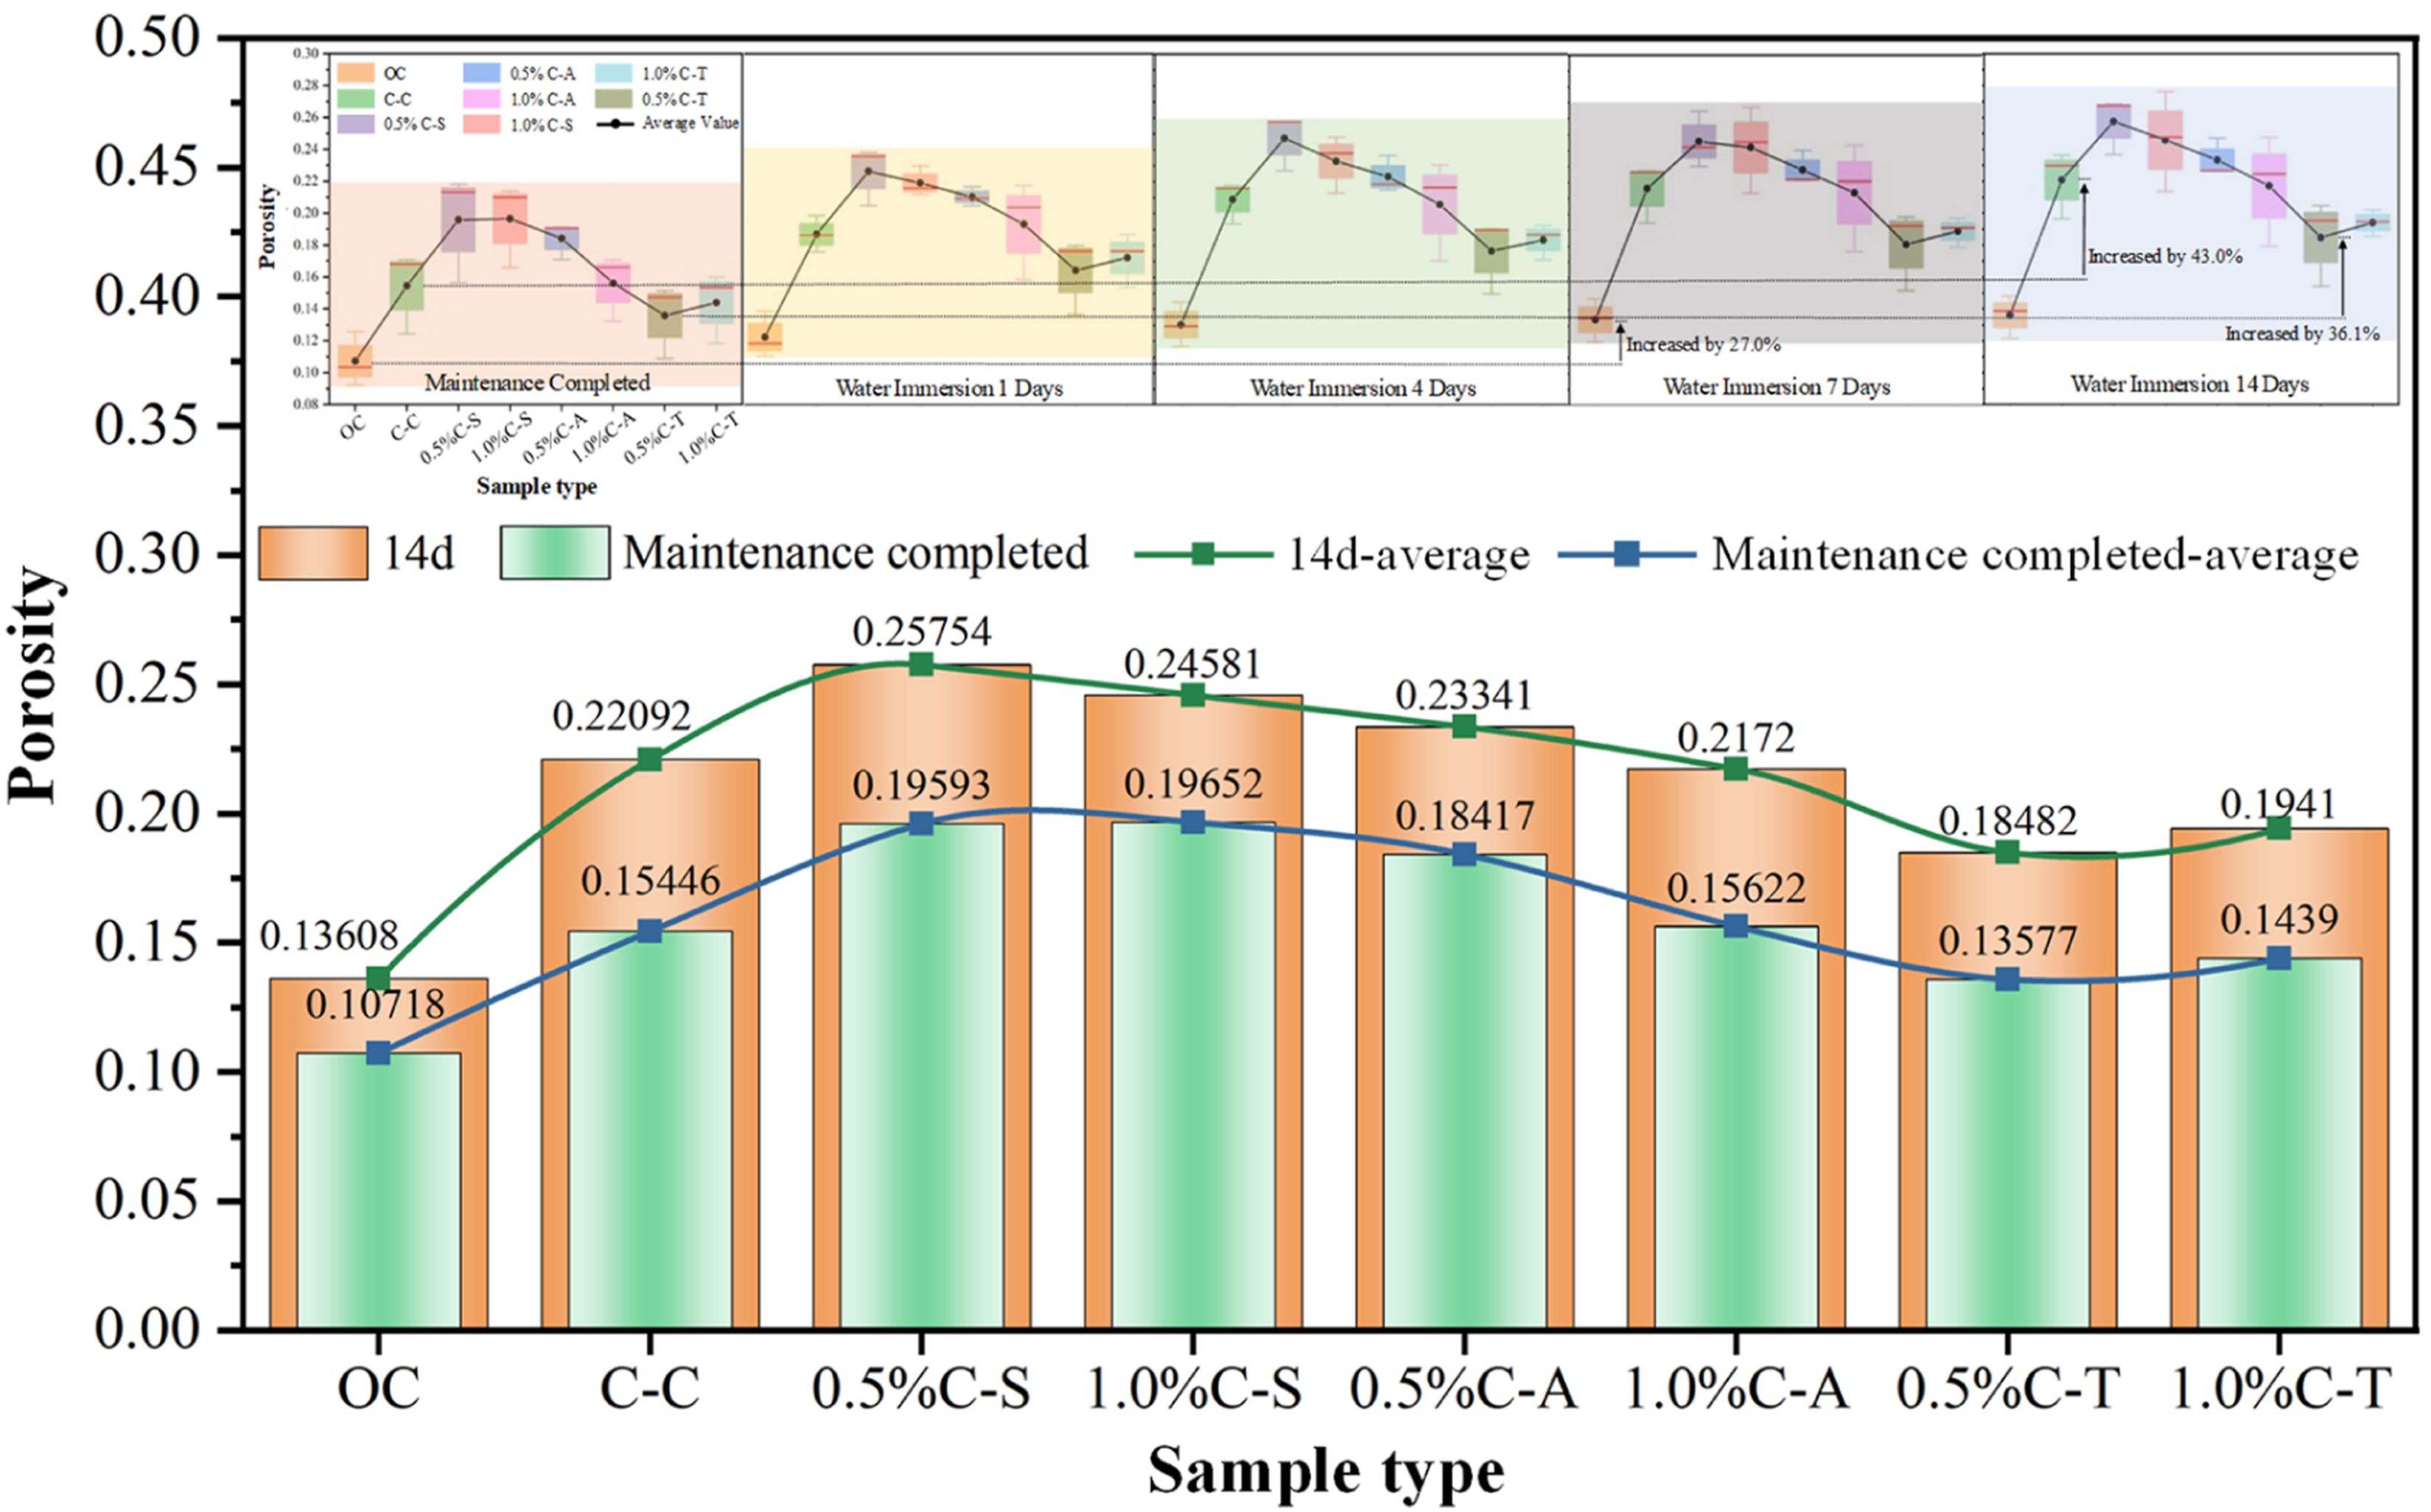
Following 14 days of water immersion, an increase in porosity was observed in bi-material specimens modified with nanomaterials, though the magnitude of this increase varied by nanomaterial type. For C-S, porosity increased by 25.1%-31.4%, with post-immersion values 13.85% higher on average than C-C. Therefore, from the perspective of the porosity of the material, it can be considered that the addition of SiO2 has a deteriorating effect on the reduction of the porosity of the material. However, after long-term water immersion, the addition of SiO2 will slow down the development rate of the porosity. The porosity of C-A increased by 26.7%-39.0%, and the porosity after water immersion was similar to that of C-C, with an average difference of 2.8%, indicating that it did not show a significant modification effect on porosity. In contrast, C-T showed a 34.9-36.1% porosity increase during immersion but achieved a 14.3% lower final porosity than C-C, confirming its efficacy in long-term porosity reduction.
Results confirm clear pore structure modification differences between concrete nanomaterial modifications. SiO2 played a role in aggravating worsening increases in porosity, while Al2O3 exhibited limited influence. In contrast, TiO2 was observed to optimize the pore structure under prolonged water immersion. Worth noting, addition with 0.5%C provided the best results at porosity reduction and increased interfacial strength. The post-immersion porosity was reduced by approximately 16.4% compared to C-C, indicating its efficacy in refining pore characteristics.
4.2. Effect of nanomaterials on wave velocity in concrete
Wave velocity of the specimen with different immersion days.

Upon completion of maintenance, the OC exhibited an ultrasonic wave velocity of 2.2058km/s with a propagation time of 22.4067µs. In contrast, C-C showed a velocity of 2.0930km/s and a propagation time of 23.9433µs. By comparing the wave velocities of specimens with different materials and mix ratios, it was found that the incorporation of 1.0%SiO2 reduced the wave velocity to 2.0488 km/s and increased the wave transmission time to 24.3667 µs. This velocity represents the minimum value among all tested specimens. Compared with the data from the C-C, the addition of SiO2 had a deteriorating effect on the wave velocity, and this deterioration intensified with an increased dosage of SiO2. Conversely, the incorporation of 0.5%TiO2 increased the wave velocity to 2.4023km/s and decreased the transmission time to 20.880µs, which was the maximum velocity recorded. The comparison indicates that TiO2 incorporation had a significant improving effect on the wave velocity. However, this modifying effect diminished as the dosage of TiO2 increased.
To investigate the effect of nanomaterials on the internal structural compactness of specimens under water immersion, Figure 7 presents a comparison of the average wave velocity evolution of monomer specimens and bi-material specimens at different stages of water immersion. As shown in the figure, water immersion led to a decreasing trend in wave velocity for all specimens, although the extent of the decrease varied depending on the type and weight percentage of the nanomaterial. When not submerged in water, the average wave velocity of the monomer ordinary concrete specimens was 2.2058km/s, while that of the bi-material ordinary concrete specimens was 2.0931 km/s. After 14 days of water immersion, these values decreased to 2.1017km/s and 1.8215km/s, respectively. The incorporation of nanomaterials significantly influenced wave velocity variation. After 14 days of water immersion, the wave velocity of the 0.5% nano-TiO2 group increased to 2.1352km/s, with the wave propagation time increasing to 23.4933µs. This group exhibited the highest wave velocity among all tested specimens, representing an 11.11% decrease compared to its pre-immersion value. For the 0.5% nano-SiO2 group, the wave velocity decreased to 1.7901km/s, with the wave propagation time increasing to 27.980µs. This group showed the lowest wave velocity among all tested specimens, corresponding to a 14.83% decrease relative to its pre-immersion value. It is noteworthy that although nano-TiO2 incorporation significantly improved wave velocity, the 1.0% weight percentage resulted in the greatest degree of weakening, with a 17.3% decrease compared to the pre-immersion value. Comparison of wave velocity of specimens after immersion in water.
It can be concluded that water immersion erodes the specimen structure. This effect is particularly pronounced in bi-material specimens due to the presence of an interface. Water immersion accelerates the development of both the interface and pores within the specimen, leading to the generation of more internal pores. During ultrasonic testing, the sound waves are forced to travel around the interface and numerous internal pores to reach the receiving transducer. This results in an increased propagation path and a longer measured wave transit time, consequently causing a further reduction in the calculated wave velocity. Therefore, it is evident that the interface of bi-material specimens undergoes significant weakening under prolonged water immersion. In contrast, the bi-material concrete specimen incorporating 0.5%TiO2 demonstrated superior performance in both wave velocity and transit time compared to other specimens. This specimen exhibited enhanced compactness, fewer internal pores, and consequently, a greater advantage in improving the impermeability of the bi-material specimen.
5. Structural characterisation of microscopic nano-modified concrete bi-material (interface) specimens
To investigate the effects of water immersion on the permeability characteristics of bi-material specimen interfaces, two analytical approaches were adopted. First, macroscopic crack evolution at the interface under water immersion (quantified by days of water immersion) was systematically observed. This revealed the structural deterioration mechanism at the macroscopic scale. Subsequently, scanning electron microscopy (SEM) was employed to examine microstructural degradation features, including micro-cracks and pore structures. These observations provided critical support for understanding the evolution mechanism of interfacial permeability in bi-material concrete specimens.
To observe macro-crack evolution at the interface of bi-material specimens (1.0%C-T and C-C) during water immersion, black circles were used to mark initial cracks formed after maintenance completion, while yellow circles indicated newly generated cracks post-immersion, as illustrated in Figure 8. Macro-cracks were observed near the interface of 1.0%C-T after immersion treatment. The crack quantity increased progressively, primarily propagating from the tips of initial cracks as days of water immersion extended. Following water immersion, microcracks and pores emerged at the interfacial region. With prolonged immersion, interfacial damage in C-C intensified. After 7 days of water immersion, pre-existing defects underwent further deterioration, resulting in interfacial fracture and eventual complete structural failure. Compared to 1.0%C-T under identical immersion conditions, C-C exhibited more severe interfacial damage and significantly greater deterioration of impermeability. Macroscopic crack evolution characteristics of the bi-material specimen during water immersion treatment.
Depicted in Figure 9 is the SEM morphology of interfacial fractures within bi-material specimens following 14-day water immersion. As shown, the fracture surface of the C-C exhibits numerous and relatively large pores. The particles appear loosely arranged, resulting in a porous and loose structure. In contrast, the nano-modified concrete specimens display a denser structure with fewer micro-cracks and pores, as well as a higher degree of cementation. This enhancement in compactness is particularly pronounced at the interface and fracture surface of specimens incorporating 0.5%TiO2 and Al2O3. The primary reasons for this improvement can be attributed to three aspects. Firstly, the small particle size of nanomaterials enables them to fill the internal pores of the concrete and reduce fracture cracks formed at the interface. Secondly, due to their high surface energy, nanomaterials can promote or participate in the hydration reaction of cement. This reaction consumes excess Ca(OH)2 and generates more C-S-H gel. Thirdly, a greater abundance of pores and cracks within the specimen structure and at the fracture surface facilitates more extensive water-concrete interaction under immersion. Following water erosion, both the number and area of these pores increase, further accelerating structural deterioration and the transition from a dense to a porous, loose structure. Therefore, the incorporation of nanomaterials effectively improves the degree of cementation between particles both within the structure and at the interface, thereby enhancing the compactness of the specimens. SEM image of the interface fracture of the bi-material specimen.
To further analyze the modification effect of nanomaterial doping on specimen interfaces under water immersion conditions, SEM images of fractured bi-material specimen interfaces were analyzed. ImageJ software was employed for pore identification and quantitative analysis of fractures. Binarization was applied to import pore images, with thresholds set for noise removal. Automatic pore segmentation was performed to output geometric parameters and statistical data. Vector diagrams and rose charts were generated to visualize the results. Figure 10 displays binarized images of different bi-material specimens processed through ImageJ. Black regions indicate non-porous areas, while white regions represent pore structures. Binary image of the interface fracture of the bi-material specimen.
Quantitative comparison of interfacial porosity between nanoparticle-modified and unmodified bi-material specimens is displayed in Figure 11, with measurements conducted post water immersion. After 14 days of water immersion, C-C exhibited the highest porosity (26.23%); 0.5%C-T showed the lowest porosity (13.22%). Porosity reductions compared to C-C: 1.0 %C-S: 7.53%; 0.5%C-S: 15.7%; 1.0%C-T: 32.6%; 1.0%C-A: 38.8%; 0.5%C-A: 45.9%; 0.5%C-T: 49.6%. The incorporation of nanomaterials (particularly 0.5%C-T) was found to significantly enhance interface densification and improve adhesion between cemented particles, thereby increasing bi-material specimen impermeability. Porosity of fracture end surface at the interface of the bi-material specimen.
Changes in the microstructure of specimen interfaces are induced by nanomaterials, resulting in macroscopic modifications. After water immersion, the incorporation of nanomaterials can significantly reduce the original defects at the interfacial fracture, prevent the influx of more water at the interfacial fracture, inhibit the occurrence of water-concrete action, and further control the interface of the specimen and the structure of the internal pore expansion, Crack propagation and connection and reduce the porosity of the specimen, so that the impermeability at the interface of the specimen is effectively improved under the modification of the nanomaterials.
6. Discussion
6.1. Mineral composition and slump of concrete
6.1.1. XRF mineral composition testing
Mixing ratio of various types of specimens.

6.1.2. Concrete slump test
The slump of fresh concrete is a key parameter reflecting its pumpability. Based on the slump value, fresh concrete can be categorized into plastic concrete (slump: 10-90mm), flowing concrete (slump: 100-150mm), and highly flowing concrete (slump≥160mm).
39
To clarify the influence of nanomaterials on concrete fluidity, slump tests were conducted on all modified concrete types in this study Figure 12. Concrete slump test.
Slump test results indicated that the workability of fresh concrete was significantly influenced by the type and dosage of nanomaterials. The control group (OC) had a slump of 170mm, classifying it as highly flowing concrete. The incorporation of 0.5%TiO2 increased the slump to 183mm, demonstrating an improving effect. In contrast, a 1.0% dosage reduced the slump to 147mm, which falls into the category of flowing concrete. For the Al2O3 groups (0.5% and 1.0%), the slump values were 162mm and 166mm, respectively. Both are classified as highly flowing concrete, showing values close to the control group. The most pronounced effect was observed with SiO2. At a 0.5% dosage, the slump decreased to 130mm (flowing concrete). When the dosage was increased to 1.0%, the slump further dropped to 85mm, placing it within the range of plastic concrete. In summary, the slump of all nano-modified concretes ranged between 85and 183mm. All mixtures exhibited good flowability, meeting the requirements for pumpability in practical engineering applications.
6.2. Microstructure of concrete specimens
A comparative analysis of surface characteristics between bi-material and monomer specimens is presented in Figure 13. Macroscopically, homogeneous surface morphology is exhibited by C-C, where interfacial characteristics are not readily distinguished. Under low magnification (×10), the specimen surface only reflects the overall pore and weak crack distribution, and the interfacial effect is more obscure and cannot easily be judged. However, through the application of scanning electron microscopy (SEM) at high magnification (×200), the microstructural features within the specimen can easily be revealed, especially the significant cracks across the interface. These cracks extend along the interfacial region and form continuous microscopic permeation channels, significantly increasing the potential for fluid transport within the material and thus undermining the overall impermeability of the material. This permeable crack network not only reduces the tightness of the composite structure but can also continue to extend under long-term water immersion, inducing a continuous deterioration of the impermeability of the composite structure and thus significantly influencing the impermeability and stability of the structure. Comparison of the surface of the OC and C-C specimens.
7. Conclusion
(1) The interfacial permeability deterioration of specimens under water immersion proceeded through three dynamic stages: rapid acceleration, moderate development, and progressive stabilization. During the progressive stabilization stage (after 14 days of immersion), the permeability of OC increased to 0.236×10⁻⁵μm2, representing a deterioration degree of 220.5%. The permeability of C-C increased to 0.760×10⁻³μm2, representing a deterioration degree of 88.5%. However, the permeability of OC remained two orders of magnitude lower than that of C-C, both before and after immersion. (2) The permeability modification effects of SiO2, TiO2, and Al2O3 nanoparticles at varying weight percentages on bi-material concrete specimens were comparatively analyzed. Results indicated that after 14 days of water immersion: Incorporation of 1.0%C-S showed no significant permeability improvement; The 0.5%C-T achieved a permeability of 0.236×10⁻³ μm2, representing a 69.0% reduction compared to the C-C; Subsequent improvements were observed in: 0.5%C-A (55.9%), 1.0%C-A (52.6%), 1.0%C-T (42.1%), and 0.5%C-S (24.4%). TiO2 demonstrated notable suppression effects on permeability deterioration in bi-material concrete specimens. (3) Following 0.5% TiO2 incorporation, bi-material specimens exhibited 16.4% lower liquid-measured porosity and 14.2% higher ultrasonic wave velocity than C-C after 14 days of water immersion. This treatment not only significantly reduced liquid-measured porosity in bi-material specimens but also revealed a distinct downward porosity trend compared to C-C. Such pore structure optimization substantially enhanced interfacial compactness in the bi-material specimens. (4) Water immersion caused further crack propagation at bi-material concrete interfaces. Combined SEM imaging and binarization processing revealed that TiO2 incorporation effectively suppressed crack development. The 0.5%C-T exhibited 49.6% lower porosity than C-C.
Footnotes
Consent for publication
All authors agreed with the content that all gave explicit consent to submit and that they obtained consent from the responsible authorities at the institute/organisation.
Author contributions
Yijia Li: Writing-review & editing, Formal analysis, Software, Laboratory experiment; Xianjie Hao: original draft, Supervision, Funding acquisition; Yuguang Chen: Methodology, Investigation, Laboratory experiment; Huaixiang Yang: Conceptualisation, Visualisation; Hang Li: Methodology, Project administration; Tian Pang: Supervision, Software; Xinyu Gao: Investigation.
Funding
The authors disclosed receipt of the following financial support for the research, authorship, and/or publication of this article: This work is supported by the Technology Transfer Program of Inner Mongolia Research Institute, China University of Mining and Technology, Beijing (Grant No. IMRI23008), Open Fund of State Key Laboratory of Water Resource Protection and Utilization in Coal Mining (Grant No.GINY-20-113-05).
Declaration of conflicting interests
The authors declared the following potential conflicts of interest with respect to the research, authorship, and/or publication of this article: We declare that we have no financial and personal relationships with other people or organizations that can inappropriately influence our work, and there is no professional or other personal interest of any nature or kind in any product, service and/or company that could be construed as influencing the position presented in, or the review of, the manuscript entitled ”Interfacial permeability evolution and nano-modification effect of ”Concrete-Nanoconcrete“ bi-material under water immersion”. We have reviewed the final version of the manuscript and approved it for publication. To the best of our knowledge and belief, this manuscript has not been published in whole or in part, nor is it being considered for publication elsewhere.
Data Availability Statement
The author promises that all data are real and available. All analysis and curve data are in the paper. If you need more detailed data to be confirmed, please contact the author by email.