
Abstract
Cuprous oxide nanometer thin-film electrodes of different structures were successfully prepared by electrochemical deposition. The structures and properties of the samples were characterized by X-ray diffractometer, ultraviolet–visible and scanning electron microscope. The cuprous oxide thin-film electrode was used as a non-enzymatic glucose sensor, and the electrocatalytic response of the sensor for glucose was investigated by cyclic voltammetry. Results showed that cuprous oxide with higher purity, neat morphology structure and uniform grain size was prepared. The cuprous oxide nanometer thin-film sensor with a sword-shaped dendrite has a good response to glucose. Moreover, it has a good linear relationship of 1–20 mg·L−1 in the range of glucose concentration, a correlation coefficient of 0.997, a detection limit of 0.337 mg·L−1, a sensitivity of 23.24 mA·cm−2·mM−1 and good stability. Therefore, it has potential for application in sensors.
Introduction
As a kind of simple sugar, glucose plays an important role in the human body. At present, in the measurement of the human body’s glucose content, the main application is the biological sensor. 1,2 However, it is difficult to meet a sensor’s requirement of low concentration and high sensitivity. 3,4 There have been some reports on the methods of determining glucose content, such as spectrophotometry, 5 high-performance liquid chromatography, 6 ultraviolet–visible (UV–Vis) spectroscopy, 7 capillary electrophoresis 8 and so on. The operating process of these methods is complex and analysis speed is slow. Therefore, researchers have sought a method which is fast and accurate to detect glucose. Thus, because of its simple, fast and accurate analysis, electrochemical sensors have become an object of research focus. For enzyme glucose electrochemical sensors, glucose oxidase has specificity. However, glucose oxidase is a kind of protein that has many restrictions, such as temperature, pH and other toxins, which can affect the enzymatic activity and thus the measurement accuracy. 9 Therefore, it is of great significance to develop a non-enzymatic glucose sensor.
At present, electrochemical sensors are mainly made of semiconductor nanomaterials, such as zinc oxide, 10,11 tin dioxide, 12 cuprous oxide (Cu2O) 13 and so on. Compared to other semiconductor materials, Cu2O semiconductor nanomaterials have been applied in various fields as a narrow band gap material, 14 such as photocatalytics, 15 solar batteries, 16,17 lithium-ion batteries, 18 sensors 19 –21 and so on, but it is also easy to prepare. 22 In addition, Cu2O nanomaterials have good characteristics, including a very large surface area and interface, high sensitivity to external environmental changes, stability, a remarkable redox process and low cost. Electrodes based on Cu2O have shown high electrocatalytic oxidation ability for glucose, 23 and Cu2O is attracting significant attention for sensor applications for glucose detection. Meng et al. 24 prepared a Cu2O cube and explored the use of the Cu2O as a sensor, which exhibited a good response to hydrogen peroxide. However, this property depended on a certain size of Cu2O. Yuan et al. 25 prepared a Cu2O/NiOx/GO-modified glassy carbon electrode by electrodeposition. The prepared electrode has high catalytic activity for reducing glutathione and glucose due to the synergistic effect of Cu2O and NiOx, and the use of spherical Cu2O resulted in higher electrocatalytic activity than octahedral Cu2O. Luo et al. 26 discovered that Cu2O could be deposited on copper–aluminium foil by electrodeposition, and the resulting Cu2O/Cu electrode was applied in a non-enzymatic glucose sensor. Zhang et al. 27 prepared a Cu2O microcube that was used as a non-enzyme current sensor to detect glucose in alkaline condition; its sensitivity was −70.8 μA mM−1. At present, Cu2O non-enzyme glucose sensors still have some deficiencies, such as complicated detection conditions, a narrow detection range and low sensitivity. Therefore, the study of Cu2O non-enzymatic glucose sensor is necessary.
In the work reported in this article, a Cu2O thin film was prepared by electrodeposition and used as a non-enzymatic glucose sensor electrode to test electrochemical performance for glucose. The sensor showed the characteristics of a wide detection range and high sensitivity.
Experiments
Preparation of Cu2O thin film
Cu2O thin films were prepared in different electrolytes by electrodeposition using the three-electrode system, in which a saturated calomel electrode was the reference electrode, indium tin oxide (ITO) conductive glass was the working electrode and a platinum electrode was the counter electrode. 28,29
In order to investigate the effect of Cu2O thin-film morphology on their properties, three different electrolyte systems were selected to prepare the Cu2O thin films. Electrolyte 1 was composed of 15 mmol L−1 copper acetate (Analytical reagent [AR]; Tianjin Fuchen Chemical Reagent Factory, China) and 0.10 mol L−1 acetic acid (AR; Tianjin Tianli Chemical Reagent Co., Ltd, China) with distilled water. Electrolyte 2 was composed of 15 mmol L−1 copper acetate and 0.10 mol L−1 lactic acid (AR; Tianjin Fuyu Fine Chemical Co., Ltd, China) with distilled water. The pH of electrolytes 1 and 2 was adjusted to 4.9 with 5 mol L−1 of sodium hydroxide (NaOH) solution (AR; Tianjin Hongyan Chemical Reagent Factory, China). Electrochemical deposition was carried out in both electrolytes successively, for which the deposition potential was −0.12 V and the electrolyte stirring speed was 100 r min−1. The entire electrodeposition process should be carried out at 25°C for 60 min, and then the prepared samples were washed and dried to obtain S1-Cu2O and S2-Cu2O thin films, respectively. Third electrolyte composition was 30 mmol L−1 copper acetate and 3.0 mol L−1 lactic acid with distilled water, and its pH was adjusted to 11.0 with 5 mol L−1 of NaOH. The deposition potential was −0.48 V, the stirring speed of the electrolyte was 100 r min−1 and the film was deposited at 25°C for 60 min, after which a S3-Cu2O thin film was obtained.
Characterization of Cu2O thin film
The crystal structure of Cu2O thin film was measured by a 6100-type X-ray diffractometer (XRD; Shimadzu, Japan) with CuKα radiation (λ = 1.5406 Å). The drive axis was θ–2θ; the applied current and voltage were 30.0 mA and 40.0 kV, respectively. And the scan speed, sampling pitch and preset time were 5 θ min−1, 0.02 θ and 0.12 s, respectively. The surface morphology of Cu2O thin film is characterized using a VEGA3 scanning electron microscope (SEM; Tescan, Czech Republic). The photoelectric properties of Cu2O thin film were examined using a UV-3600 UV–Vis spectrophotometer (Shimadzu, Japan), the samples were tested with barium sulfate for reference substances and the integrating sphere was used as the optical signal collector. The electrochemical oxidation performance of glucose was tested on a CHI660D electrochemical workstation (Shanghai Chenhua Co., China).
Electrochemical performance characterization of Cu2O thin film
Electrochemical detection of Cu2O thin film was performed by a three-electrode system. The usable area of Cu2O thin-film electrodes was 20 mm × 15 mm. The catalytic oxidation effect of different electrodes on glucose was characterized by cyclic voltammetry (CV), and the CV scanning speed was 10 mV s−1. The glucose was measured in a 0.10 mol L−1 NaOH solution and the required potential was measured using a Cu2O thin-film electrode as a glucose sensor. Data were then recorded when the current value was stabilized. The response current of different glucose concentrations was studied using the timing current method and the performance of the sensor was detected.
Results and discussion
Electrodeposition mechanism analysis of Cu2O thin film
The samples of the S1-Cu2O, S2-Cu2O and S3-Cu2O thin films were prepared in different acidic and alkaline electrolyte systems by electrodeposition.
In an acidic system, the possible cathode reactions of electrodeposited S1-Cu2O and S2-Cu2O thin films were described as follows 30,31


Both reactions (2) and (3) are influenced by the pH of the solution. Metallic Cu may form according to reaction (3) in a low pH bath solution. Research reports indicate that the pure Cu films can be obtained at a low pH of 1.2. 32 Therefore, electrodeposition of Cu2O can be carried out in a high pH bath solution. In this experiment, when the pH of the electrolyte was 4.9, the pure S1-Cu2O and S2-Cu2O thin films can be prepared. 22,33
In an alkaline system, the lactate ion (L2−) can form complexes ([CuL2(OH)]3−) with Cu2+. Thus, it can prevent Cu(OH)2 precipitation generation. Thus, electrodeposition of Cu2O can be carried out in a wide range of pH. The potential cathode reaction process used in the preparation of S3-Cu2O thin film is described as follows 34


As can be seen from the above reaction equations, high pH is beneficial to reactions (5) and (6). It also has an acceleration effect on reaction (7). In this work, the pH of the electrolyte was 11.0, and the pure S3-Cu2O can be prepared. 29,35
X-ray diffraction analysis
Figure 1 shows the XRD patterns of Cu2O thin films with the characteristic peaks of the Cu2O thin films at 29.55°, 36.42°, 42.30°, 61.34°, 74.40° and 77.75°, in agreement with the data of Cu2O standard JCPDS No. 05-0667, corresponding to (110), (111), (200), (220), (311) and (222) crystal planes. No peaks of impurities were detected in the XRD pattern, and the peak was sharp. This indicates that the Cu2O thin films have good crystallinity and high purity. This is consistent with the results of electrodeposition mechanism analysis. It can be seen from Figure 1 that the (111) plane diffraction peak intensities are larger than other crystal surface of prepared Cu2O thin films, which indicates that the (111) plane has a preferential orientation in growth of Cu2O nanoparticles. Figure 1 shows that the diffraction peak intensities of the three samples were different. The (111) plane diffraction peak intensity of the S3-Cu2O thin film is lower than other samples, and the (220) plane diffraction peak intensity is larger than other samples. The (111) plane diffraction peak intensities of the S1-Cu2O and S2-Cu2O thin films are basically the same, but the (200) plane diffraction peak intensity of the S1-Cu2O thin film is greater than the S2-Cu2O thin film. The (111) crystal plane in Cu2O crystal has better electrochemical performance and stability than all other low index plane, as reported in the literature. 36 –38 Thus, it can be inferred that the S2-Cu2O thin film has better electrochemical performance and stability than the S1-Cu2O and S3-Cu2O thin films.
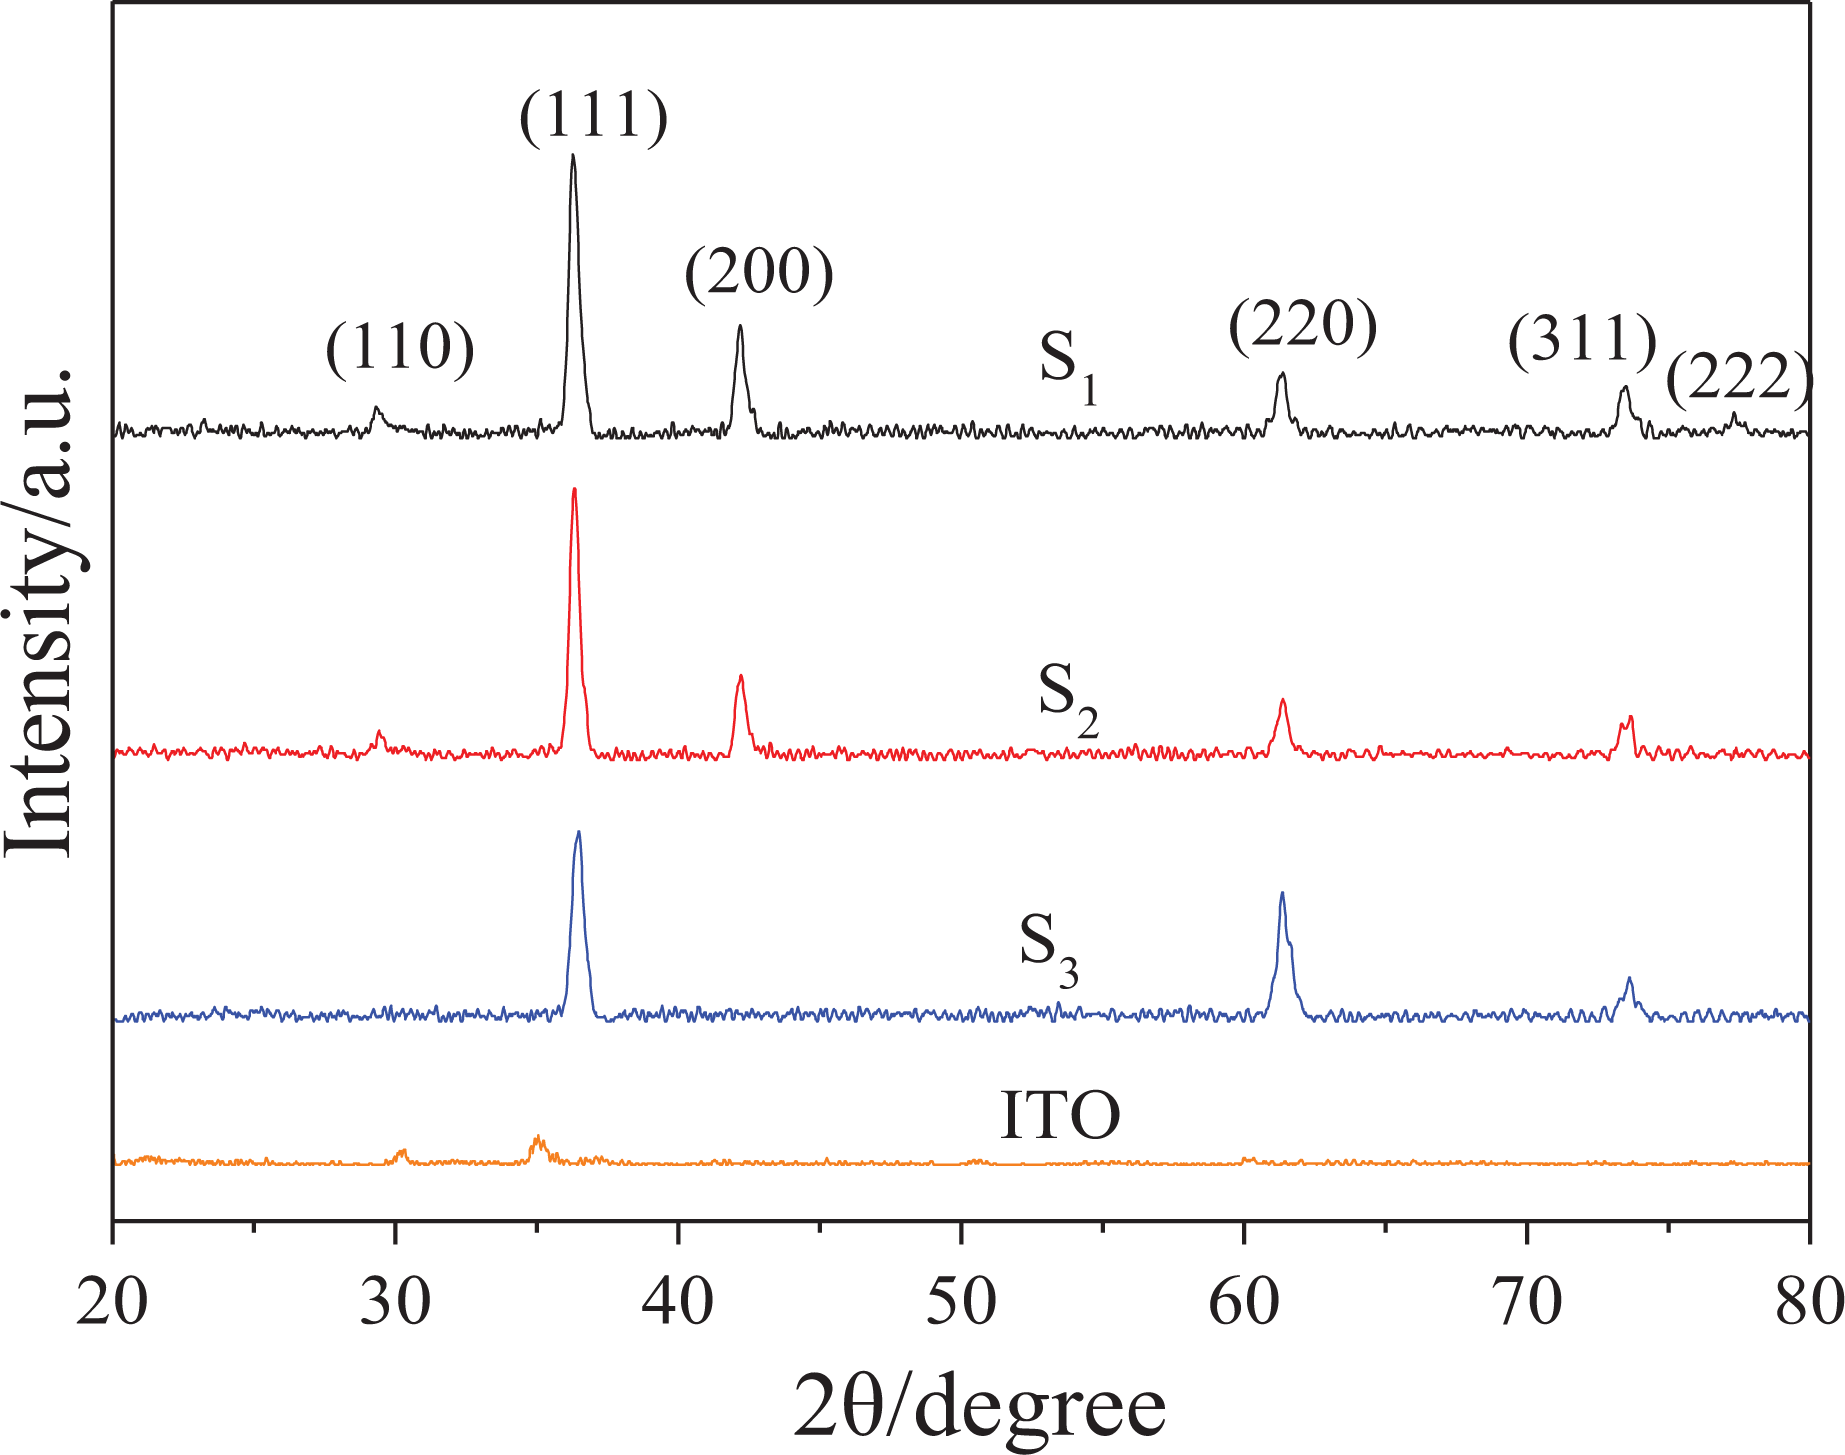
XRD patterns of Cu2O thin films. XRD: X-ray diffractometer; Cu2O: cuprous oxide.
UV–Vis analysis
Figure 2 shows the UV–Vis absorption spectra of Cu2O thin films, and the absorption values of which increased rapidly at 500–600 nm and reached a maximum at 550 nm. The absorption intensity of Cu2O thin films with different morphologies shows obvious differences in the range of 500–600 nm, and the absorption intensity of the S3-Cu2O samples is the highest.

UV–Vis adsorption spectra of Cu2O thin films. UV–Vis: ultraviolet–visible; Cu2O: cuprous oxide.
The band gap of semiconductors can be estimated according to equation (9) 39

where A is the absorbance and K is a constant. For direct band gap semiconductor, m = 1; for indirect band gap semiconductors, m = 4. With Cu2O as a direct band gap semiconductor, m should thus equal to 1 in formula (9). The tangent line of the absorption edge is plotted with photon energy (unit of eV) as the abscissa and (Ahv) 2 as the ordinate. The intersection of the tangent and the horizontal axis is the estimated band gap. The band gaps of the S1-Cu2O, S2-Cu2O and S3-Cu2O thin films are 2.034, 2.040 and 2.036 eV, respectively. The band gap of Cu2O films showed a slight difference, and the band gap of the S1-Cu2O film was smaller. When the band gap is smaller, the scope of the absorption of sunlight is wider. Thus, the analysis of UV–Vis spectrum and energy band gap calculation of the prepared Cu2O thin film reveals that these properties of the Cu2O thin film can be utilized to design optoelectronic devices operating in visible light region. Moreover, it is well known that the Cu2O is a p-type semiconductor and it can also be used for photovoltaic and other semiconducting device applications. 40
SEM analysis
Figure 3 shows the SEM results for Cu2O thin films. Figure 3(a) clearly shows that the average particle size of S1-Cu2O was around 500 nm, its grains were dense and uniform and its shape was an irregular polyhedron. Figure 3(b) shows that the compact S2-Cu2O exhibited dendritic morphology with an average dendritic size around 40 μm. Figure 3(c) shows that the particle size of S3-Cu2O was approximately 300–400 nm, and the grains were dense and exhibited a triangular pyramid shape. It can be seen from Figure 3 that the morphology and grain size of prepared Cu2O thin films in different solution systems present significant differences, which may affect their electrode properties. It has been reported that the dendritic structure of Cu2O electrode has better performances for glucose oxidation than bulk Cu2O, due to a beneficial decrease of the charge transfer resistance as well as an improved transportation and diffusion of reactants and products as compared to other morphologies. 41 Therefore, it can be inferred that the S2-Cu2O thin film has good performance of glucose oxidation.

SEM images of Cu2O thin films. (a) S1-Cu2O. (b) S2-Cu2O. (c) S3-Cu2O. SEM: scanning electron microscope; Cu2O: cuprous oxide.
CV curve analysis
Figure 4 shows the CV curves of the electrocatalytic oxidation of glucose when the Cu2O thin film is used as the working electrode. As can be seen from Figure 4, only for the S2-Cu2O electrode did an obvious oxidation peak appear, and the peak position is at approximately 0.78 V. There is no obvious oxidation peak, which marks the S1-Cu2O thin-film electrode, the S3-Cu2O thin-film electrode and the ITO electrode. The results showed that Cu2O thin-film electrodes with three kinds of morphology showed different electrocatalytic oxidation properties with respect to glucose. Of the three, the S2-Cu2O thin-film electrode exhibited an obvious electrocatalytic response to glucose, suggesting the improvement of electrocatalytic activity towards the oxidation of glucose on the S2-Cu2O thin-film electrode. This is consistent with the results of SEM analysis.

CV curves of Cu2O films. The scan rate was 10 mV s−1. CV: cyclic voltammetry; Cu2O: cuprous oxide.
A possible mechanism which glucose is converted into gluconic acid is as follows 42 –45


First, the Cu(I) of Cu2O can be electrochemically oxidized to Cu(II) species, namely, Cu(OH)2 under alkaline conditions at the initial stage, 46 which can be further electrochemically oxidized to Cu(III) species (CuOOH) on the surface of the S2-Cu2O thin-film electrode. Then, the glucose can be oxidized to gluconic acid with the assistance of Cu(III), and simultaneously Cu(III) can be reduced to Cu(II). The formation of Cu (III) species not only leads to high catalytic activity but also plays the role of an electron transfer mediator, 23 where the oxidation was accelerated by the conversion of Cu(II) to Cu(III). 47 –49
Electrochemical performance analysis
Figure 5(a) shows the amperometric response curves of the S2-Cu2O thin-film and ITO electrodes. The red curve is the response curve of the ITO electrode to glucose. The red curve shows that when the initial concentration of glucose was 0.1 mg L−1, the current signal tended to be zero after the current rapidly responded. Then, when 2, 10 and 20 mg L−1 of glucose were added to the solution successively, the current did not respond. This indicates that the ITO electrode does not respond to glucose. In Figure 5(a), the black curve is the amperometric response curve of the S2-Cu2O thin-film electrode to glucose. The black curve shows that the ladder-like shape changes of current occurred with increasing glucose concentration in the solution. When glucose concentration changed, the current instantaneously increased and then decreased slowly until a stable equilibrium was reached. Figure 5(a) inset shows a typical steady-state current response time of less than 2 s with the addition of 10 mg L−1 of glucose. This indicates that the S2-Cu2O thin-film electrode had a rapid response to glucose.

(a) Amperometric response of S2-Cu2O for successive addition of different concentrations of glucose at 0.78 V. (b) Current response of glucose solutions with different concentrations. Cu2O: cuprous oxide.
Figure 5(b) shows the current response curve of the S2-Cu2O thin-film electrode to glucose solution with different concentrations, the error bars corresponding to the standard deviation of five successive measurements for the same concentration of glucose solution using the same S2-Cu2O thin-film electrode. In Figure 5(b), the red line is the curve of linear range fitting, and a linear equation (14) was obtained
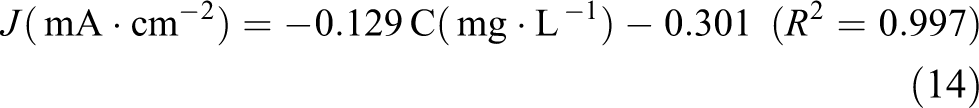
The linear range of the standard curve (R 2 = 0.997) of the glucose amperometric response was obtained as 1–20 mg·L−1 (5.55–111.01 µM). From the fitting results, the sensitivity is 23.24 mA·cm−2·mM−1 for glucose detection on the S2-Cu2O thin-film electrode. The limit of detection (LOD; evaluated as 3× the standard deviation of the blank sample/slope) is calculated to be 0.337 mg·L−1 (1.87 µM) based on the signal-to-noise ratio of 3. 50 The key properties of some reported electrode materials used as glucose sensors are shown in Table 1. Compared to the other Cu2O composite electrodes, the S2-Cu2O thin-film electrode described in this article had high sensitivity and a low response time. However, compared to other Cu2O composite electrodes, the linear range of the S2-Cu2O thin-film electrode was mostly very narrow, and it needs to increase.
Comparison of the key property of reported electrode materials as glucose sensors.

Cu2O: cuprous oxide; LOD: limit of detection.
Anti-interference performance of S2-Cu2O thin-film electrode
Figure 6 shows the anti-interference curve of the S2-Cu2O thin-film electrode for 2 mg L−1 glucose (AR; Tianjin Tianli Chemical Reagent Co., Ltd) solution response. At constant voltage, glucose, vitamin C (AR; Tianjin Guangfu Technology Development Technology Co., Ltd), sodium chloride (NaCl; AR; Tianjin Ke Miou Chemical Reagent Co., Ltd) and histidine (Biochemical reagent; Sinopharm Group Chemical Reagent Co., Ltd) were added to the solution 25 to study the changes in response. As can be seen from Figure 6, when the glucose was added, the current signal displayed a response quickly and clearly. Then, it slowly weakened until after 10 s it balanced and reached a constant value. After vitamin C, NaCl and histidine were added to the solution at 30, 40 and 50 s, respectively, the current response results exhibited no obvious effects on maintaining a balance from the original. This indicates that the S2-Cu2O thin-film electrode with dendrite morphology has good specificity with respect to glucose response and anti-interference performance with respect to other chemicals.

Interference test of S2-Cu2O with 2 mg L−1 glucose, 20 mg L−1 vitamin C, NaCl and histidine. Cu2O: cuprous oxide; NaCl: sodium chloride.
Stability of the S2-Cu2O thin-film electrode
The S2-Cu2O thin-film electrode was used to determine the response current to glucose using the electrochemical workstation. The glucose solution was newly configured each time. The concentration of the glucose solution was 2 mg L−1. The S2-Cu2O thin-film electrode was used at a 10-min time interval. Figure 7 shows the response current data of the S2-Cu2O thin-film electrode reused six times. The blue curve and red curve indicate the peak current value and balance current value of the response current, respectively. Figure 7 also shows that there was a certain difference in the peak current value of each response current, but the balanced current value of the response current was not markedly different. It can be concluded that the S2-Cu2O thin-film electrode with dendrite morphology exhibits good response performance after being repeated six times, as well as strong stability in glucose response. This is consistent with the results of XRD analysis.

The response current data of S2-Cu2O repeated six times. Cu2O: cuprous oxide.
Conclusions
Cu2O thin-film electrodes were prepared by the potentiostatic method with a three-electrode system. The photoelectric catalysis performance of Cu2O thin-film electrodes with respect to glucose was studied by the analysis of CV curve. The following conclusions were drawn.
Cu2O thin films had a high purity and uniform grain size. The morphologies of the S1-Cu2O, S2-Cu2O and S3-Cu2O thin films were irregular polyhedron, dendritic and triangular pyramidal, respectively, and showed cuprite structure. The band gap of the three Cu2O thin films exhibited little difference and was approximately 2.04 eV. In the visible light range, big absorption intensity was observed. There was strong absorption in the range of 500–600 nm, and thus fuller use of sunlight can be made. The S2-Cu2O thin-film electrode exhibited good electrocatalytic performance with respect to glucose, and the response was quick and the anti-jamming performance and stability were excellent. The linear equation was obtained as follows: J(mA·cm−2) = −0.129C(mg·L−1)−0.301 (R 2 = 0.997). The method described has a low LOD and high sensitivity, and it can be used to detect glucose.
Footnotes
Declaration of conflicting interests
The author(s) declared no potential conflicts of interest with respect to the research, authorship, and/or publication of this article.
Funding
The author(s) disclosed receipt of the following financial support for the research, authorship, and/or publication of this article: This work was supported by the National Science Foundation of China (nos 21576220 and 21276208), the Natural Science Foundation of Shaanxi Province (nos 2015JZ005 and 2017JQ2033) and the Key Laboratory Research Project of Education Department of Shaanxi Province (no 17JS085).