
Abstract
A nanostructured CeO2–Ni coating is prepared on a steel substrate via two-step electrodeposition. An oxide scale with a multi-layer structure of Cr2O3–(Mn,Cr)3O4–(Ni,Mn,Cr)3O4–NiO has developed on the coated steel after 1680 h of oxidation in air at 800 °C. CeO2 is uniformly distributed in the spinel and NiO layers. The synergistic effects originating from nanostructured CeO2 and NiO not only reduce the growth rate of Cr2O3 and suppress the outward diffusion of Cr, but also improve the electrical performance of the surface scale.
Introduction
Interconnect is one of the most pivotal components for planar solid oxide fuel cells as it electrically connects the individual cells to the stack and provides physical separation between air and fuel. Among the various interconnect materials, Cr2O3-forming ferritic stainless steels have attracted increasing attention due to their low cost, good formability, and high electrical and thermal conductivity. Whereas, the attainable electrical resistance increases over time due to the incessant growth of Cr2O3. In addition, the migration of Cr species into the cell cathode, leading to Cr-poisoning, greatly hinders their application. 1
Generally, protective and electrically conductive coatings have been applied to overcome their shortcomings as an available strategy. The reactive element oxide coatings have been shown to significantly enhance scale adhesion and reduce the oxidation rate. However, it is normally too thin and porous to prevent Cr out-diffusion. Li et al. 2 deposited Ni–CeO2 multiple coating on ferritic stainless steel. The converted NiO coating from metal Ni served as a barrier layer to deter Cr volatilisation. You et al. 3 prepared NiFe–CeO2 coatings on 430 stainless steels. The results indicated that the addition of CeO2 was very effective in decreasing the growth of Cr2O3 scale and suppressing the generation of pores at the scale/matrix interface.
In view of the characteristics of reactive element oxides and NiO as protective coatings for steel interconnects, the microstructure design of the coating has been proposed to optimise its performance. Herein, a CeO2 incorporated in the Ni matrix is electrodeposited on the SUS 430 steel to reduce both the chromium diffusion onto the interconnect surface and the alloy oxidation rate, which is a promising coating strategy. The oxidation behaviour and electrical properties of the CeO2–Ni-coated steel are studied in air at 800 °C.
Experimental
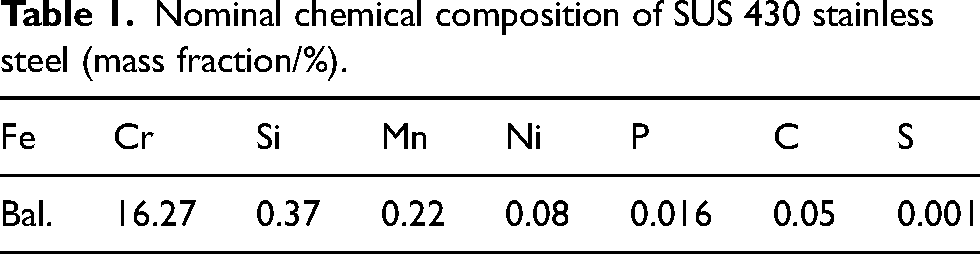
The nominal composition of SUS 430 ferritic stainless steel is given in Table 1. The electrochemical baths were composed of 0.05 M Ce(NO3)3·6H2O, 0.1 M NH4Cl and 0.01 M KCl. The electrodeposition was realised using the steel sample as the cathode and graphite rods as the anode for 2.5 mA·cm−2 at 40 °C. After 10 min of electrodeposition, the substrate covered with the CeO2 deposit was subjected to the electrodeposition of Ni using a Watts bath. Electrodeposition was performed at a current density of 15 mA cm−2 for 5 min. The CeO2-coated steel was also prepared for the sake of comparison.
Nominal chemical composition of SUS 430 stainless steel (mass fraction/%).
The oxidation behaviour of the coated and uncoated steels was evaluated by heating the samples in a box furnace for up to 1680 h. The oxidation temperature was 800 °C with a heating rate of 10 °C min−1. Every 168 h, the furnace was cooled to room temperature and the samples were weighed with 0.0001 g accuracy. The electrical resistance of oxidised scales was tested by a four-point method in the air from 600 to 800 °C with a step size of 50 °C on the direct current method according to a previous publication. 4 Surface and cross-sectional morphologies of the samples were observed by scanning electron microscopy (S-4800, Hitachi High-Technol.) with energy dispersive X-ray spectroscopy (EDS, Horiba). The phase structures of the sample were identified by X-ray diffraction (XRD; X'Pert PRO, PANalytical).
Results and discussion
Figure 1 depicts the surface morphologies of CeO2 and CeO2–Ni coatings fabricated by electrodeposition. The surface of the coating on steel mostly exhibits the needle-like and relatively open morphology of a 3D hierarchical nanostructure (Figure 1(a)). EDS analysis shows that the oxide deposits in area 1 are Ce oxide (Ce: 26.46; O: 69.49; Fe: 4.06; mole fraction/%). Moreover, a network of cracks appears in the coatings in Figure 1(a). Area 2 mainly contains Fe and Cr, suggesting that the cracks correspond to steel substrate uncovering the coating. They are either related to the formation of gas bubbles, the dehydration process itself or the shearing stresses between the substrate and the deposit. The existence of cracks is beneficial to Ni embedding. As shown in Figure 1(b), the CeO2 coating is incorporated in the Ni matrix.
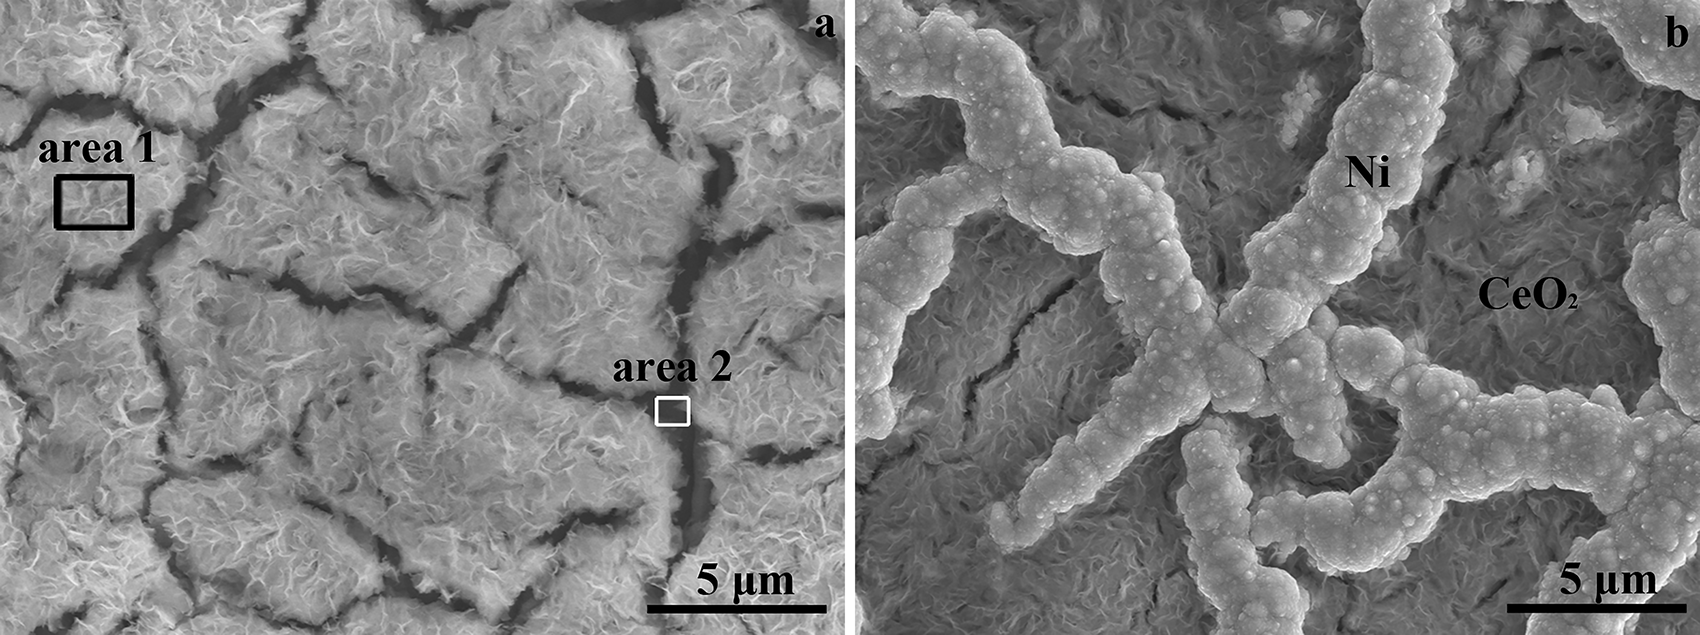
Surface morphologies of (a) CeO2-coated steel and (b) CeO2–Ni-coated steel.
Figure 2 depicts the mass gain curve and parabolic oxidation kinetics of the uncoated steel, CeO2–Ni- and CeO2-coated steels after thermal exposure in air at 800 °C. As shown in Figure 2(a), the mass gain of the CeO2–Ni-coated steel rapidly increases during the first 168 h. After that, the mass gain increases slightly with time. The fitting line is given in Figure 2(b) as the square of the mass gain against the oxidation time. The mass gain values of the uncoated steel after eight weeks of oxidation are excluded for a more suitable fitting curve due to the considerable spallation of the scale on uncoated steel. The oxidation kinetics of the coated steels follow a parabolic law due to the diffusion controlled by the oxidation process. According to the fitting curves, the calculated parabolic rate constant (kp) of the CeO2–Ni-coated steel is 4.79 × 10⁻¹⁴ g2 cm−4 s−1, which is approximately twice smaller than that of the uncoated steel (1.31 × 10⁻¹³ g2 cm−4 s−1), 5 indicating that the oxide scale formed on the coated steel notably reduces the oxidation rate of the steel due to the decreasing oxygen partial pressure at the oxide layer/coating surface. 6 The CeO2-coated steel shows the slowest kp (1.17 × 10⁻¹⁴ g2 cm−4 s−1), demonstrating the effectiveness of the coated sample as a barrier to oxidation.
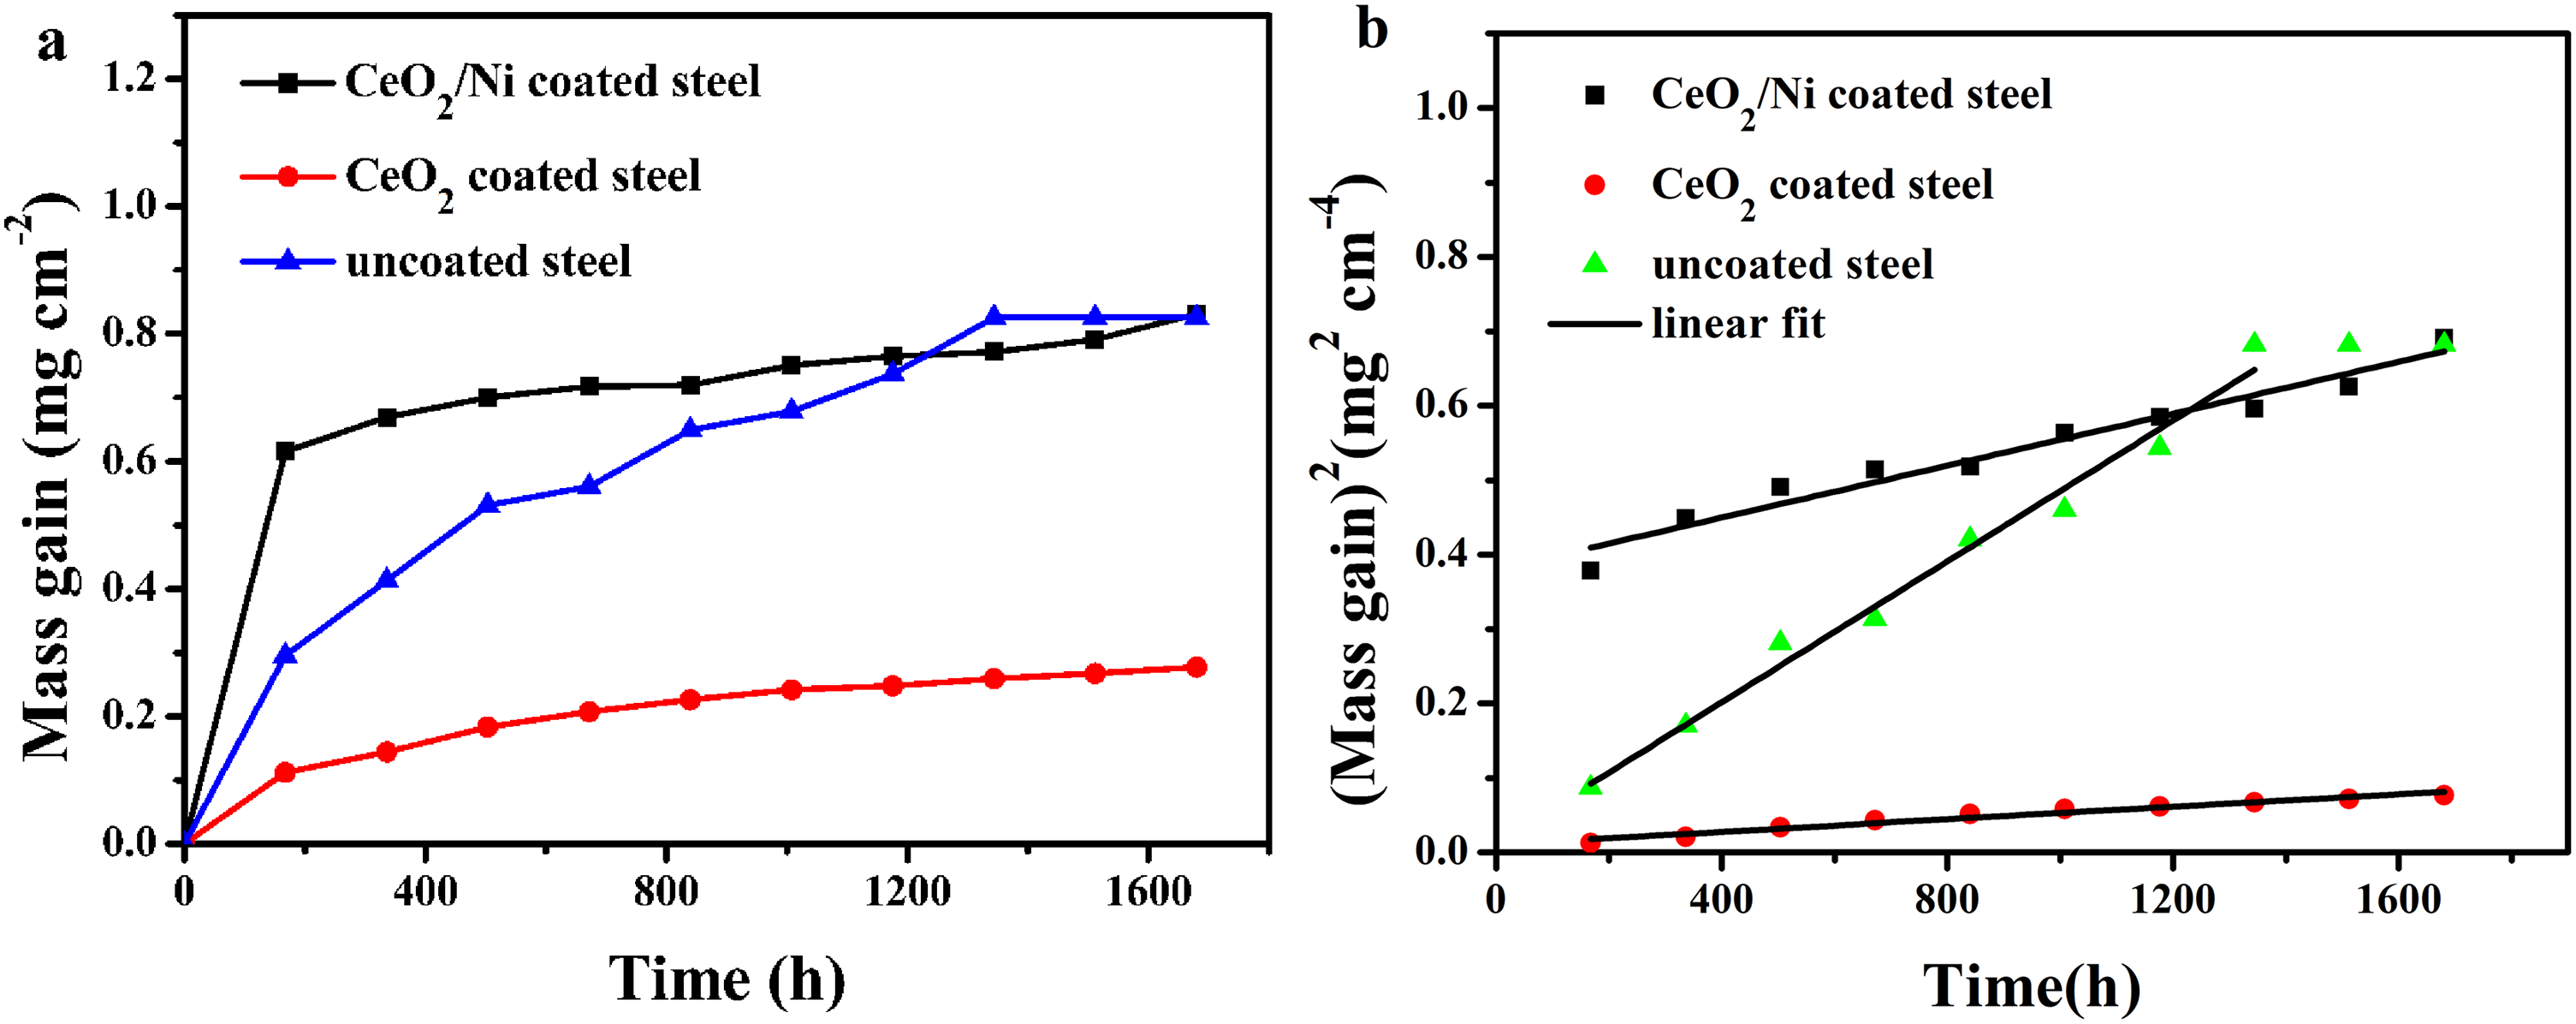
(a) Mass gain and (b) parabolic oxidation kinetics curves of the uncoated steel, CeO2–Ni- and CeO2-coated steels exposed in the air at 800 °C.
Cross-sections with elements line scan and XRD patterns of the uncoated steel, CeO2–Ni, and CeO2-coated steels after oxidation in air at 800 °C are shown in Figure 3. The oxide scale of the CeO2–Ni-coated steel presents a multilayered structure in Figure 3(a), consisting of an inner Cr oxide layer (0.9 μm), followed by a Ni–Mn–Cr oxide layer, a Ni–Mn oxide layer, and an outermost layer of Ni oxide. CeO2 is clearly localised on the outside of the chromium oxide, indicating that the Cr2O3 endogenously grows along CeO2. Some pores, the accumulation of vacancies due to the out-diffusion of alloy elements, are also observable in the scale during the exposure. The scale containing a Cr-rich inner layer (0.5–2 µm) and a Mn-, Cr-, and Fe-rich outer layer has developed on the CeO2-coated steel (Figure 3(b)). CeO2 is also distributed in the outer layer, proving that the Cr2O3 layer grows at the steel/CeO2 interface through O inward diffusion. Local spalling and scale cracks appear at the steel/scale interface for the uncoated steel (Figure 3(c)). The oxide scale with an outer layer of Mn- and Cr-rich oxide and an inner layer of Cr-rich oxide (7 µm) has thermally grown on the steel substrate after thermal exposure. Both Mn and Cr migrate towards the scale surface of the CeO2-coated steel and uncoated steel from the EDS line scan results, increasing the risk of cathode Cr-poisoning. The α-Fe (No. 87-0721), Cr2O3 (No. 82-1484), CeO2 (No. 43-1002), NiO (No. 89-7390), and spinel phases (No. 71-0855) are detected in CeO2–Ni-coated steel, as illustrated in Figure 3(d). A schematic representation of the chemical composition of the oxide scale is shown in Figure 3(e). Combining the EDS and XRD analysis, it can be concluded that a multi-layer structure of Cr2O3–(Mn,Cr)3O4–(Ni,Mn,Cr)3O4–NiO has been thermally developed on the coated steel. The Mn cations fast diffuse outward across the Cr2O3 to form the (Mn,Cr)3O4. Some amounts of NiO have been converted into (Ni,Mn,Cr)3O4 spinel phase by solid phase reaction. The oxide scale corresponds to Cr2O3–(Mn,Cr)3O4 on the uncoated steel. The following layer of scale over the Cr2O3 inner layer is confirmed to be CeO2–(Mn,Cr,Fe)3O4 for the CeO2-coated steel.
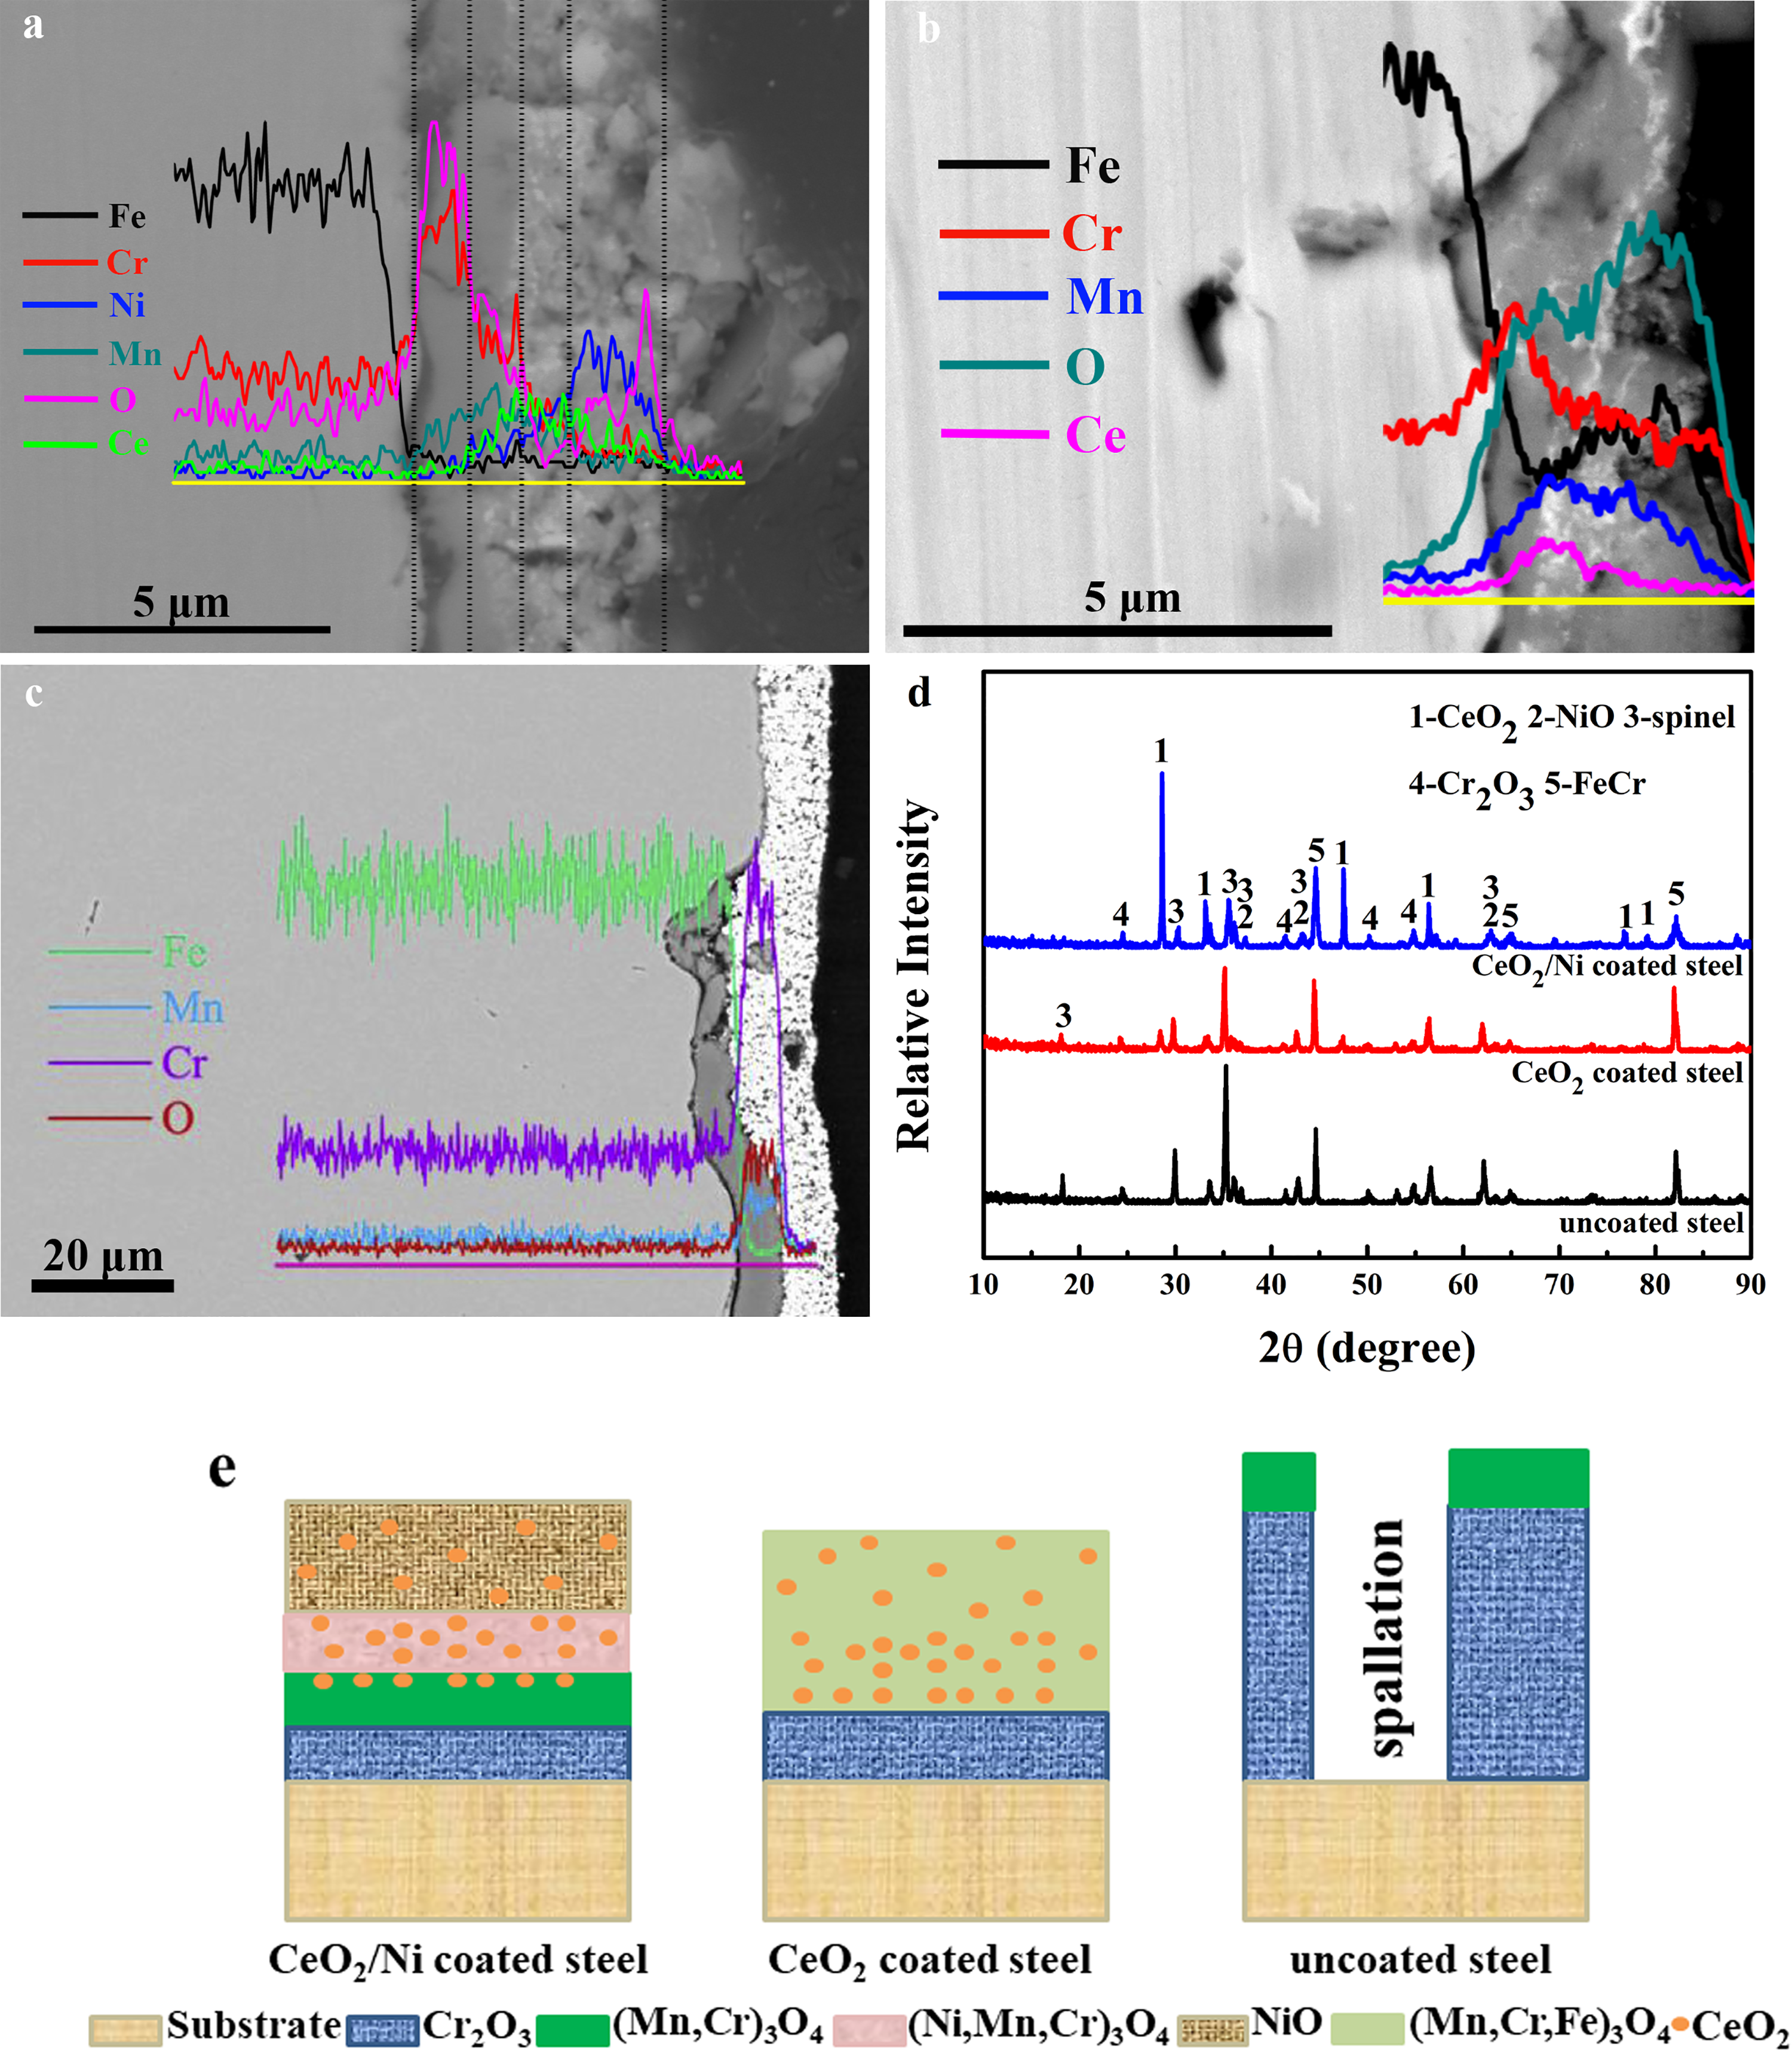
Cross-sections with elements line scan of (a) CeO2–Ni-coated steel, (b) CeO2-coated steel, (c) uncoated steel, 10 (d) X-ray diffraction (XRD) patterns of the oxide scale formed on the uncoated steel, CeO2–Ni- and CeO2-coated steels after oxidation in air at 800 °C for 1680 h and (e) a schematic showing the chemical composition of the oxide scale.
Noteworthy, almost no Cr is observed in the outermost layer, possibly due to a combination of several effects. The first is the Ni oxide layer itself, which acts as a barrier to Cr out-migration. Also, the hierarchical CeO2 provides more nucleation sites and promotes the formation of the Cr2O3 layer, inhibiting the out-migration of Cr at the initial stage of oxidation. 7 Furthermore, CeO2 distributed in the spinel and Ni oxide layers tends to segregate at the grain boundary of oxide and various defects, constantly blocking the fast path of cations’ outward diffusion. 8 Ultimately, the migration of Cr is suppressed during oxidation. As seen from Figure 3(a) and Li et al., 2 the Cr2O3 layer of CeO2–Ni-coated steel (0.9 µm thick) after 1680 h of oxidation is thinner than that of Ni (2 µm thick) and CeO2–Ni-coated steel (1 µm thick) deposited by one-step electrodeposition after 504 h of oxidation. This could be explained by the fact that the pores do not influence the scale properties due to their small quantity and discreteness. NiO decreases the oxygen partial pressure at the oxide layer/coating surface, resulting in a thin layer of Cr2O3. Additionally, the chromium oxide growth pattern undergoes a transition from a predominantly outward metal diffusion to a principally inward oxygen transport. 9 Accordingly, the growth rate of the Cr2O3 layer is reduced by the addition of the CeO2. Interestingly, although the coefficient of thermal expansion of NiO (14 × 10−6 °C−1) is apparently higher than that of Cr2O3 (9.6 × 10⁻⁶ °C−1), the samples exhibit good adhesion to the steel substrate and there is no delamination between multi-layer coatings after 1680 h of oxidation, which should also be due to the transformation of Cr2O3 growth pattern from Cr outward diffusion to O inward diffusion.
Figure 4 presents the area-specific resistance (ASR) of the oxide scale thermally grown on the uncoated steel, CeO2–Ni- and CeO2-coated steels after oxidation. The ASR value decreases with increasing temperatures. The measured ASR of the CeO2-Ni-coated steel oxidised for 1680 h (20.52 mΩ cm2) is the lowest in comparison with that of the uncoated steel oxidised for 840 h (35.86 mΩ cm2) 5 and CeO2-coated steel oxidised for 1680 h (34.59 mΩ cm2) at 800 °C. It is associated with the structure of the oxide scales. In the case of CeO2–Ni-coated steel, the low Cr content in the outer layer leads to a reduction of the oxide scale ASR. Moreover, the conductivity of NiO (0.14 S cm−1) is higher than that of Cr2O3 (0.01 S cm−1) and MnCr2O4 (0.05 S cm−1) at 800 °C, leading to the increasing electrical conductivity of oxide scale on the CeO2–Ni-coated steel. It should also be pointed out that the obtained ASR of the CeO2–Ni-coated sample fabricated by two-step electrodeposition exhibits an enhanced conductivity compared to the Ni and CeO2–Ni-coated samples deposited by other methods in the literature. For example, the ASR values of CeO2–Ni (via co-deposition approach) and Ni-coated SUS 430 steel after oxidation for 504 h are 41.5 and 58.6 mΩ cm2 at 800 °C, respectively. 2 The reduction of the oxide scale ASR should be attributed to the presence of hierarchical CeO2 in the oxide scale, which effectively reduces the thickness of the Cr2O3 inner layer with a lower electrical conductivity. Thus, the obtained ASR value of the CeO2–Ni-coated steel is acceptable and comparable with that of the coated steels in the literature.
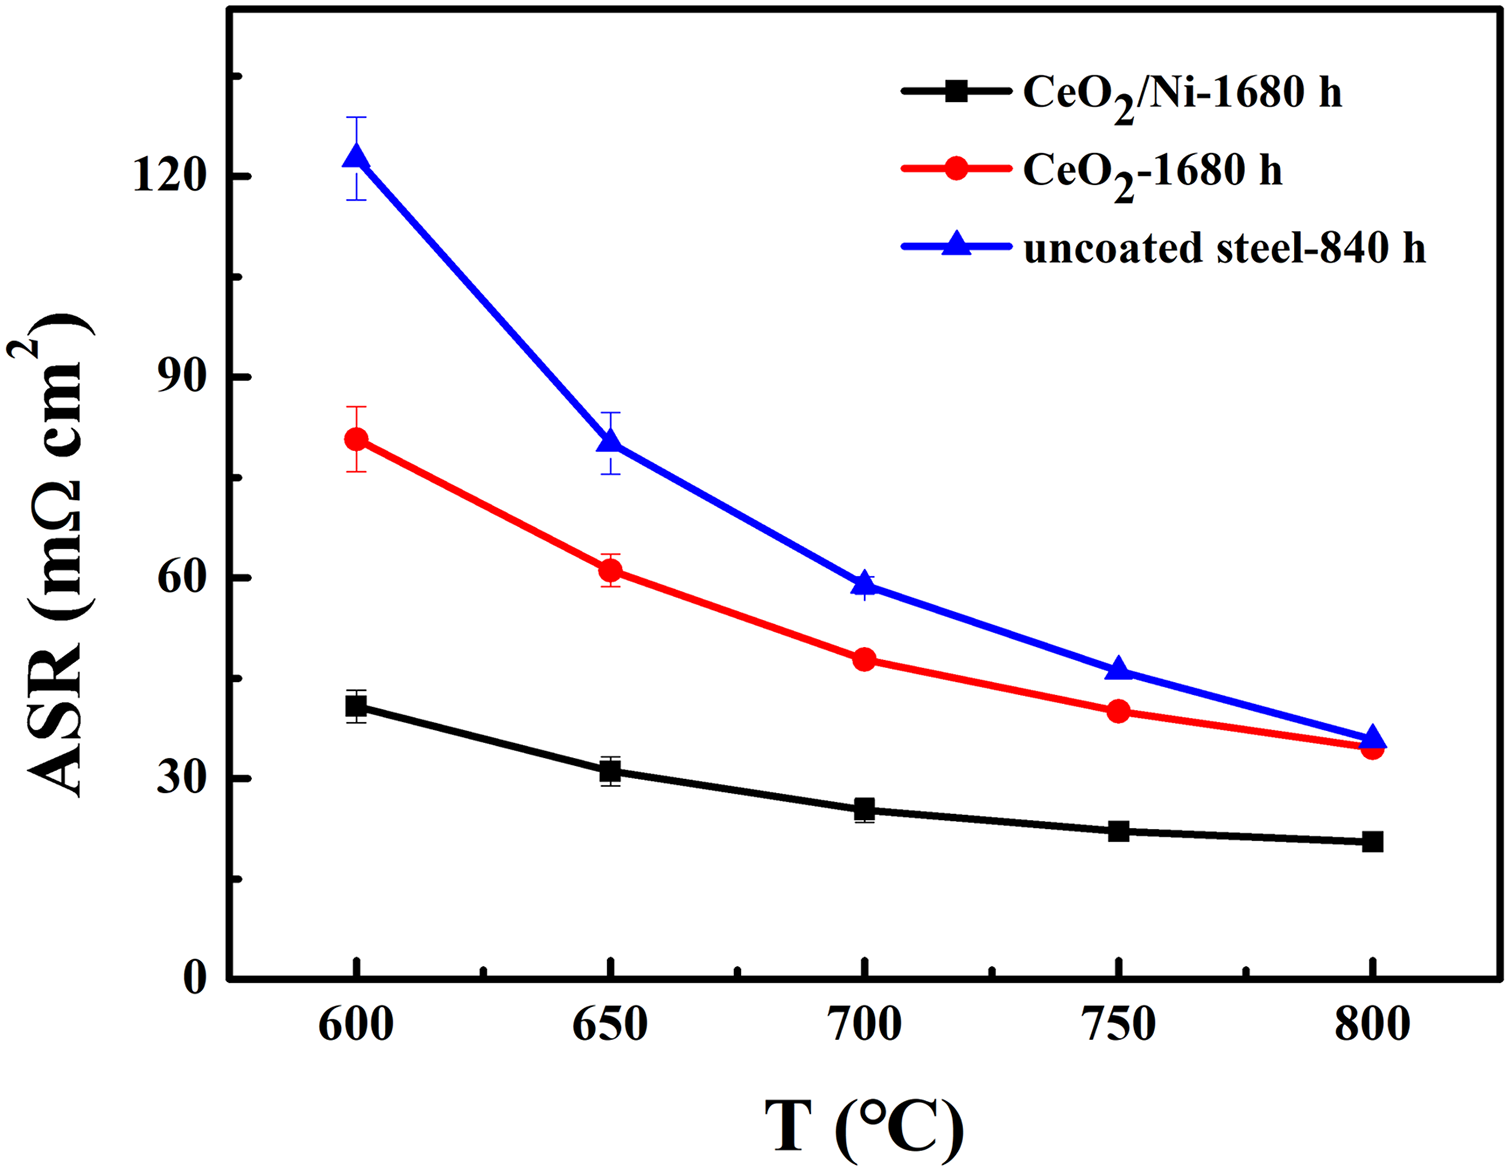
Area-specific resistance (ASR) of the oxide scale developed on the uncoated steel, CeO2–Ni- and CeO2-coated steels after oxidation in air at 800 °C.
Conclusion
The CeO2–Ni coating has been prepared on SUS 430 steel by electrodeposition. The layered scale of Cr2O3–(Mn,Cr)3O4–(Ni,Mn,Cr)3O4–NiO is thermally grown after 1680 h of exposure. The two types of CeO2 and NiO are combined to obtain synergistic effects that not only mitigate the growth of the Cr2O3 layer and suppress the outward diffusion of chromium, but also lower the surface scale ASRs.
Footnotes
Availability of data and materials
The datasets generated during and/or analysed during the current study are available from the corresponding author upon reasonable request.
Authors’ contributions
Huimin Zhu: Conceptualisation, investigation, supervision, and writing – original draft. Jun Zhang: writing – review and editing. Wenbo Cao: Investigation.
Declaration of conflicting interests
The authors declared no potential conflicts of interest with respect to the research, authorship, and/or publication of this article.
Funding
The authors disclosed receipt of the following financial support for the research, authorship, and/or publication of this article: This work was supported by the Postdoctoral Research Fund of Shenyang University under Grant No. 1220502052022010213.