
Abstract
Loading of one-dimensional (1-D) porous silicon photonic crystals (PS-PhCs), known as rugate filters, with luminescent materials is generally limited by the potential for (undesired) “pore clogging,” in relation to the size of the nanoparticles (e.g. quantum dots) or molecular species, and so far mainly restricted to small molecular weight materials or small nanocrystals, or in situ polymerized dyes. Here we report the infiltration 1-D PS-PhCs with a green-emitting commercial luminescent polymer (F8BT, poly[(9,9-di-n-octylfluorenyl-2,7-diyl)-alt-(benzo[2,1,3]thiadiazol-4,8-diyl)]), with a molecular weight of approximately 46 kDa across their whole depth (approximately 7.5 μm), thereby showing that pore clogging is not a concern for these structures. We also characterize the modification of the photoluminescence (PL) and decay rates, and investigate the detailed inner morphology of the filters with the help of (scanning) transmission electron microscopy. We observe both suppression (in the stop-band) and enhancement (at the high-energy band-edge) of the PL. We also find that the photonic stop-band is red-shifted after polymer infiltration, due to the increased effective refractive index of the polymer-infiltrated nanostructured system. The presence of just one unbroadened peak in the reflectance spectra after infiltration confirms that infiltration extends for the whole depth of the rugate filters.
Keywords
Introduction
Photonic crystals (PhCs) 1 provide perhaps the most powerful tool for manipulation of light generation and propagation, thereby potentially enabling the implementation of photonics as the most performing information and communication technology platform. As such, PhCs have been intensely studied over the last three decades, especially with a view to combining them with photoactive materials such as luminescent (macro)molecules and inorganic semiconductors, 2,3 or with plasmonic nanostructures, so as to achieve directional modification of the fluorescence, 4 –7 optically pumped lasing, 8,9 and optical switching, 10,11 among other aims. In this context, microcavities have been widely used to control and enhance the emissive properties of conjugated polymers. 12 –14
Notably, porous silicon-based PhCs, 15 such as rugate filters, 16 –18 have attracted significant interest since they provide a straightforward and technologically robust route to fabrication of optical nanostructures with significant levels of complexity, while at the same time building on an unrivaled silicon-based micro- and nanotechnology. Indeed, this class of photonic systems has been used widely for optoelectronic, 19 photonic, 20 sensing, 21,22 and biological applications. 23 In particular, rugate filters are good candidates as vapor and liquid sensors, 24 –27 and as detectors for biological activities such as proteases. 28,29 Several ways to fabricate hybrid polymeric-inorganic structures have been reported in the literature so far, but in most cases the preparation involved a “chemical approach,” namely, the growth of the target macromolecules “in situ” by chemically reacting smaller monomers that can be easily infiltrated inside the pores. 30 This has been exemplified by either electrochemical deposition 31,32 or in situ chemical polymerization 33 of suitable monomers. Although the efficiency of such processes is relatively high (in terms of pore filling and/or monomer conversion), the applicability of this method is limited to a relatively narrow set of monomers, and therefore not generally applicable.
For this reason, the preparation of hybrid Si-organic structures via a solution processable method, that is, by directly infiltrating the polymer inside the pores starting from a solution, is more attractive. 22,34 This procedure requires a good optimization of the infiltration methodology to successfully infiltrate the polymer inside the pores, especially if pore sizes are comparable to the polymers gyration radii (typically a few nanometers), or to the size of aggregated/phase-separated macromolecular mesostructures (up to tens of nanometers).
Interestingly, we found that pore clogging was not a particularly significant problem in our hybrid PhCs obtained via infiltration of commercial poly[(9,9-di-n-octylfluorenyl-2,7-diyl)-alt-(benzo[2,1,3]thiadiazol-4,8-diyl)] (F8BT; with a molecular weight Mw of approximately 46 kDa) into porous silicon. Upon infiltration we observe shifts of the filters reflectance peaks that are consistent with coating of the inner walls of the pores to the whole depth that can be probed in such optical experiments. We consider that our ability to infiltrate the porous structures results from the particular relation between the limited polymers gyration radius (R g, of the order of few nanometers) 35 and the minimum pore sizes (approximately 10 times as large as R g) for which we obtain direct insight by means of electron microscopy.
Importantly, we find that the luminescence of the infiltrated macromolecular luminophore is controlled by the photonic structure of the inorganic host, and shows an enhancement at the high-energy end, and suppression at the low-energy end, of the photonic band.
In general, we consider that these polymer-infiltrated Si-based crystals powerfully exemplify an element of a potential tool library of a “C-Si hybrid photonic platform.” Such a platform could be developed for a multitude of applications, spanning from biosensors to high-capacity/high-speed data-handling devices (e.g. for “Big-Data”), in a complementary or even alternative fashion to Si/III-V hybrids.
Experimental methods
Rugate filters preparation
Porous silicon rugate filters featuring a stop-band in reflectance either in the visible or near-infrared range were prepared by electrochemical etching of (100)-oriented, highly doped p-type silicon wafers (boron-doped, resistivity 0.0008–0.0012 Ω cm, from Siltronix Corp, France.) in a 3:1 (by vol.) solution of 48% (by vol.) aqueous hydrofluoric acid and ethanol (both from Sigma Aldrich, USA). The electrochemical etching was performed in a homemade Teflon cell using a two-electrode configuration, with the silicon substrate acting as anode (working electrode) and a platinum ring immersed in the solution acting as cathode (and used as pseudo-reference electrode). A source-measure unit (Keithley 2410 Source Meter, Keithley Instruments, USA) was used to impose the desired etching current density and to monitor the voltage drop between the silicon sample and the pseudo-reference electrode. The hydrofluoric acid solution was stirred during the electrochemical etching so as to minimize hydrogen bubble formation on the sample surface and enhance etching uniformity.
A cosine-shaped current density waveform with peak-to-peak dynamics from 13.3 to 39.9 mA cm−2, 50 repeats, and time period of 11 and 17.5 s was used to produce rugate filters with a stop-band in reflectance centered at 551 nm and 827 nm, respectively, before oxidation, and shifting to 515 nm and 771 nm, respectively, after oxidation (photo of the rugate filter whose peak is centered at 515 nm is reported in the inset of Figure 1(a), clearly showing that reflectance peak is in the green). Such an etching current density waveform produces mesostructured porous silicon samples with periodic porosity (values between 62.5% and 69.5%, with an average P avg = 66%) and, in turn, with periodic refractive index (oscillating between n min = 1.69 and n max = 1.93, n eff = 1.81 at 551 nm, yielding a maximum contrast of 0.26, and between n min = 1.61 and n max = 1.83, n eff = 1.72 at 827 nm). We estimated the values of porosity and, in turn, the effective refractive index from the experimental reflectivity spectra of porous silicon layers etched with constant current density of either 13.3 or 39.9 mA cm−2. These correspond to minimum and maximum values of the cosine-shaped current density waveform used for rugate filter etching, respectively, according to the procedure described in the work by Ruminski et al. 24

TEM/STEM images of rugate filter with reflectance peak (after infiltration) at 515 nm: (a) bright-field TEM image of the rugate filter (inset: photo of the same rugate filter), (b) bright-field STEM overview image of the PhC, and (c) high angle annular dark-field zoom of the internal structure. TEM: transmission electron microscopy; STEM: scanning transmission electron microscopy.
The effective refractive index has been determined using the so-called Bruggeman’s model/equation. For the as-fabricated samples, the effective refractive index has been calculated simply by considering the porosity of the samples, instead, for the oxidized samples, we had to take into account a three-component model, since we had to estimate the silicon oxide fraction to obtain the best fitting with the reflectance spectra. 21
To improve the infiltration process and prevent emission quenching by the heavily doped silicon layer, the rugate filters were partially oxidized into a tube furnace (ThermoLyne 21100, Thermo Fisher Scientific, USA) under pure oxygen (O2, 99.999%) at 600°C for 30 min prior to infiltration.
Conjugated polymer infiltration
F8BT infiltration into the cavities of the filters was obtained using a dip-coating procedure 36 by first submerging the rugate filter into a toluene solution of the polymer (1% by weight), and then by slowly extracting it. The procedure was carried out at a controlled lifting rate (0.01 mm min−1) and temperature (29°C). The excess polymer left onto the surface after dip-coating was removed using a cotton swab soaked with toluene.
Spectroscopic and morphological characterization
Normal incidence and angle-resolved reflectance spectra were collected with an Ocean Optics S2000 spectrometer (Ocean Optics Inc., USA) in combination with a fiber-coupled Ocean Optics HL-2000 tungsten halogen source (Ocean Optics Inc., USA). Steady-state angle-resolved photoluminescence (PL) measurements were carried out using a 405 nm Continuous wave (CW) laser diode (Thorlabs Inc., USA) and an Andor Shamrock 163i spectrometer coupled to an Andor Newton CCD camera cooled at −50°C (Andor Technology Ltd., UK). In the angle-resolved measurements, the samples were placed onto a rotation stage (M-060.DG, resolution <0.1° Physik Instrumente (PI) GmbH & Co. KG, Germany) to allow the rotation of both the filter and the laser holder, and thus ensure that the incident light hits the sample at a constant angle, while varying the collection one. The spectra were collected every 5°, from 0° up to 35°. Time-resolved PL measurements were carried out with a time-correlated single-photon counting (TCSPC) spectrometer (F900, Edinburgh Instruments Ltd., UK) with excitation provided by a pulsed laser diode (λ ex = 371 nm, pulse width approximately 60 ps).
Transmission electron microscopy (TEM) and scanning transmission electron microscopy (STEM) images have been taken using a Titan 80/300 TEM/STEM (Thermo Fisher Scientific, USA). This instrument is fitted with a monochromator to deliver spatial/energy resolution capabilities of 0.14 nm/0.5 eV (monochromator off) and 0.3 nm/0.12 eV (monochromator on).
Results and discussion
Morphological characterization
Figure 1 shows TEM (Figure 1(a)), STEM (Figure 1(b) and (c)), and cross-sectional images of the rugate filters with “initial” (i.e. before oxidation) stop-band at 551 nm, at different magnifications. Notably, the periodic modulation of the porosity of silicon along the direction perpendicular to the surface can be clearly observed as darker/brighter alternating regions in all TEM/STEM images (Figure 1(a) to (c)). The quality of the “overview” Figure 1(a) is good enough to enable counting the total number of layers (50) and measuring the total thickness of the rugate filter (approximately 7.6 μm). The sample has been covered with a Pt layer (darker layer on the top of the structure) to protect the structure during the ion etching carried out to obtain the slice for TEM analysis. In Figure 1(c), we report a zoomed-in STEM image of the photonic structure, which shows a clear asymmetry in the bright and dark regions in each period, thereby suggesting that the refracting index modulation is different from sinusoidal, despite the sinusoidal etching current. We consider that this is likely due to current density-dependent etching rates. 37 Details of the electrochemically generated nanocavities and nanocolumns obtained with the atomic force microscopy are reported in the Online Supplementary Figure S3.
The interplanar spacing D by inspection of Figure 1(b) is approximately 150 nm, consistent with the total thickness and the number of current periods. Such a value is further confirmed by two-dimensional fast Fourier transform (2-D FFT) analysis of Figure 1(b) reported in Figure 2. In Online Supplementary Figure S1, we also report a depth profile of the STEM image of Figure 1(b) to offer further quantitative confirmation of the period spacing. The FFT peak spacing is 6.67 μm−1 (corresponding to 150 nm). The presence of bright lines denotes a high uniformity of the (vertical) periods over the entire surface of the slice, but a much lower uniformity of the pillars and pores dimension.
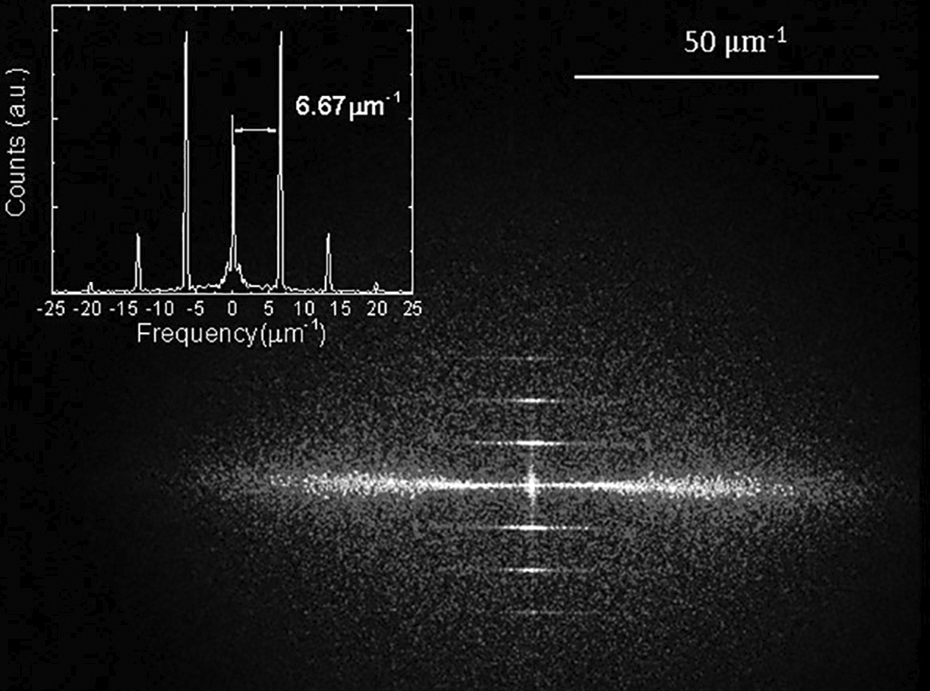
2-D FFT (inset: frequency profile extracted from the 2-D FFT, the distance between the lines is found to be 6.67 μm−1). 2-D: two-dimensional; FFT: fast Fourier transform.
We also analyzed the structure of Figure 1(a) along its depth at higher magnification. In Figure 3, we present two TEM cross sections taken at the same magnification (12,000 magnifications) in the top (Figure 3(a)) and in bottom (Figure 3(b)) section of the rugate filter. Despite some small oscillations in the layers in the top part of sample, the interplanar distances appear nearly perfectly matched in both parts, as highlighted by the two parallel dashed lines. The only exception is the very last etched layer (in the bottom part of the sample) that is smaller than the other ones.

Bright-field TEM images taken at 12,000 magnifications with 0.5 s exposure in the top (a) and bottom (b) part of the rugate filter. TEM: transmission electron microscope.
Optical characterization
In Figure 4, we report the reflectance spectra of both rugate filters (i.e. tuned or “green” (Figure 4(a)) and detuned or “red” (Figure 4(b))) before (red line) and after (blue line) the dry oxidation process. For the “green” sample (Figure 4(a)), the reflectance peak is blue-shifted by approximately 33 ± 1 nm due to the formation of the oxide layer and, in turn, to a different effective refractive index. This is also confirmed by the lowering of the total reflectance induced by the decrease of the dielectric contrast. Considering this blue-shift and the determination of the interplanar spacing via STEM imaging analysis, according to Bruggeman’s equation, the silicon oxide fraction formed during the oxidation process should be approximately 10 nm. For the rugate filters with initial (i.e. before oxidation) stop-band at 827 nm (Figure 4(b)), the blue-shift of the reflectance peak is about 56 nm. The interplanar spacing D is found to be approximately 240 nm. This has been evaluated by the reflectance measurements and taking into account the thickness of the oxide determined for the “green” rugate filter.

Reflectance spectra of the “green” (a) and “red” (b) rugate filters before (red line) and after (blue line) the oxidation process.
To determine the effect of the photonic structure on the F8BT spectrum, we compared the optical properties of the “green” filter with the stop-band centered at 515 nm (after oxidation, red-shifting by about 12 nm upon infiltration, thus providing significant spectral overlap with the F8BT PL, and hence referred to as “tuned” filter) with those of the “detuned” filter (the “red” one, with the stop-band centered at 771 nm, after oxidation, further red-shifting upon infiltration) that is used as a reference.
Figure 5 shows the typical PL spectrum of an F8BT film (Figure 5(a)) and the reflectance spectra for tuned (Figure 5(b)) and detuned samples (Figure 5(c)) before and after the infiltration of the F8BT, at normal incidence. 38 Please see the Online Supplementary Figures S4 and S5 for the contour plot and Online Supplementary Figure S6 for the spectra of the reflectance versus excitation angle before and after infiltration. We could not detect any PL from the bare porous silicon for both tuned and detuned samples.

(a) PL spectrum of a neat film of F8BT on a compact silicon substrate and (b and c) reflectance spectra for the PhCs before (blue line) and after polymer infiltration (red line). The infiltration leads to a red-shift of the photonic stop-band (and thus of the reflectance peak) of about 12 ± 1 nm. Note that the vertical scales for (b) and (c) are different, that is, 40% and 100% reflectance, respectively. Inset: cartoon illustrating the inferred cross section of the rugate filter (D is the interplanar spacing determined by the period of the anodic etching current); the polymer layer is not filling the pores of the rugate filters, but there is just a layer on the walls of the cavities (see main text for discussion). The structure of the sample used to measure the F8BT PL is also shown. PL: photoluminescence; PhCs: photonic crystals; F8BT: poly[(9,9-di-n-octylfluorenyl-2,7-diyl)-alt-(benzo[2,1,3]thiadiazol-4,8-diyl)].
Upon polymer infiltration, the reflectance peaks red-shifted by approximately 12 ± 1 nm in both samples due to the increased effective refractive index. In particular, the reflectance peak for the tuned sample red-shifted from 515 nm to 526 nm after infiltration, and for the detuned one it red-shifted from 771 nm to 784 nm. This is in qualitative agreement with the prediction of the Bragg–Snell law (equation (1)), which can then be used to quantify the effective refractive index n eff 39

Here m is the diffraction order, λ the spectral position of the stop-band peak, θ the incidence angle, and D the interplanar spacing that is determined by the preparation condition. From equation (1), we determine n eff = 1.81 and 1.72 for the as-fabricated rugate filters, for interplanar spacing D of 150 nm and 240 nm as obtained from TEM images for the rugate with stop-band peaks (before oxidation) at 551 nm and 827 nm, respectively.
As a further check, the total thickness (t) of the nanostructured samples can also be calculated using the interference fringes in the reflectance spectra once the effective refractive index of the photonic crystal is known

where N fringes is the number of fringes within the spectral range △ν (in cm−1). Using the effective refractive indices obtained with the Bragg–Snell’s law, and a spectral range of approximately 4800 cm−1 for the tuned sample and approximately 3000 cm−1 for the detuned one, we found t = 7.6 μm for the tuned filter (which is in excellent agreement with the STEM observations) and t = 12 μm for the detuned one.
Considering that the refractive indices of F8BT are 1.6 (extraordinary one) and 1.8 (ordinary one) 40 and the refractive index of air is 1, we would have expected a spectral shift of the reflectance peaks bigger than the observed one if the cavities had been completely filled by the polymer. In fact, in the case of a complete filling of the cavities with the F8BT (i.e. totally removing the contribution of the air to the effective refractive index and replacing that with one of the polymers in the Bruggeman’s model) the reflectance peaks of the two rugate filters would have moved from 515 nm to 634 nm (119 nm shift) and from 771 nm to 960 nm (189 nm shift) for the tuned and detuned filter, respectively.
Having established that infiltration leads to a “coating” of the pores walls, rather than to “solid filling” of the pores with the polymer, an interesting question arises as to whether such a “coating” is complete or partial in the vertical direction. We can infer that our structures are infiltrated for more than 99% of their depth from the analysis of the reflectance spectra of the filters which do not show any sign of a double peak. Infiltration leads to an obvious red-shift of approximately 12 nm of the main reflectance peak, so that if the pores were only partially infiltrated we should be seeing an overlap of both infiltrated and non-infiltrated portions of the latter, whereas in the reflectance spectra of our infiltrated samples we cannot detect any feature that can be attributed to such a contribution, and conservatively considering a resolution of 0.2% on the reflectance measurement we actually can exclude partial infiltration to better than 1 part in 100, or so. Please note that both in the infiltrated and non-infiltrated case, our optical measurements can probe the whole rugate filter thickness as demonstrated by the consistency of the filter thickness measured via STEM of a cross section and as estimated from the number of fringes according to equation (2) above.
To observe the modification of the PL spectra induced by the photonic crystal, we compared the PL of the F8BT infiltrated into the tuned and detuned (reference) filters, to avoid small differences in the surface chemistry of the porous silicon samples affecting the determination of the photonic effects. The PL spectra were then normalized with respect to the intensity at λ = 550 nm, that is, several tens of nanometers away from the center of the photonic stop-band. 41
In Figure 6(a), we report the PL spectra as a function of the collection angle, while keeping the laser incidence angle constant, for both tuned and detuned infiltrated filters (only at normal incidence for the detuned sample, as there is no angular dependence. Please see the Online Supplementary Figure S7 for a full PL contour versus excitation angle). Clearly, F8BT’s PL is strongly modified by the presence of both the stop-band and the interference fringes, which contribute to “structuring” the emission. Remarkably, the photonic band-gap (PBG) suppresses (albeit partially) propagation at 528 nm (at 0° incidence) and increases the intensity at the high-energy edge (from 518 nm at 0° incidence to 503 nm at 30° incidence). This is in agreement with the expected suppression of the photonic density of states (DOS) in (the middle of) the stop-band, and with its increase at the stop-band high-energy edge. 42 As expected, both the enhancement and the suppression display strong dependence on angle, because of the dispersion (i.e. the dependence of the photons on the wave vector of the light) of the stop-band. Considering that the wave vector of the light is related to the collection angle, the blue-shift of the emission/suppression of the emitted light in correspondence of the photonic stop-band in Figure 6 as a function of the collection angle is in perfect agreement with the Bragg–Snell law (equation 1).

(a) PL spectra (solid lines) collected at different collection angles (from 0° to 35° with a step of 5°) for F8BT infiltrated into the tuned PhC and at 0° for the F8BT infiltrated into the detuned PhC (dashed line). We used a CW laser, emitting at 405 nm, as excitation source. We can observe the PL peak dispersion moving from 518 nm at 0° to 506 nm at 25°. (b) Ratio between the PL spectra from the tuned and detuned PhC at different angles, as in (a). PL: photoluminescence; PhC: photonic crystal; F8BT: poly[(9,9-di-n-octylfluorenyl-2,7-diyl)-alt-(benzo[2,1,3]thiadiazol-4,8-diyl)] CW: continuous wave.
The dispersion of the photonic stop-band can be also better appreciated in the contour plots in Online Supplementary Figures S4 and S5, which shows the reflectance spectra of the tuned and detuned rugate filters as a function of the angle. In these measurements, we can clearly observe the dispersion predicted by the Bragg–Snell’s law.
The enhancement/suppression above is appreciated clearly in Figure 6(b) in which we have plotted the ratio (Rn) between the PL spectra of infiltrated tuned filter and detuned filters. 38 Thus Figure 6(b) emphasizes both enhancement (Rn > 1) in the region between 518 nm and 506 nm and a minor suppression (Rn < 1) at the stop-band (between 528 nm and 512 nm) for angle increasing from 0° (normal incidence) to 35°. The difference in the intensity of the suppression and enhancement could be explained as the difference in the experimental setup for the two samples (film thickness and laser spot size) and to refractive index effects. 43
Finally, to obtain conclusive evidence about the modification of the radiative rate of F8BT induced by the “photonic host” (i.e. the rugate filters), we measured the PL temporal decay (Figure 7) both within the stop-band (528 nm, Figure 7(a)) and at the high-energy edge of the latter (518 nm, Figure 7(b)). 38 We focused on these two spectral lines because at such wavelengths there is a clear modification of the DOS, 44 as already demonstrated by the reflectivity spectra, and also include the decay dynamics of a film of neat F8BT on a nonporous silicon substrate as a reference.

Radiative decay of the F8BT PL measured by TCSPC (371 nm excitation) and recorded either (a) within the stop-band (528 nm) or (b) at the high-energy edge (518 nm) for F8BT infiltrated into the tuned and detuned filters, as well as for a neat F8BT film on non-porous Si, as a reference. TCSPC: time-correlated single-photon counting; PL: photoluminescence; F8BT: poly[(9,9-di-n-octylfluorenyl-2,7-diyl)-alt-(benzo[2,1,3]thiadiazol-4,8-diyl)]; Si: silicon.
Interestingly, we find that all temporal decays are predominantly mono-exponential (including for neat F8BT films on Si), and that they can be fitted well with a bi-exponential function 45 (reduced χ 2 < 1.3), although with a faster decay for the infiltrated samples. Both observations are entirely within expectations for a conjugated polymer emitter within a context of a physical model of the luminescence originating from both strongly-bound intramolecular excitons (primary exponential) and more weakly-bound interchain states (excimers or aggregates: secondary exponential, with a longer decay time). This model is amply supported in previous literature, 46 –52 with a particularly powerful example being provided by the temporal decays of solutions of analogous materials with different and controlled degrees of aggregation, that can be fitted with the same double exponential lifetimes, by varying only the pre-exponential factors. 53
Incidentally, we note that although the temporal decay dynamics of F8BT neat films are sometimes also modeled as mono-exponential (with lifetimes from 0.89 to 1.84 ns depending on wavelength, film thickness and substrate materials) given the strong preponderance of one lifetime, 54 –57 fitting with a bi-exponential also for such neat films is more appropriate (e.g. a single exponential leads to a reduced χ 2 of approximately 1.8 at 528 nm with τ approximately 1180 ps, data reported in Online Supplementary Table S1, whereas a double exponential fit yields a χ 2 of approximately 1.2 with τ 1 approximately 1142 and τ 2 approximately 3231 ps for the same wavelength), thereby supporting the presence of a second decay process readily attributable to a weakly coupled interchain state (aggregate). This is within expectations, because although the formation of aggregates is reduced in very diluted solutions (in good solvents), it is nearly ubiquitous in solid-state films (driven by π–π, or other packing interactions) and decay lifetimes can indeed be measurably altered by changes in the environment. 58
Infiltration of the chromophores also provides a very significant change of the environment, and therefore it should not be surprising that we observe a very distinct decrease of both main and secondary lifetimes upon infiltration. The large area/volume ratio of the regions in which the polymer is accommodated once infiltrated, and for which a relatively strong interaction with the SiO2/porous silicon can be expected (both of a chemical and physical nature), is likely to lead to different strand packing patterns and likely formation of weakly bound interchain states in addition to the monomolecular singlet excitons that characterize the emission of the neat thin films.
In general, the PL of conjugated semiconductors is a sensitive probe of their chemico-physical environment, and of the geometry adopted by the polymeric strands. Similar effects have been noted both when adsorbing similar chromophores on nanospheres in 3-D self-assembled opals 7 and in the presence of strong interchain interactions for a variety of conjugated polymers, including F8BT. 59,60 While such interactions might differ significantly for the infiltrated F8BT with respect to the one on neat Si, they should be very similar for the tuned and detuned filters, thereby enabling a meaningful comparison.
Before passing to discuss the differences between lifetimes in the middle and the edge of the stop-band and between tuned and detuned samples, we would also like to note explicitly that the internal pore dimension of the rugate filters is dictated by the intensity of the etching current (which we have not changed in the two experiments), 61 and not by the period of the etching current (which we have instead varied, in order to achieve tunability), and there is no reason to expect the thickness distribution of the polymer coated on the pore walls to depend on a spatial period (>100 nm) that is more than an order of magnitude larger than the polymer gyration radius (few nanometers). We note specifically that in our tuned sample (for which we observe the all-important lifetime difference at the different wavelengths) the pores structure is exactly the same, thereby indicating that any effect must be due to the photonic structure, and not by pore wall coating differences.
Table 1, in which we report the numerical parameters for a bi-exponential fit of the decays in Figure 7, provides clear evidence for a modification (albeit small) of the decay rates brought about by the photonic structures.
Temporal decay constants (τ 1, τ 2) extracted from least square fits of the PL decay curves with their relative weight (I 1, I 2) and reduced χ 2 obtained for the fitting.

PhC: photonic crystal; Si: silicon; PL: photoluminescence.
We note in particular that we observe a very clear reduction of both lifetimes (Table 1) at the high-energy edge of the stop-band (518 nm) for the tuned with respect to the (detuned) reference filter (approximately 17% of τ 1). As expected, we also find slightly longer time constants within the stop-band (528 nm) (by approximately 5% for τ 1). Also note that the less significant variation within the stop-band (effectively comparable with the error) is fully consistent with a much less important suppression of the emission in this region, as compared to the enhancement at the band edge (as also evidenced by Figure 6).
Importantly, the reduced χ 2 provides an excellent parameter to assess the quality of our model (excitonic + aggregate emission) in the interpretation of our data. We note in particular that all values obtained from the bi-exponential fitting are close to 1 and below 1.3.
Finally, we note that the relatively limited differences between the radiative decay rates of F8BT within tuned/detuned filters are entirely within expectations for 1-D photonic structures such as rugate filters that only provide intrinsically limited “photonic confinement” (i.e. only along the z-direction) and whose spectral width (516–533 nm) is small compared to the PL of the F8BT guest (490–700 nm). 1 We also note that in cases where the PL is excited by one-photon processes, most of the luminescence comes from layers close to the surface, where optical confinement is necessarily less effective than for layers deeper in the structure.
Conclusion
In conclusion we have investigated a hybrid silicon-organic photonic system. We achieved excellent infiltration of the green-emitting highly luminescent F8BT into rugate filter cavities whose detailed nano/mesostructures were carefully analyzed via STEM. F8BT infiltration into the rugate filters leads to a red-shift of the stop-band and brings about a wavelength- and angle-dependent PL suppression/enhancement due to the presence of the photonic stop-band. A modification of the emission lifetime at the stop-band high-energy edge is clearly observed and assigned to the modulation of the photonic DOS imposed by the conjugated polymer.
Supplementary material
Supplemental Material, NM_NT_SI_rev - C-Si hybrid photonic structures by full infiltration of conjugated polymers into porous silicon rugate filters
Supplemental Material, NM_NT_SI_rev for C-Si hybrid photonic structures by full infiltration of conjugated polymers into porous silicon rugate filters by Valentina Robbiano, Salvatore Surdo, Alessandro Minotto, Giancarlo Canazza, G Mattia Lazzerini, Shabbir M Mian, Davide Comoretto, Giuseppe Barillaro, and Franco Cacialli in Nanomaterials and Nanotechnology
Footnotes
Declaration of conflicting interests
The authors declared no potential conflicts of interest with respect to the research, authorship, and/or publication of this article.
Funding
The authors disclosed receipt of the following financial support for the research, authorship, and/or publication of this article: This work was supported by EU FP7 Marie Curie Initial Training Network CONTEST under grant agreement PITN-GA-2012-317488; by the H2020 ETN SYNCHRONICS under grant agreement 643238; Engineering and Physical Science Research Council, UK, under grants agreement EP/H006680/1, EP/K004506/1, EP/P006280/1, EP/P007767/1, and EP/P006280/1 (MARVEL); and by the Italian Ministry for University and Research (MIUR) Futuro in Ricerca (FIR) programme, grant no. RBFR122KL1 (SENS4BIO). FC is a Royal Society Wolfson Research Merit Award holder.
Supplementary material
Supplementary material for this article is available online.
References
Supplementary Material
Please find the following supplemental material available below.
For Open Access articles published under a Creative Commons License, all supplemental material carries the same license as the article it is associated with.
For non-Open Access articles published, all supplemental material carries a non-exclusive license, and permission requests for re-use of supplemental material or any part of supplemental material shall be sent directly to the copyright owner as specified in the copyright notice associated with the article.