
Abstract
In this study, submerged arc discharge method (SADM) was used to prepare graphene-nanosilver composites (graphene impregnated with nanosilver) and verified whether it can be prepared under different methods. The optical properties, zeta potentials, and particle sizes of the composites were analyzed through ultraviolet–visible spectroscopy and Zetasizer. The suspensibility of composites were much better than that of noncomposites. Then, we compared the components of composites and noncomposites through transmission electron microscopy. The results confirmed that even when fabricated from similar materials, the composites and noncomposites yielded by SADM featured significantly different properties.
Keywords
Introduction
Nanotechnology has grown substantially in recent years and been widely used in numerous fields, such as electronics, engineering, biotechnology, and products essential to daily life. 1,2 Currently, the preparation of nanomaterials are mainly chemical and physical methods. Chemical method requires extra chemicals and dispersants to avoid agglomeration and precipitation, raising concerns of undesired derivatives and environmental hazards caused by improper handling. 3,4 Graphene and nanosilver share some common properties and are suitable for applications such as transparent conductive electrodes, 5 surface enhancements for Raman spectroscopy, 6 and antimicrobial materials. 7 Traditional preparation requires chemicals such as diethylene and sodium borohydride. 8 Diethylene can be used as a solvent when mixed with water in any proportion and is toxic to the human body, whereas sodium borohydride is commonly used as a reducing agent for various organic and inorganic syntheses. According to the literatures, 9 –12 graphene oxide hydrogel and hierarchical assembly of diamond core-shell nanocomposites can produce high-efficiency dye adsorbent, which has a good effect on wastewater treatment and the removal of organic dyes. Graphene oxide and albumin/photosensitizer nanohybrids can be applied to the enhancement of photodynamic therapy. This study used physical method to prepare nanocolloid without adding any dispersant but added a little amount of polyvinyl alcohol (PVA) to enhance the suspensibility of nanocolloids. 13 Deionized water was used as the solution to prevent nanometal colloids from other substances.
The experiment demonstrated that the submerged arc discharge method (SADM) with deionized water is fast and safe method to prepare graphene-nanosilver composites and noncomposites. Only graphite-silver rods, graphite rods, and silver wires were required to prepare nanomaterials in a micro-electrical discharge machining (m-EDM) system. In contrast to the chemical methods, SADM is not only safe but also environmentally friendly and cost effective. 14
Experiment
Materials
Silver was added to a block of graphite through lathe processing and electrodes with a diameter of 1 mm were sintered with masses of silver equal to 30% of the electrode mass, as shown in Figure 1(a). The anode consisted of a 1-mm silver wire (99.9%) as shown in right of Figure 1(b) and the black L-type auxiliary printed by three dimensional printing is applied to stabilize the silver wire. And the cathode consisted of a 1-mm graphite rod as shown in left of Figure 1(b). The diameters of the anode and cathode were 1 and 2 mm, respectively. Corona discharge was produced in the deionized water (pH = 6.5, conductivity = 1.8 μS/cm).

Processed (a) graphite-silver rods and (b) graphite rod and silver wire.
Experiment system
The nanoparticles were physically prepared in an SADM system, as shown in Figure 2. The metal surfaces were separated through high temperature melting and SADM. Subsequently, the dielectric liquid transformed the separated metal into nanoparticles immediately after the metal melted. 15 In Figure 3, the system is automatically controlled by VisSim 6.0, Visual Solutions, Inc. Westford, MA, USA and connected to computer system with RT-DAC4/PCI Mutli I/O Board. The monitoring system recorded data such as the discharge success rate, the motor sliding distance (etching level), and the voltages of both electrodes, whereas the circuit system tracked data such as the discharge circuit parameters, the discharge success rate, and the feedback control circuit parameters. During the process, it was possible to adjust the proportional-integral-derivative (PID) controller and pulse modulation to optimize the discharge conditions. In Table 1, it shows the optimal discharge parameters of m-EDM system specifically in this study. To avoid short circuits during discharge, the monitoring system maintained the discharge distance at approximately 30 µm through the servomotor. Before the discharge, the electrodes were set and immersed in glass bowls filled with deionized water. In addition, to enable uniform dispersion of the separated nanoparticles after condensation, a magnetic stirring rod was placed in the glass bowl to stir the deionized water. After the discharge, nanocolloids were obtained. In Figure 4, it shows the schematic of the discharge principle.

micro-Electrical discharge machining.

Human–machine interface of m-EDM ((a) motor control signal, (b) discharge voltage signal, (c) encoder, (d) discharge success rate). m-EDM: micro-electrical discharge machining.
Parameter of m-EDM setting, material and testing condition.

PID: proportional-integral-derivative; PVA: polyvinyl alcohol; m-EDM: micro-electrical discharge machining.

Schematic of the discharge principle, (a) insulation state before discharge, (b) discharge start, (c) ionization, (d) arc discharge, (e) discharge end, (f) return to insulation state.
Preparation of deionized water suspension containing graphene-nanosilver composites
The discharge system provided a stable pulse voltage, rapidly and safely etching the graphite-silver material in the deionized water. To drive the SADM system, the output pulse voltage from the power supply was approximately 100 V. During the discharge, the discharge voltage was maintained at 20–30 V for 3–5 µs, and the peak etching current was as high as 6 A. The controllable PID parameters were configured to obtain the optimal manufacturing conditions of graphene-nanosilver particles.
During the preparation of nanoparticles, the control parameters (such as working voltage, pulse current, pulse wave modulation time (on–off time), electrode gap) and the temperature and impurities of the deionized water were the most pivotal factors. 16 The process of melting and condensing the surface layers of the graphite-silver rods stabilized the suspension in the deionized water.
A 200 mL volume of deionized water (pH = 6.5, conductivity = 1.8 μS/cm) was poured into a beaker as the dielectric fluid for graphene preparation and corona discharge. To prepare graphene-nanosilver noncomposites, 200 mL of deionized water was poured into a graphite container before 1 mL of diluted PVA solution was added (1 g of PVA powder was placed in 20 mL of deionized water and dissolved with heat, and 1 mL (1/20) was extracted thereafter; subsequently, 1 mL of PVA solution was diluted with 4 mL of deionized water (1/100) before 1 mL of the second dilute was added to the glass bowl (50 ppm = 1/20,000)). After the dilution was complete, the corona discharge was started to prepare the graphene-nanosilver composite and noncomposite solutions.
After the graphene-nanosilver composite and noncomposite colloids had been obtained through the corona discharge, their particle size distributions, zeta potentials, and optical properties were measured and compared. 17
Surface comparison between graphene-nanosilver composite and noncomposites
The prepared graphene-nanosilver composite and noncomposite colloids were dripped onto copper meshes and their surface distributions were observed using a high-resolution transmission electron microscope (HRTEM) (JEOL USA, Model: JEM-2100F, MA, USA). 18 The zeta potentials, particle sizes, and size distributions of the composites and noncomposites were observed using a Zetasizer (Malvern Instruments Ltd, Model: NanoZS90, Malvern, UK). The optical properties of the composites and noncomposites were analyzed through an Ultraviolet–Visible (UV-Vis) spectrum analyzer (Helios Alpha, Thermo scientific, Model: 9423UVA1002E, USA). 19
Results and discussion
The Tyndall effect manifested in the graphene-nanosilver composites and noncomposites, respectively, indicating the presence of nanoparticles in both as shown in Figure 5(a) and (b). Graphene and nanosilver colloids are clear and yellow, respectively. Presumably, the graphite had a stronger influence on the preparation of graphene-nanosilver composites than the silver. Conversely, the silver had a stronger influence on the preparation of graphene-nanosilver noncomposites than the graphite.
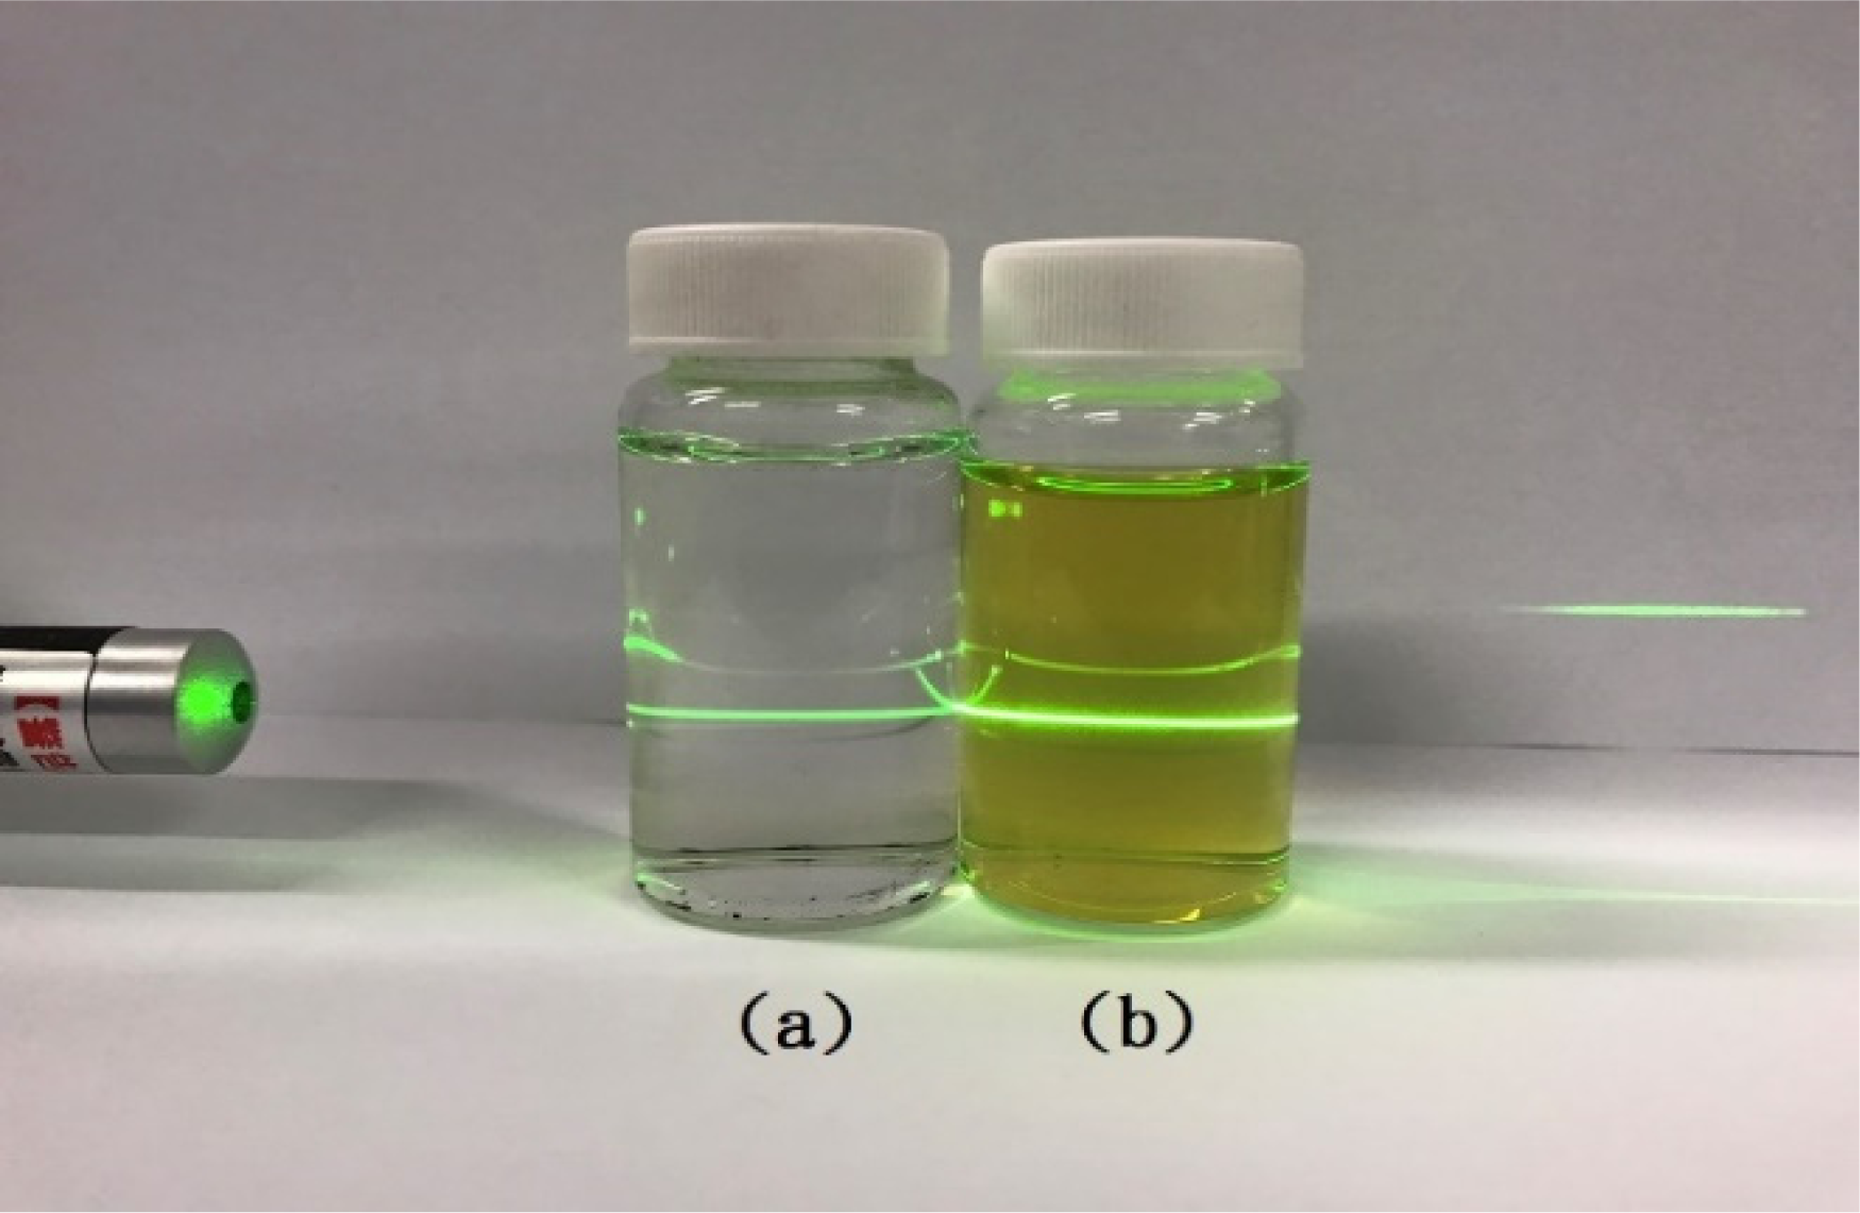
Graphene-nanosilver (a) composites and (b) noncomposites.
In Figure 6, it illustrates that TEM images of the graphene-nanosilver composites (Figure 6(a): 200 kV × 250,000 magnification; Figure 6(b): 200 kV × 500,000 magnification; Figure 6(c) shows particle size distribution). In Figure 6, it demonstrates that the graphene masses were transparent flakes 20 whereas the nanosilver particles were black dots, 21 the graphene impregnated with nanosilver and interlayer distance of graphene is 0.33 nm. The average particle size of nanosilver impregnated with graphene is 5.89 nm. In addition, the high mutual repulsion between the particles facilitated a dispersed and stable distribution in the sample. In Figure 7, it illustrates that TEM images of the graphene-nanosilver noncomposites (Figure 7(a): 200 kV × 2500 magnification; Figure 7(b): 200kV × 10,000 magnification; Figure 7(c) shows particle size distribution). The graphene appears as black mesh and the nanosilver particles appear as black dots. In Figure 7, it clearly demonstrates that nanosilver particles and graphene are completely separated, and the interlayer distance of silver is 0.224 nm. The average particle size of nanosilver separated from graphene is 23.3 nm.

TEM image of graphene-nanosilver composites. The scale bars correspond to (a) 10 nm, (b) 5 nm, (c) size distribution of the graphene-nanosilver, respectively. TEM: transmission electron microscope.

TEM image of graphene-nanosilver noncomposites. The scale bars correspond to (a) 0.2 µm, (b) 5 nm, (c) size distribution of the graphene-nanosilver, respectively. TEM: transmission electron microscope.
The average zeta potential of the graphene-nanosilver composite was approximately −41.0 mV, as shown in Figure 8. The average zeta potential of the noncomposite was approximately −28.2 mV, as shown in Figure 9. To ensure stable suspension, the zeta potential must exceed −30 mV. The zeta potentials of −41.0 and −28.2 mV in this experiment indicated that the particles maintained excellent suspension and never sedimented. Figure 10 illustrates the UV-Vis results of the graphene-nanosilver composites (Figure 10(a): 190−300 nm; Figure 10(b): 300−600 nm), whereas Figure 11 illustrates those of the noncomposites (Figure 11(a): 190–300 nm; Figure 11(b): 300–600 nm).
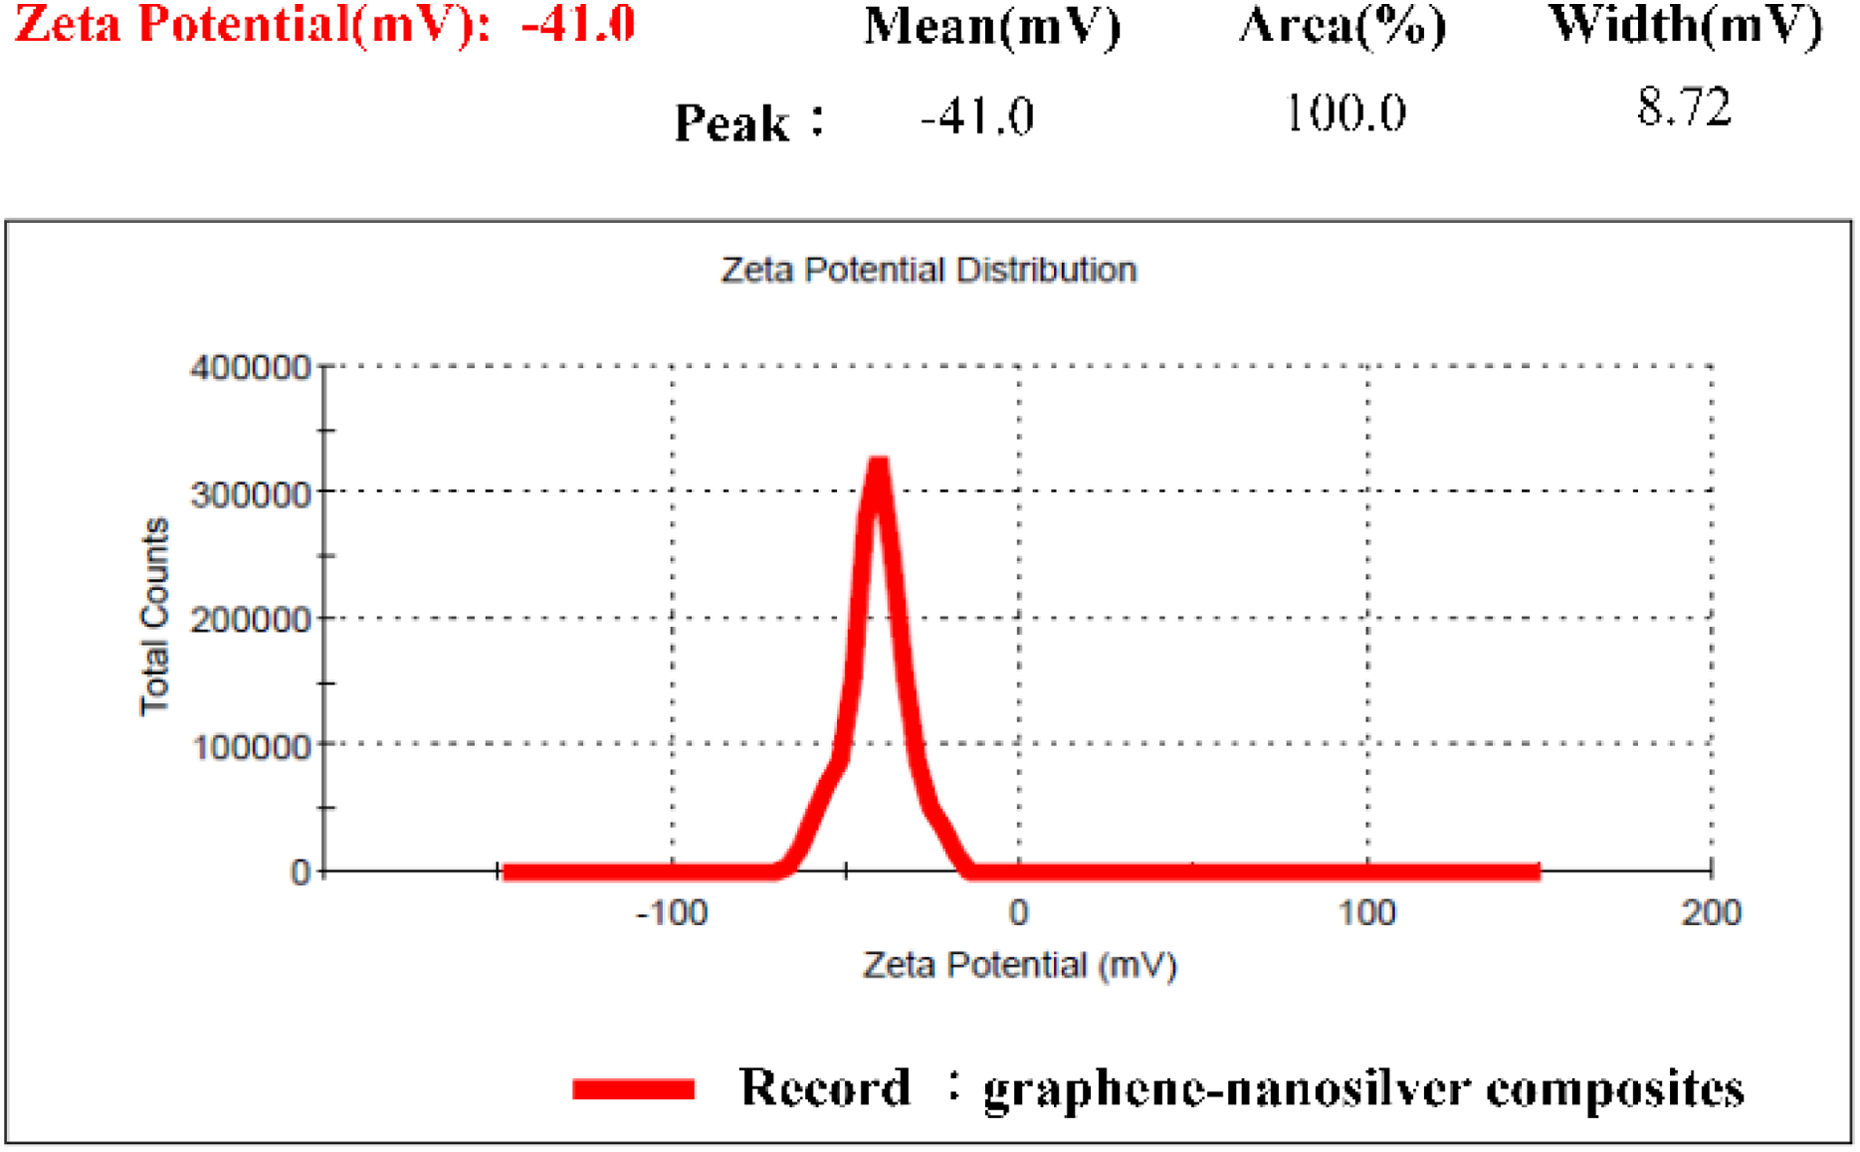
Zeta potential of graphene-nanosilver composites.

Zeta potential of graphene-nanosilver noncomposites.

UV-Vis results of graphene-nanosilver composites. UV-Vis: ultraviolet–visible.
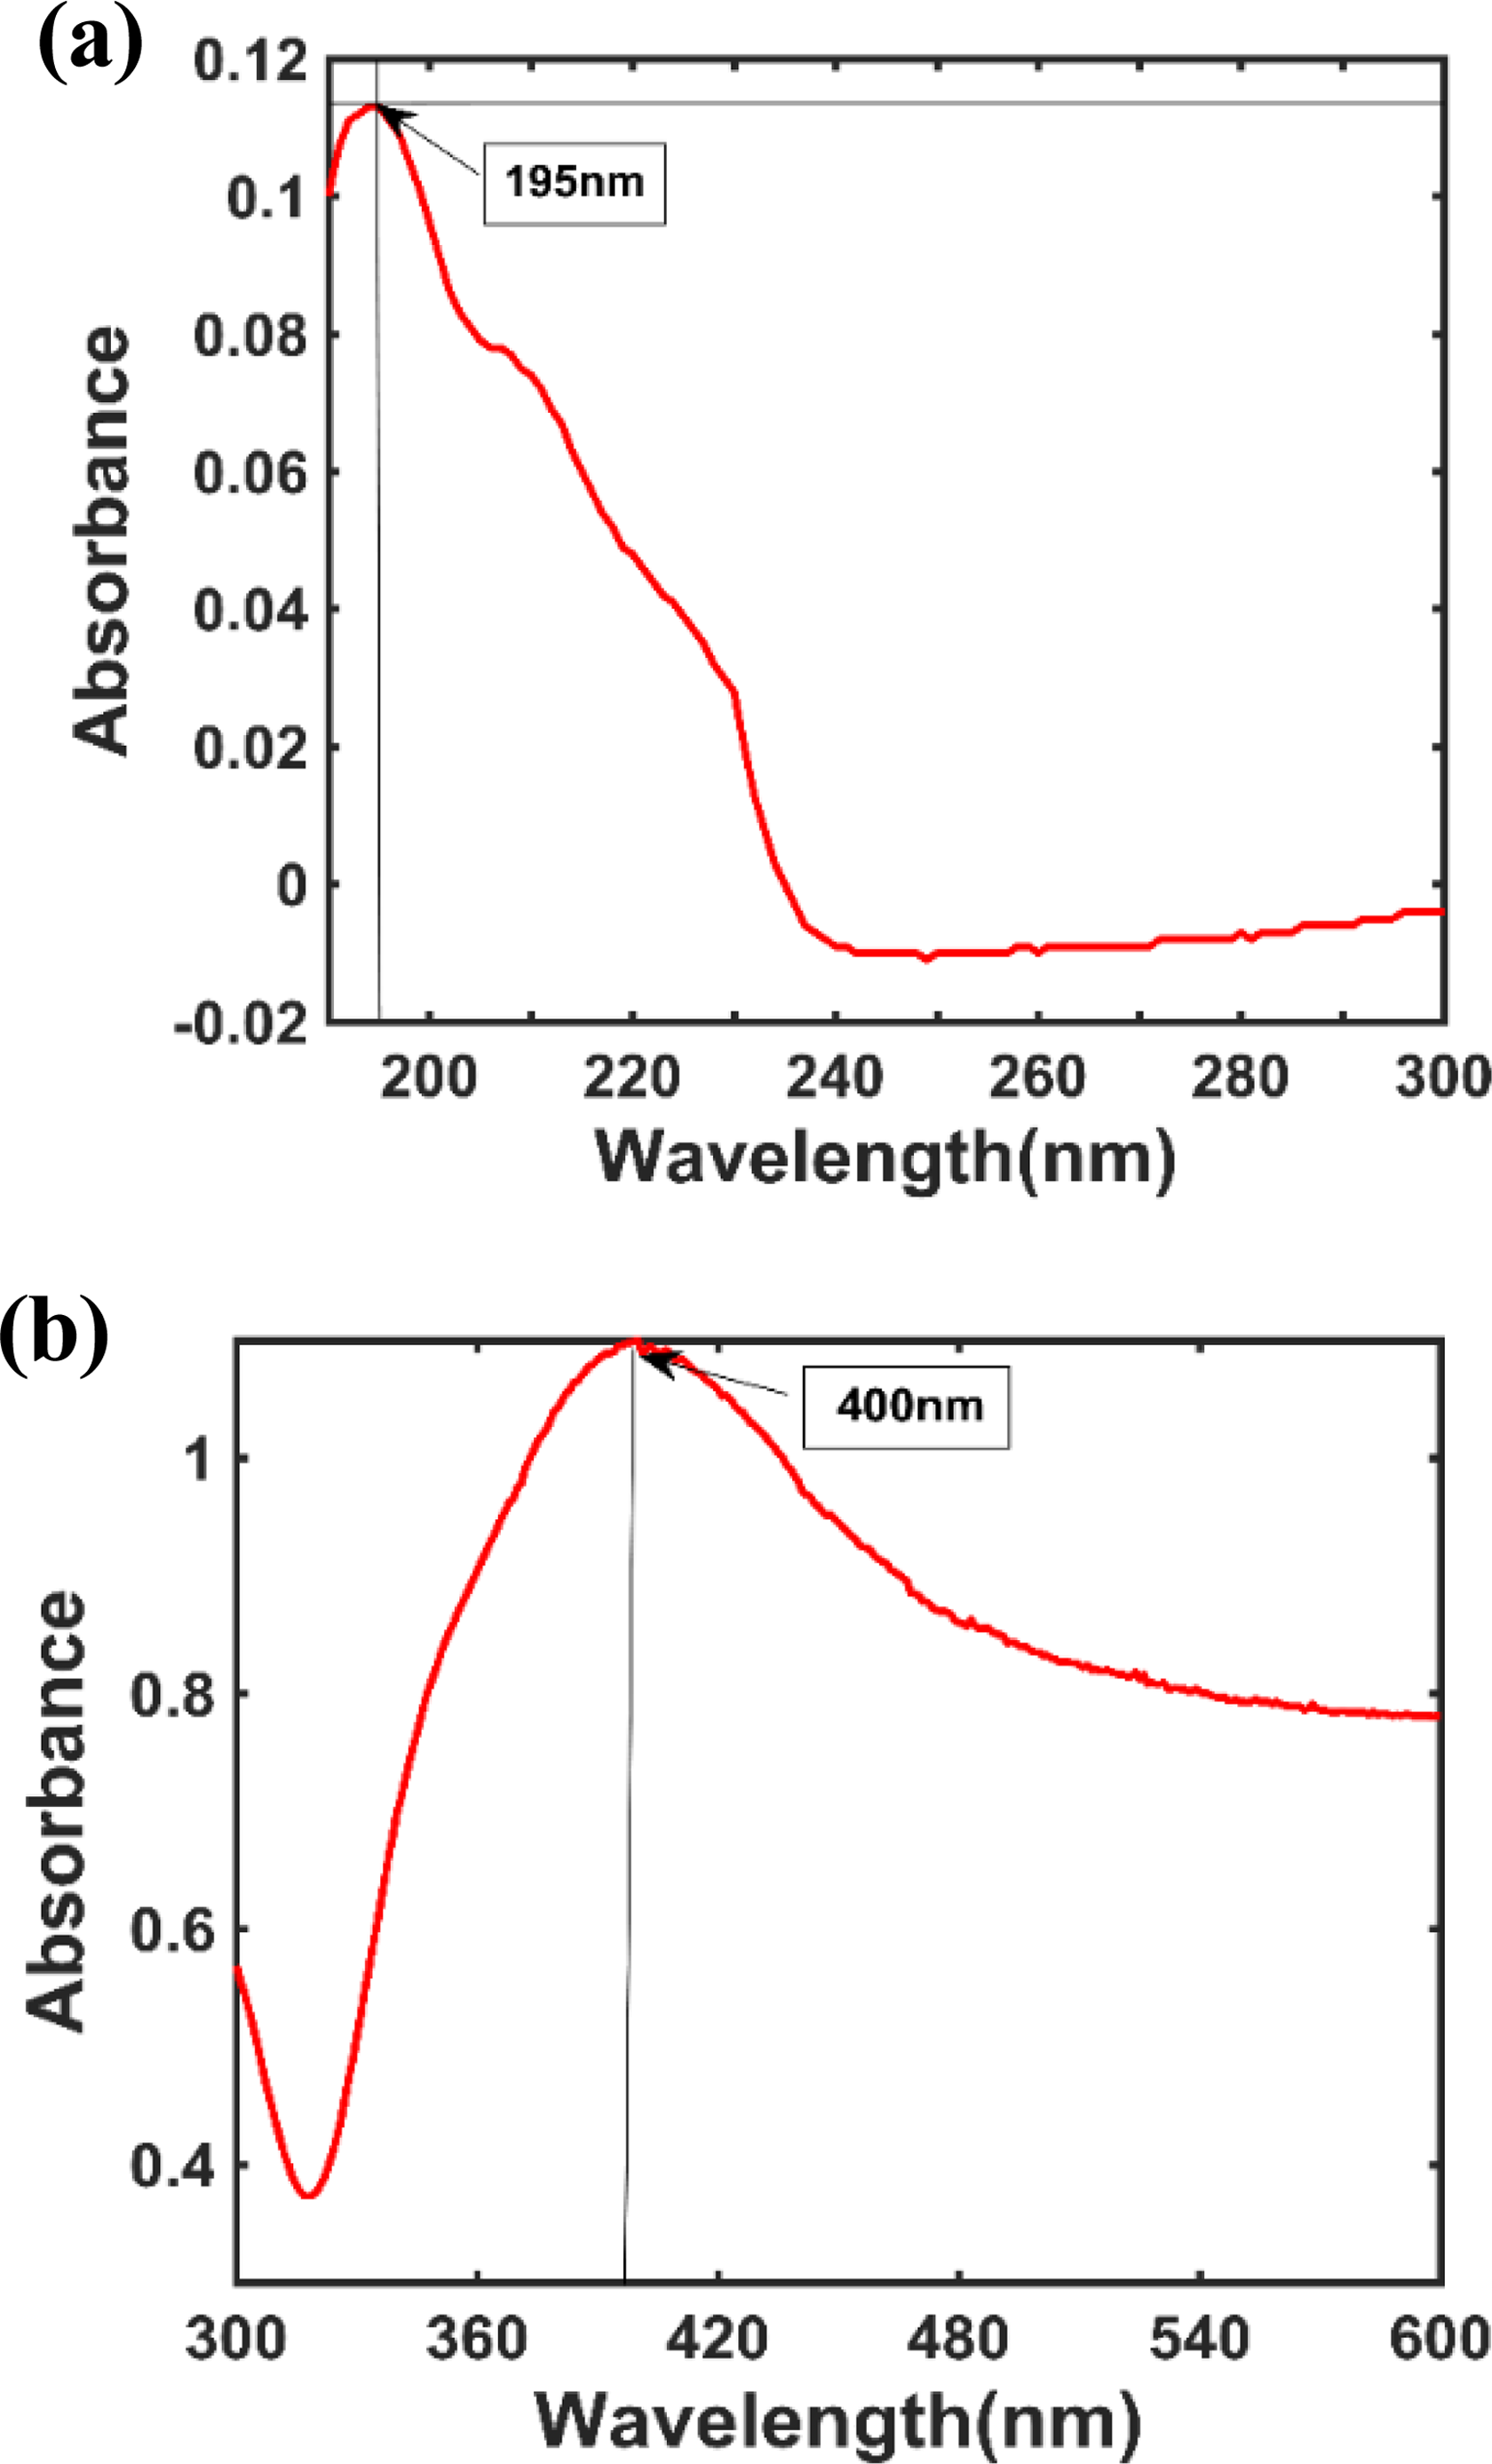
UV-Vis results of graphene-nanosilver noncomposites. UV-Vis: ultraviolet–visible.
The graphene-nanosilver composites were discharged in deionized water through SADM. Therefore, when the discharge pulse was in the T on phase of SADM, the surfaces of the electrodes constantly splashed out molten composite particles. When the discharge pulse was in the T off phase, the separated composites and some other ions were suspended in the deionized water. This experiment featured a safe and cost-effective SADM process. The deionized water was an excellent dielectric fluid and the silver wire (anode) and the graphite-silver rod (cathode) produced graphene-nanosilver particles of stable size. The experimental results demonstrated that the electrodes must be processed and synthesized before the preparation of metals or nonmetals through SADM; raw materials must not be used. In Table 2, we list a comparison of the graphene-nanosilver composites and noncomposites.
Comparison between graphene-nanosilver composites and noncomposites.
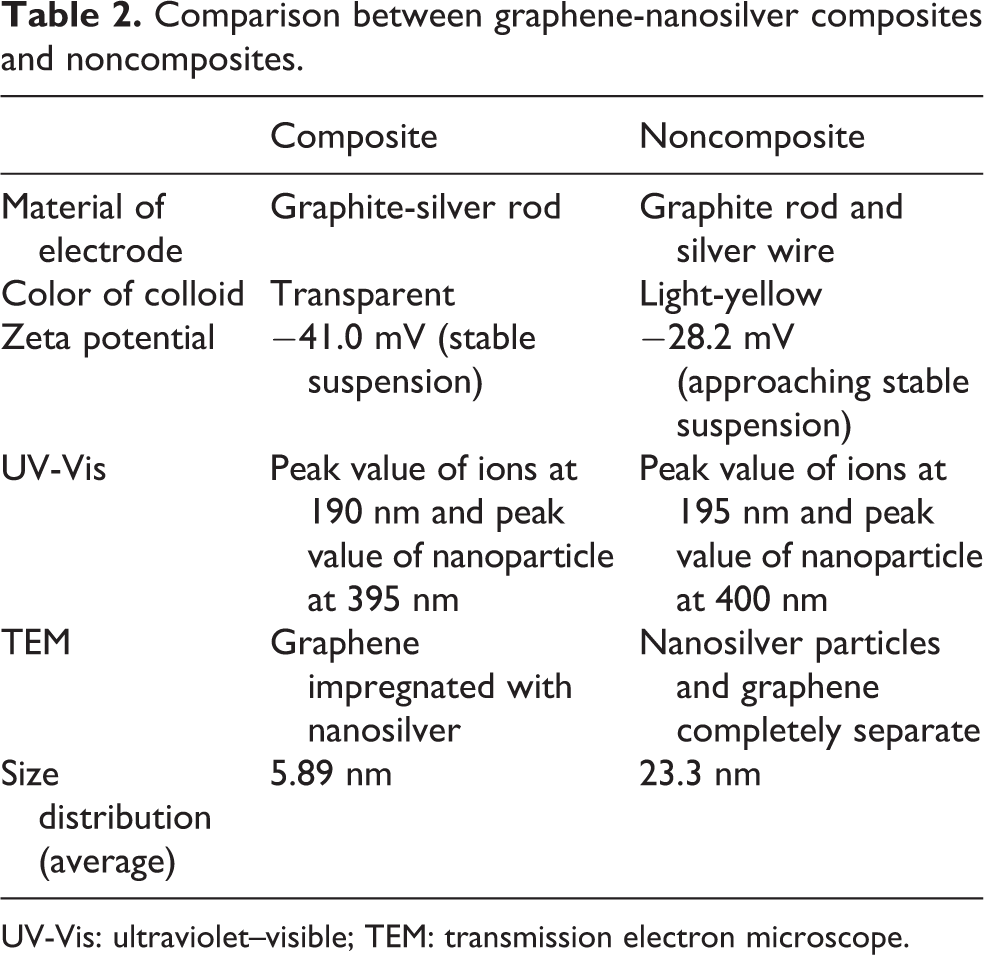
UV-Vis: ultraviolet–visible; TEM: transmission electron microscope.
Conclusions
This study prepared and compared graphene-nanosilver composites and noncomposites through an EDM system with graphite-silver rods, graphite rods, and silver wire. The conclusions are summarized as follows: The graphene-nanosilver composite colloids were prepared by using graphite-silver rods, whereas the noncomposite colloids were prepared by using silver (anode) and graphite rods (cathode). The results showed that we have to synthesize materials in advance during the preparation of graphene-nanosilver composites; two types of raw materials must not be used for discharge. Both the composites and noncomposites can be prepared successfully through SADM in deionized water. And the differences between composites and noncomposites would be compared through many methods. The TEM images demonstrated that, for the composites, the nanosilver particles successfully adhered onto the graphene surfaces, whereas for the noncomposites, the graphene and the nanosilver particles were completely separated. Without any surfactant or stabilizer added, the zeta potentials of the composites and the noncomposites were −41.0 and −28.2 mV, respectively, approximately −30 mV. The results showed that the samples with high zeta potential were not only stable but also featured high mutual repulsion between the particles which prevented precipitation. The stable suspension was confirmed after no apparent precipitation observed over a prolonged period.
Footnotes
Declaration of conflicting interests
The author(s) declared no potential conflicts of interest with respect to the research, authorship, and/or publication of this article.
Funding
The author(s) received no financial support for the research, authorship, and/or publication of this article.