
Abstract
Resilient supplier selection and optimal order allocation have become increasingly critical due to the rising risk of disruptions in procurement. This study proposes a novel two-stage approach that combines a Bow-Tie-based risk assessment method with a mathematical optimization model to address this challenge. In the first stage, a Bow-Tie diagram is used to evaluate disruption risks and quantify supplier resilience by analyzing their ability to absorb, adapt to, and recover from adverse events. To our knowledge, this is the first application of the Bow-Tie model in the context of supply chain disruptions. In the second stage, the resilience scores derived from the Bow-Tie analysis are integrated into a bi-objective mixed-integer linear programming (MILP) model that allocates orders to suppliers based on both cost efficiency and resilience performance while accounting for product substitution and delayed fulfillment under disruption scenarios. The proposed methodology is applied to a vaccine procurement supply chain, and the results provide actionable insights for decision-makers seeking to balance cost and resilience in supplier selection.
Keywords
Introduction
Supply chains are vulnerable to disruptions caused by natural disasters, political restrictions, human factors, and managerial failures. 1 Recent global events, such as the COVID-19 pandemic, have further intensified these challenges, with lockdowns, travel restrictions, and quarantine measures severely impacting suppliers worldwide. 2 As a result, managing supply disruptions requires a deep understanding of system resilience to ensure the continuity and adaptability of supply chain operations. System resilience can manifest across different layers, including technical, operational, organizational, and network levels, each contributing uniquely to the system’s overall ability to withstand and recover from disruptions.
Engineering resilience, a concept widely studied across disciplines, emphasizes a system’s ability to absorb shocks, adapt to changing conditions, and recover functionality efficiently. Applying resilience engineering principles to supply chain systems enables a more structured and proactive approach to selecting suppliers capable of sustaining operations under adverse conditions. 3 Similar to engineering resilience, organizational resilience has also received significant attention, focusing on workforce adaptability, leadership continuity, and institutional learning during disruptions. 4 Several studies attempted to measure resilience in a quantitatively. For example, Wang et al. 5 developed several resilience criteria and developed quantitative methods to measure each.
In supply chains, resilience is defined as the adaptive capability of the supply chain to prepare for unexpected events, respond to disruptions, and recover from them while maintaining continuity of operations at the desired level of connectedness and control. 6 Supply chain resilience thus emphasizes flexibility, visibility, responsiveness, and logistics capabilities as critical drivers for maintaining system functionality under disruption. In this study, we propose an approach that systematically evaluates supplier resilience and integrates it into procurement and order allocation processes.
A successful procurement processes depend on the ability to efficiently manage and mitigate supply chain disruption risks. This study jointly determines allocation of order quantities to the selected resilient suppliers. Procuring goods and services from a group of reliable providers can greatly reduce the likelihood of disruption spreading when a disruption occurs. 7 Hence, a well-defined and versatile process for supplier selection is an essential element of supply chain management during crises or disruptions. An important managerial understanding is that an effective supplier selection process should not only consider cost and quality when choosing suppliers, but should also give priority to variables like supplier diversity, redundancy, and flexibility. Implementing this strategy can effectively reduce risks and interruptions in the supply chain, while also fostering stronger partnerships with suppliers who are capable of adjusting and addressing unforeseen obstacles. The effectiveness of a supply chain depends on the successful process of selecting suppliers.
Nevertheless, when certain supply networks are disrupted, it might have negative consequences on other supply chains because of their crucial role in sustaining the everyday operations and efficiency of distribution systems worldwide. The vaccine supply chain has been identified as a crucial supply chain, particularly during the pandemic. Hence, the efficacy of the vaccine supply chain is vital in addressing worldwide disruptions in supply chains. Additionally, the pandemic has caused uncertainties in the availability of medical equipment, consumables, effective medications, and vaccines. 8 The effectiveness of vaccination campaigns relies heavily on the performance of vaccine delivery and the capacity of health centers to administer vaccinations. Hence, it is imperative to get the appropriate quantity of vaccines from reliable vendors in order to uphold the well-being of society.
This study makes two key contributions. First, it introduces the use of the Bow-Tie model to evaluate the potential for disruption and quantify the resilience of suppliers. To the best of our knowledge, the Bow-Tie framework has not been previously applied in the context of supply chain disruptions. Second, the resilience indicators derived from the Bow-Tie analysis are incorporated into a mathematical optimization model that supports supplier selection and order allocation decisions based on both cost and resilience considerations.
The subsequent sections of the paper are structured in the following manner: We first review the relevant literature and introduce the bow-tie model for assessing resilience level. A susequent section describes the mathematical model and the numerical study section provides a numerical example on the developed methodology and the last section concludes the article.
Literature review
Supply chain operations depend on the management and evaluation of risks related to disruptions, as well as the ability to recover quickly from such events. The supply process may be disrupted by several undesirable occurrences, including operational disruptions, natural disruptions, or political disruptions. Supply chain management is mostly unable to regulate calamities such as earthquakes, floods, storms, terror attacks, pandemics, and similar occurrences. Nevertheless, certain disruptions can be mitigated through the implementation of a robust supply chain design. These disruptions include equipment breakdowns, strikes, financial crises, and others. The topic of supply chain disruption risks continues to be prevalent in literature, despite having been extensively examined for a decade. In a recent study Nikkokar et al. 9 presented a comprehensive literature review on supply chain resilience and determined the factors affecting supply chain resilience by analyzing the survey data collected from manufacturing firms in Australia. Yu et al. 10 considers enterprise-level integration and ensuring operational resilience for organizations operating in global, data-intensive environments. Esmaeili-Najafabadi et al. 11 classified disruptive occurrences into two categories: naturally occurring disruptions and disruptions produced by human activities. Wang et al. 12 and Wang et al. 13 identified the need to quantify risks dynamically across whole interconnected supply chain networks rather than at a firm level and suggested a holistic approach. Fartaj et al. 14 categorized the elements causing disruption into four distinct categories: natural, anthropogenic, financial, and technical. They also demonstrated the interconnectedness between these components. Wang et al. 5 develop a method to classifies supply chain components in one of three risk categories based on a break-even analysis. Parast 15 investigated the correlation between supply chain disruption risk elements in four categories: demand risks, process risks, supplier risks, and environmental hazards. Tolooie et al. 16 demonstrated a robust architecture for a supply chain network that considers the potential for disruptions. Baghersad and Zobel 17 examined the impact of supply chain disruptions on the operational effectiveness of companies. Jiang et al. 18 consider a supply chain facing the risk of bankruptcy and model it a as a Stackelberg game. They showed that the supply chain may be coordinated through interest rate adjsutments. Bugert and Lasch, 19 established a system dynamic model to assess the impact of supply chain interruption on pricing effectiveness. Azadegan et al. 20 conducted a study on the relationship between learning perspective and organizational behavior modification in response to near-miss disruptive occurrences in supply chain disruption risk. The worldwide supply chains were greatly affected by the recent Covid-19 outbreak, leading to a shortage of inventory for many enterprises because to the disruptive events caused by the pandemic 21
The understanding of causal aspects of disruption risks in literature is equally significant as the idea of resilience in supply chain. The most widely recognized definition of supply chain resilience concept is the ability of the supply chain to effectively mitigate and withstand risks and disruptions. Resilient contributors or risk mitigation methods are defined as the capacity to effectively respond to unwanted and disruptive events in supply chain operations. Hosseini and Barker 22 defined the amount of supplier resilience by presenting three contributing factors: absorptive capacity, adaptive capacity, and restorative capacity, which help mitigate disruptions. Raj et al. 23 introduced a novel method to quantitatively measure supply chain resilience by modeling recovery time after disruptions using the Cox Proportional Hazards (Cox-PH) model. Wang et al. 5 realizing that supply chain resilience depends on the interrelated connectivity of supply chain components and introduces petri-net modeling for a holistic supply chain. In a follow-up article, Wang et al. 24 further develops the holistic supply chain approach and applies it to a case study. Our study differs from Wang et al. 24 in several ways: While Wang et al. 24 focuses on managing resilience on the entire supply chain network, we focus specifically on supplier reliance and order allocation to them based on their resilience levels.
To mitigate the impact of supply failures, the initial line of defense is to proactively manage risks by implementing solutions that incorporate redundancies within the system. This can be achieved by measures such as maintaining a substantial safety stock and physically separating facilities across different locations. The second stage of defense involves adapting to the conditions that arise from disruptive occurrences by implementing responsive measures, such as forming strategic relationships and implementing flexible distribution plans. The third and last level of defense is to restore the interrupted supply process to its operational condition by implementing agile techniques such as flexible budget planning and recovery planning (refs. 22,25). Fattahi et al. 26 proposed a resilience metric that considers the anticipated rise in operational expenses caused by disruptive events and the time required for recovery.
The topic of order allocation, as well as the selection of resilient suppliers, has been extensively examined in the literature. In their study, Kaur and Singh 27 examined the challenges associated with order allocation and supplier selection in the presence of disruption threats. They devised a Mixed Integer Programming (MIP) to address these issues. Dong et al. 28 considered the operational efficiency in an e-commerce warehouse, to increase supply chain performance. Alejo-Reyes et al. 29 addressed the issues of supplier selection and order allocation by employing a meta-heuristic methodology to find solutions. Hosseini et al. 25 developed a method to effectively use proactive and reactive tactics for allocating resources by introducing a stochastic bi-objective mixed-integer programming model. Product substitution is a crucial factor that must be considered while addressing the challenge of allocating orders. However, the issue of product substitution is commonly examined in conjunction with the topic of assortment optimization in academic literature. Product substitution refers to the act of purchasing an alternative brand within a specific product category when the preferred brand is not accessible. Yücel et al. 30 developed an optimization tool that helps retailers decide on the product assortment. This tool considers factors such as supplier selection, inventory management, shelf space limits, and customer substitution behavior. This study contributes to the existing literature by examining the causal causes of disruption risks and defense phases against disruptive events in order to determine the resilience of supply chains. Additionally, it intends to address the challenge of selecting resilient suppliers by including product replacement into order allocation.
Resilience indicator using bow-tie diagram
This study employs a bow-tie model to examine the primary aspects of supply chain disruption risks and strategies to mitigate disruptive events. Bow-tie is a graphical tool that visually represents the process of risk realization. It begins with the identification of risk components through fault tree analysis and then proceeds to determine the implications of the risk. Fault tree and event tree techniques are employed to generate a bow-tie diagram. The left half side is a typical fault tree structure assessing the probability of disruption and then progresses to identify intermediate causes and basic causative components of disruptive occurrences using connection gates such as AND and OR gates. The AND gate demonstrates that all converging causative elements must be present in order to produce a parent event. An OR gate demonstrates that the presence of just one causal element is sufficient for the occurrence of a parent event. The right half side is an event tree structure starting with the disruption risk as the first event and continues a series of defense phases to reach the result events, or repercussions. The fault tree and event tree structures collectively represent the various causes and consequences associated with the risk of supply chain interruption.
Figure 1 represents the bow-tie diagram developed to assess the risk of supplier disruption. The danger of disruption can arise from various reasons, including operational, natural, and political concerns. Operational interruption may arise from mostly internal and controllable factors, however, the other two disruption factors are more random and/or out of reach for the supply chain management team. Bow-tie diagram of supplier resilience indicator assessment.
The diagram’s right-hand side depicts the defensive measures taken by the supplier when faced with the danger of interruption. Absorption functions as the primary means of protection against disruption, which is also referred to as pre-disruption defense. 22 The supplier’s success rate at this stage is contingent upon operational variables, including surplus inventory, geographical proximity, backup supply contracts, and the robustness and reliability of their operations. In case the supplier cannot mitigate the risk of interruption in the first stage, then the supplier’s level of resilience is defined by their performance in the second line of defense, referred to as “adaptation”. The model helps us also to evaluate the degree of resilience. The bow-tie’s implications reveal the level of resistance. If the provider is unable of functioning in all three levels of protection against interruption, it will be evaluated as lacking resilience. However, if the supplier is able to handle the risk of disruption and maintain successful operations in the initial phase, it will be considered to possess a significant degree of resilience. One can conduct a quantitative analysis of suppliers’ resilience level using the structured bow-tie model. As seen in Figure 1, bow-tie diagram for supplier resilience indicator assessment is divided into two parts: Supply chain disruption risk factors and defense stages against absorption, adaptation, and restoration. Quantifying disruption risks involves assigning probabilities to the events that cause disruptions to suppliers in the fault tree in the diagram and quantifying probability of absorption, adaptation, and restoration stages of defenses requires assessing probability of success and failure of each defense stage. The chance of a disruption risk occurring in a fault tree can be determined by determining the union of minimal cut sets. A minimal cut set is defined as the smallest set of primary events that must occur in order for the top event to happen. 31 Event tree starts at the disruption risks given in the fault tree, and then, it advances through each branch to determine the chance of each consequence occurring, considering the success or failure of different defense steps. 32
Probability calculation for the child factors on the fault-tree part of the diagram.

Probability of the disruption risk is calculated as:
Event tree paths and their probability calculations in the bow-tie diagram.

Event tree starts at the disruption risks given in the fault tree, and then, it advances through each branch to determine the chance of each consequence occurring, considering the success or failure of different defense steps. For example, the medium severity level probability in Bow-tie model is calculated as follows:
Similarly, collapse probability is calculated by
The selection of suitable and resilient suppliers is performed using the bow-tie risk assessment model in the following manner: Step 1: Determine resilience level probabilities for each supplier i using Table 1 and Step 2: Select supplier i if Step 3: Calculate the resilience indicator Step 4: Rank the suppliers in descending order based on their RI values, and choose the best k suppliers.

Order allocation model for resilient supplies
In this section, we formulate the problem of selecting resilient suppliers and allocating orders over several periods, considering substitution among products. We formulate the problem as a mixed-integer linear program that utilizes as substitution rates as an input. The model finds the optimal quantity of vaccines to be purchased from different vendors in order to minimize the related costs and deviation from the desired number of vaccinations simultaneously. In case of product unavailability, we assume that demand is either substituted with another product or backordered.
We also assume that the product degradation rate is considered and varies product type. The notation used in the mathematical model is presented in Figure 2. Notation used throughout the formulation of MILP model.
In this study, the weighted sum minimization technique is utilized to find compromised solution for the selected weight values of the objectives. As shown in equation (1), the combined objective function value is obtained as a weighted and normalized sum of two objectives. The normalized objective function value is obtained based on the upper-lower bound normalization approach which generates a value between 0 and 1. The lower bound of objective function value 1,
Objective function:


Contraints:


Equation (2) in the mathematical model represents the aggregate of the two objectives that need to be minimized, considering their respective weights. Equation (3) represents the aggregate cost of the immunization strategy across all time periods. Equation (4) quantifies the overall difference between the resilience levels of chosen suppliers and their maximum resilience levels. Equation (5) defines a constraint set that guarantees the equality between the quantity of inoculation and the number of vaccines received from suppliers in good condition, considering the net inventory level of each vaccine for each period. Equation (6) illustrates the limits on the order quota, ensuring that the order can be made when supplier i is picked in period t. Equations (7)–(9) depict the equilibrium equations governing the direct transfers of vaccines, substitution vaccines, and delayed immunizations. Equation (7) ensures that the desired quantity of vaccinations is immediately fulfilled by the preferred vaccines and replaced by alternative vaccines from other sources. The equation also enables the deferral of unmet vaccines to future seasons. Equation (8) guarantees that the inoculation quantity is determined by adding together the directly chosen vaccinations and the vaccines that are substituted by others. Equation (9) constrains the replaced vaccines to a specific proportion of the unfulfilled vaccination demand. Constraint (10) specifies that there are no vaccinations that are delayed at the start of the planned period. Equation (11) imposes a crucial constraint by capping the total amount of inoculations in each period to match the government’s vaccination capacity. Equations (12) specify that the variables must have nonnegative discrete values and binary values, respectively.
Numerical study
The implementation of the proposed approach is illustrated through a fictitious numerical study in this section. Vaccine suppliers are considered in three categories based on their reliability levels as high, medium and low. Figure 3 summarizes the framework of the numerical study to illustrate the model for vaccine order allocation and supplier selection. Vaccine supply chain for the numerical example.
Probabilities exogenously obtained for the quantitative analysis of the bow-tie model.
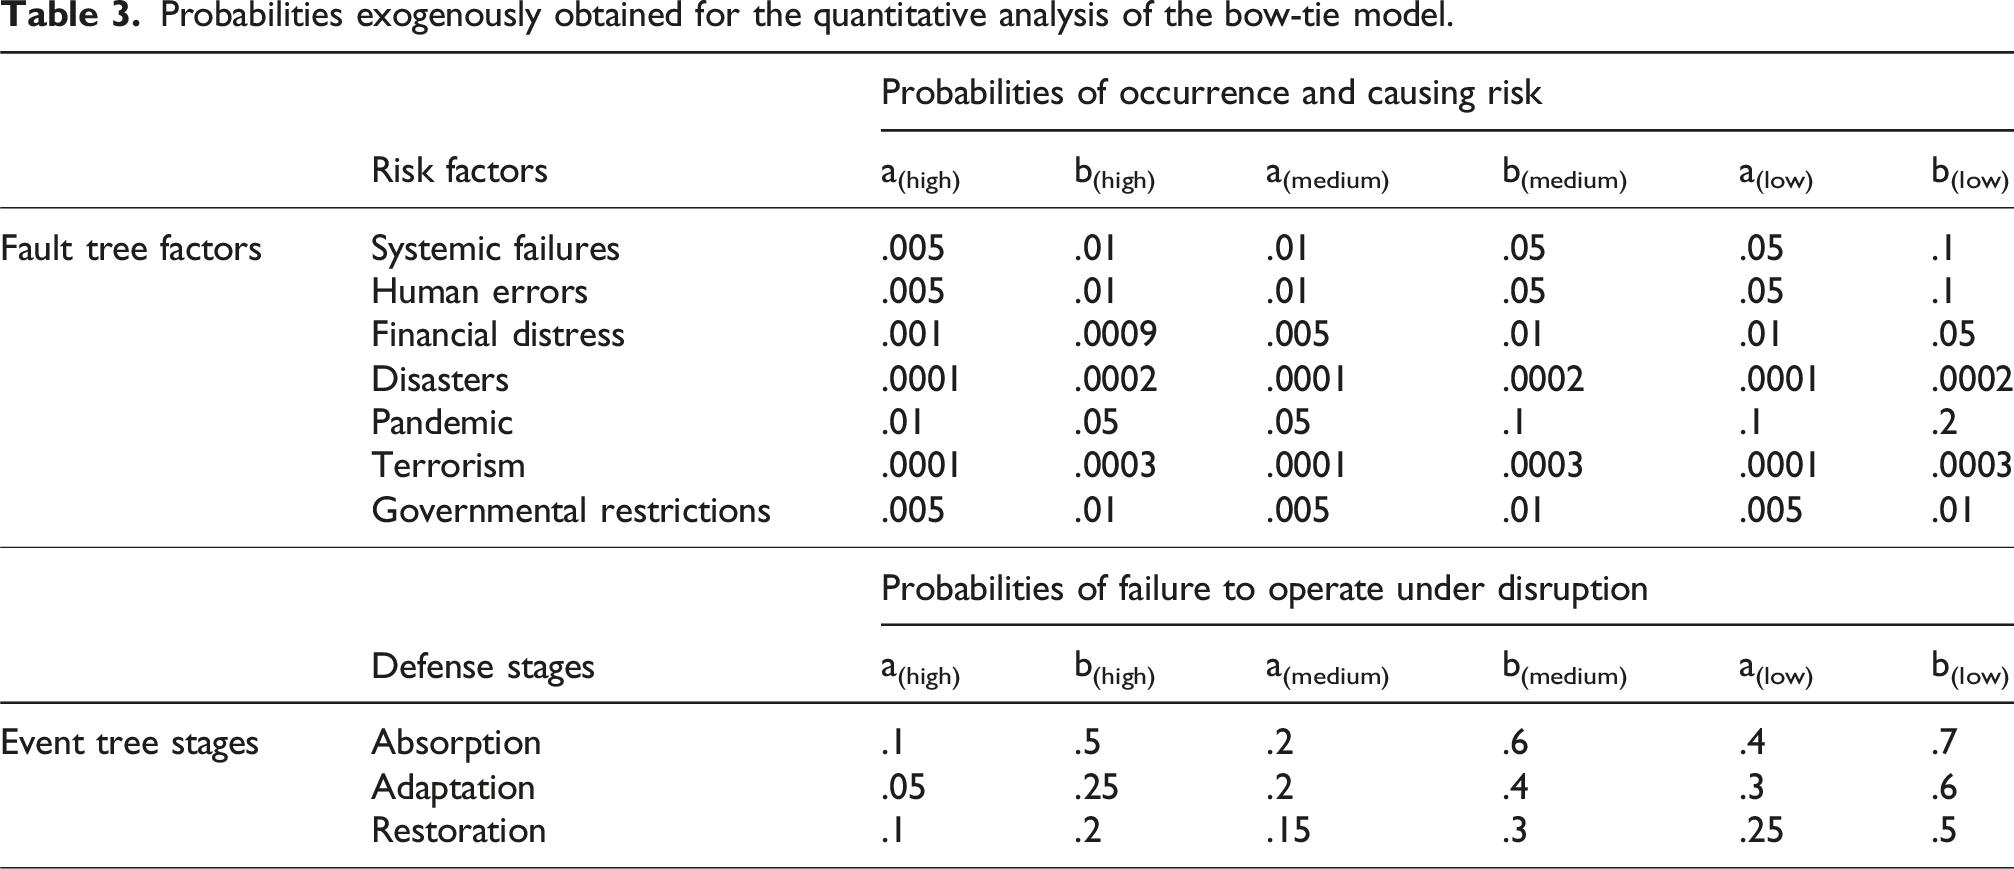
The probabilities of risk factors represent the combined likelihood values of both the occurrence of a factor and its consequences together in every purchase order. For instance, systemic failures might occur and cause organizational disruption with a probability of 0.005 in the best case and 0.01 in the worst case for a highly reliable supplier. The probabilities of failure at the defense stages represent the rate of failure to operate in every disruption incident. This study assumes that the failure rate at the defense stages does not depend on the reason for disruption risk. However, failure probability might be different for a different cause of the disruption.
For instance, when disruption happens due to a natural disaster or governmental restriction, it may last long enough to consume all vaccine buffers. Under these conditions, the probability of failure to operate could be much larger than the probability of failure when disruption happens due to a human error absorbed easily by the buffer inventory. The study considers the highest failure probability for the worst-case scenario under disruption and the lowest for the best-case scenario. The failure probabilities between the worst and the best cases are assumed to be distributed equally likely. Figure 4 represents the expected probabilities computed for fault tree disruption factors based on the equations shown in section 2. In Table 3, we let the probabilities of fault tree risk factors vary with respect to supplier reliability level. For instance, systemic failure risk probability is assumed to be uniformly distributed between 0.005 and 0.01 for high reliable suppliers, while it is uniformly distributed between 0.05 and 0.1 for low reliable suppliers. In other words, the chance of systemic failure occurrence assumed to be 10 times higher when vaccines are procured from a supplier with low level reliability. The probabilities regarding both the fault tree and event tree of bow-tie model are calculated as the expected value of uniform distribution between Expected probabilities of fault tree factors for different supplier reliability levels.

The probability of natural disruption when suppliers have high reliability:
The probability of natural disruption when suppliers have medium reliability:
The probability of natural disruption when suppliers have low reliability:
Thus, three different expected probabilities are generated for each main disruption factor using the best and worst cases with respect to supplier reliability levels as provided in Table 3. The probabilities of main factors and the disruption risk are generated as explained above and presented in Figure 4.
As seen in Figure 4, each main factor and disruption risk has three different probabilities representing the chance of occurrence considering supplier reliability level. For instance, the risk values for Natural Disasters are given as 0.0301, 0.0751 and 0.1501 when the suppliers have high, medium and low reliability, respectively. The probabilities are increasing while reliability levels are decreasing in most of the factors except for the Political Disruption risk, which is assumed to be not affected by the change in the reliability level of the suppliers. After obtaining the operational disruption risk, 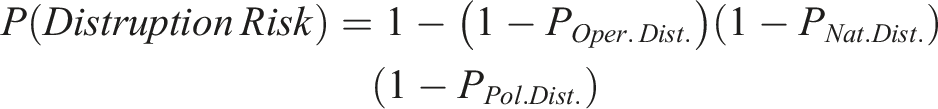
Therefore, disruption risk probability, 
The defense stages against disruption risk can absorb the risk by the means of buffer inventories and geographically dispersed locations. This is considered a high resilience against disruption. When absorbed at the first stage, the consequence of the disruption is low. When a disruption occurs, all the three defense stages may fail to operate. So, there is no resilience against disruption, and the consequence of the disruption is the collapse of the supply chain. The resilience level probabilities for each supplier at different reliability levels are computed using the equations explained in section 3, and the worst and best cases as given in Event Tree part of Table 3. Figure 5 represents the expected probabilities for the resilience levels of the suppliers at different reliability levels. As seen in Figure 5, disruption severity is low when the supplier succeeds in the first defense stage of absorption. However, disruption severity leads to the collapse of the supply chain when the supplier shows no resilience against disruption and fails to operate in all the defense stages. The probabilities are expected values computed based on the values provided in Table 3 using the equations of section 3. For instance, the probability of low severity disruption for the supplier with high reliability is computed as: Expected probabilities of event tree defense stages for different supplier reliability levels.

The probabilities of disruption severity levels and the resilience indicator values of suppliers.

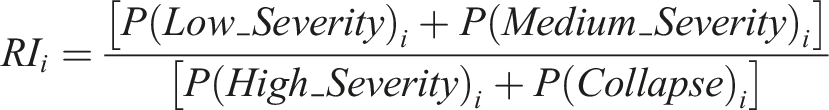
The resilience indicator value (RI) of a supplier is determined as a ratio of the low and medium severe disruption probabilities to the high severe disruption and the collapse of supply chain probabilities. For instance, RI of high reliable supplier is calculated as:
Thus, when the supplier reliability is high, the resilience measure indicates that the chance of recovery from a disruption risk with a low or medium loss is 21 times higher than the chance of recovery with a high loss or no recovery at all. The higher the RI value, the more resilient the supplier. Therefore, deviation from the highest RI value is used to determine resilient supplier as the part of bi-objective MILP model. The graphical interpretation of the resilience index value can be seen in Figure 6. The interpretation of RI values in terms of the expected percentage of disruption severity levels.
Figure 6 depicts that the disruption risk and high disruption severity probabilities are higher as the reliability levels of suppliers are lower. For instance, 30.01% of orders are expected to be disrupted and 24.1% of disrupted orders can be recovered with high severity or not recovered at all if the supplier is in the low-reliability category. For a highly reliable supplier, only 5.29% of orders are expected to be disrupted and only 4.54% of disrupted orders cannot be recovered with low or medium severity. For a supplier in the highly reliable category, this means that only 2.4 orders out of 1000 may have long delays or not deliver at all. However, this would be 72 orders out of 1000 when the supplier is in the low reliability category. The highest RI value among these categories is called the maximum resilience target value. It is input to the bi-objective in the MILP model involving both total cost and total deviation from the highest resilience indicator value. The solutions of the MILP model for all weight combinations (w1 and w2) between 0.010 and 0.998 are given in Table 4, and non-dominated solutions are indicated by shaded rows. Non-dominated solution is defined as a feasible solution x to problem is an efficient solution if there is not another feasible × such that Z(x) ≥ Z(x*) with at least one strict inequality. The resulting criterion vector Z(x) is said to be non-dominated (Sylva and Crema, 2004). The solutions are generated by changing the weights of the objective functions with 0.001 increments to evaluate all possible solution alternatives between two subsequent non-dominated solution sets.
Non-dominated solutions set for varying weight value combinations of objectives.

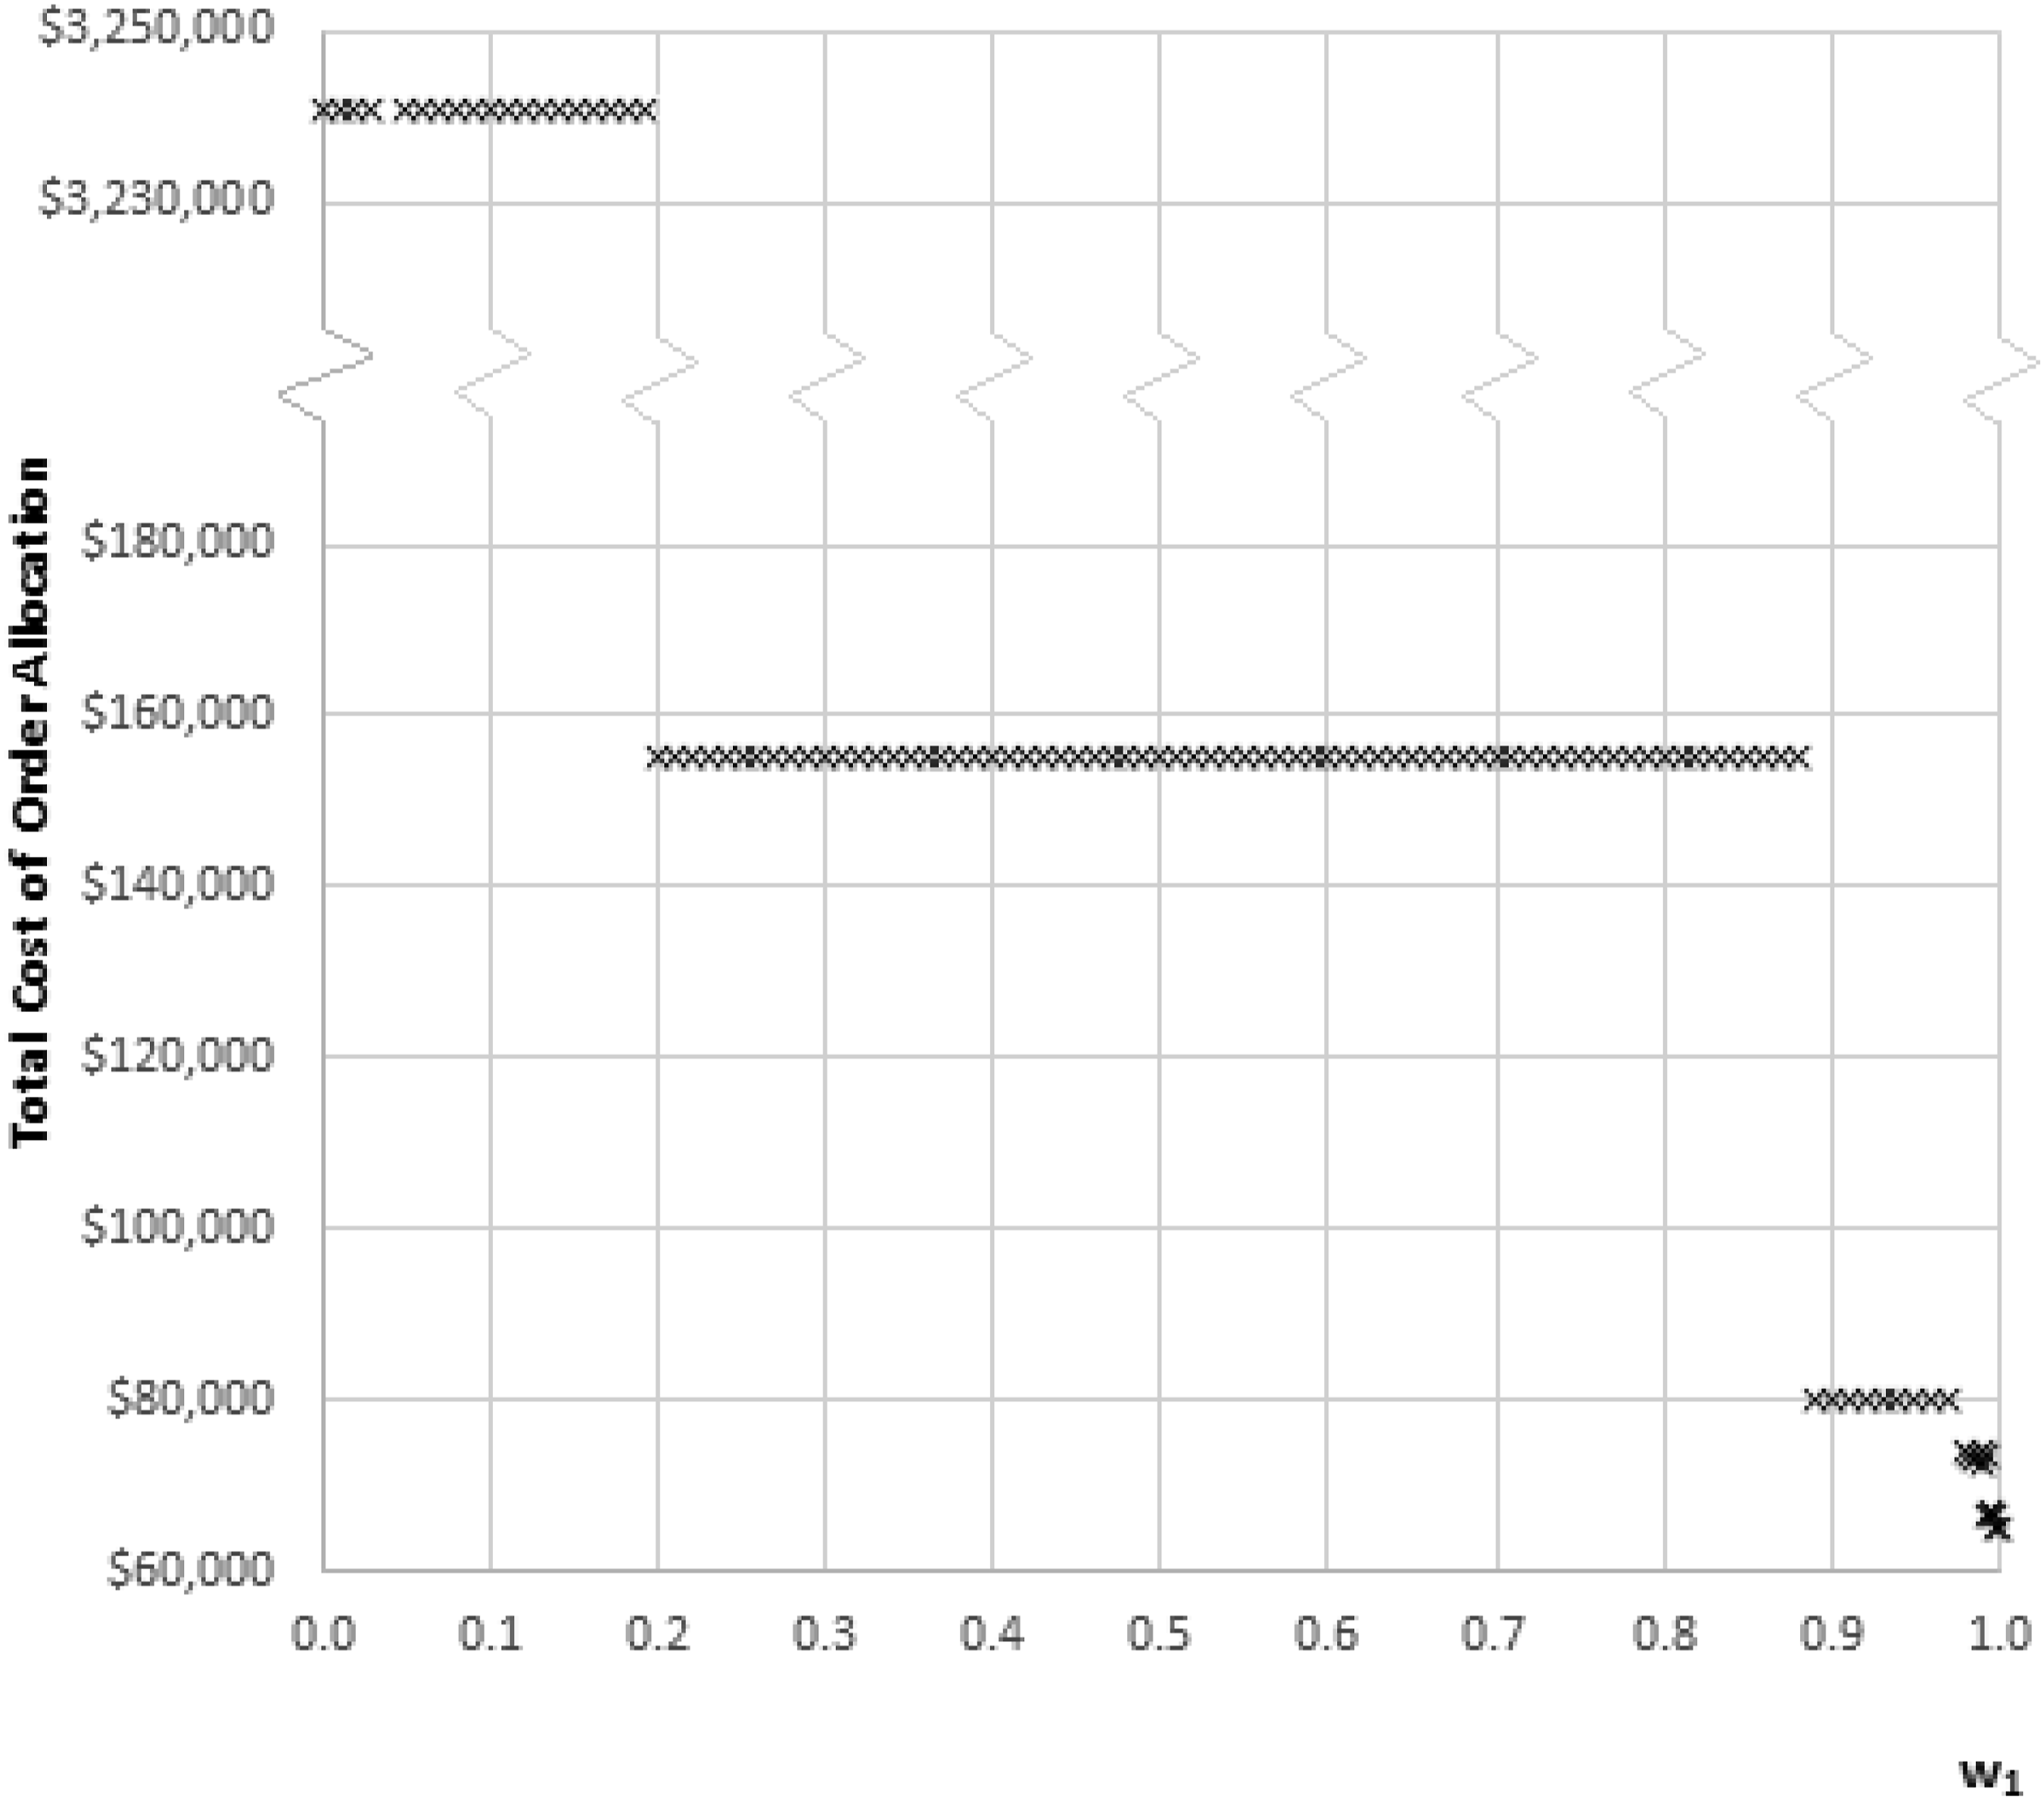
The total cost of order allocation with respect to varying weights.

Total deviation from the maximum resilience index value with respect to the varying weights.
Both objective functions with respect to weights decrease as a step function. Figure 7 represents the change in total cost while increasing the weight of the total cost objective. The total cost of vaccine order allocation is over $3M when the weight for the objective of cost minimization is less than 20%. The solution with the highest cost in Figure 7 is also impractical to implement since this solution suggests postponing all vaccinations regardless of demand requirements. Once the weight is 20% or more, the total cost objective drops down largely and becomes less than $160K. The same solution is valid while the weight of the total cost objective is less than 88%. Another large change in total cost is observed when the cost minimization objective is more important than 88%. When the weight is between 89% and 97%, the total cost is slightly less than $80K. The total cost continues to reduce for almost every slight increase in the weight by more than 97%. The minimum cost is reached when the weight is set at %99.8.
The total deviation from target supplier resilience as a function of weight values is shown in Figure 8. Every slight change in the weight value produces lesser and lesser value in deviation starting from w2 of %0.2. The maximum deviation of 63.24, which involves the selection of suppliers with lesser resilience index value is obtained for the weight value equal to or smaller than 0.002. Once the weight of minimizing deviation from resilience is set to equal to or greater than 0.12, the practical most resilient supplier selection solution is obtained. The solution for the range of weight values between (w1 = 0.2, w2 = 0.8) and (w1 = 0.88, w2 = 0.12) is called as the practical most resilient solution, because the solution with the minimum deviation value of 0.0 is not practical to implement due to the fact that no supplier is suggested to be selected and all vaccination requirements are suggested to be postponed in that solution.
The non-dominated solutions set for the normalized and the real values of objective functions are given in Figures 9 and 10, respectively. Non-dominated solutions set of objective function values. Non-dominated solutions set by comparing z1 versus z2 actual values.
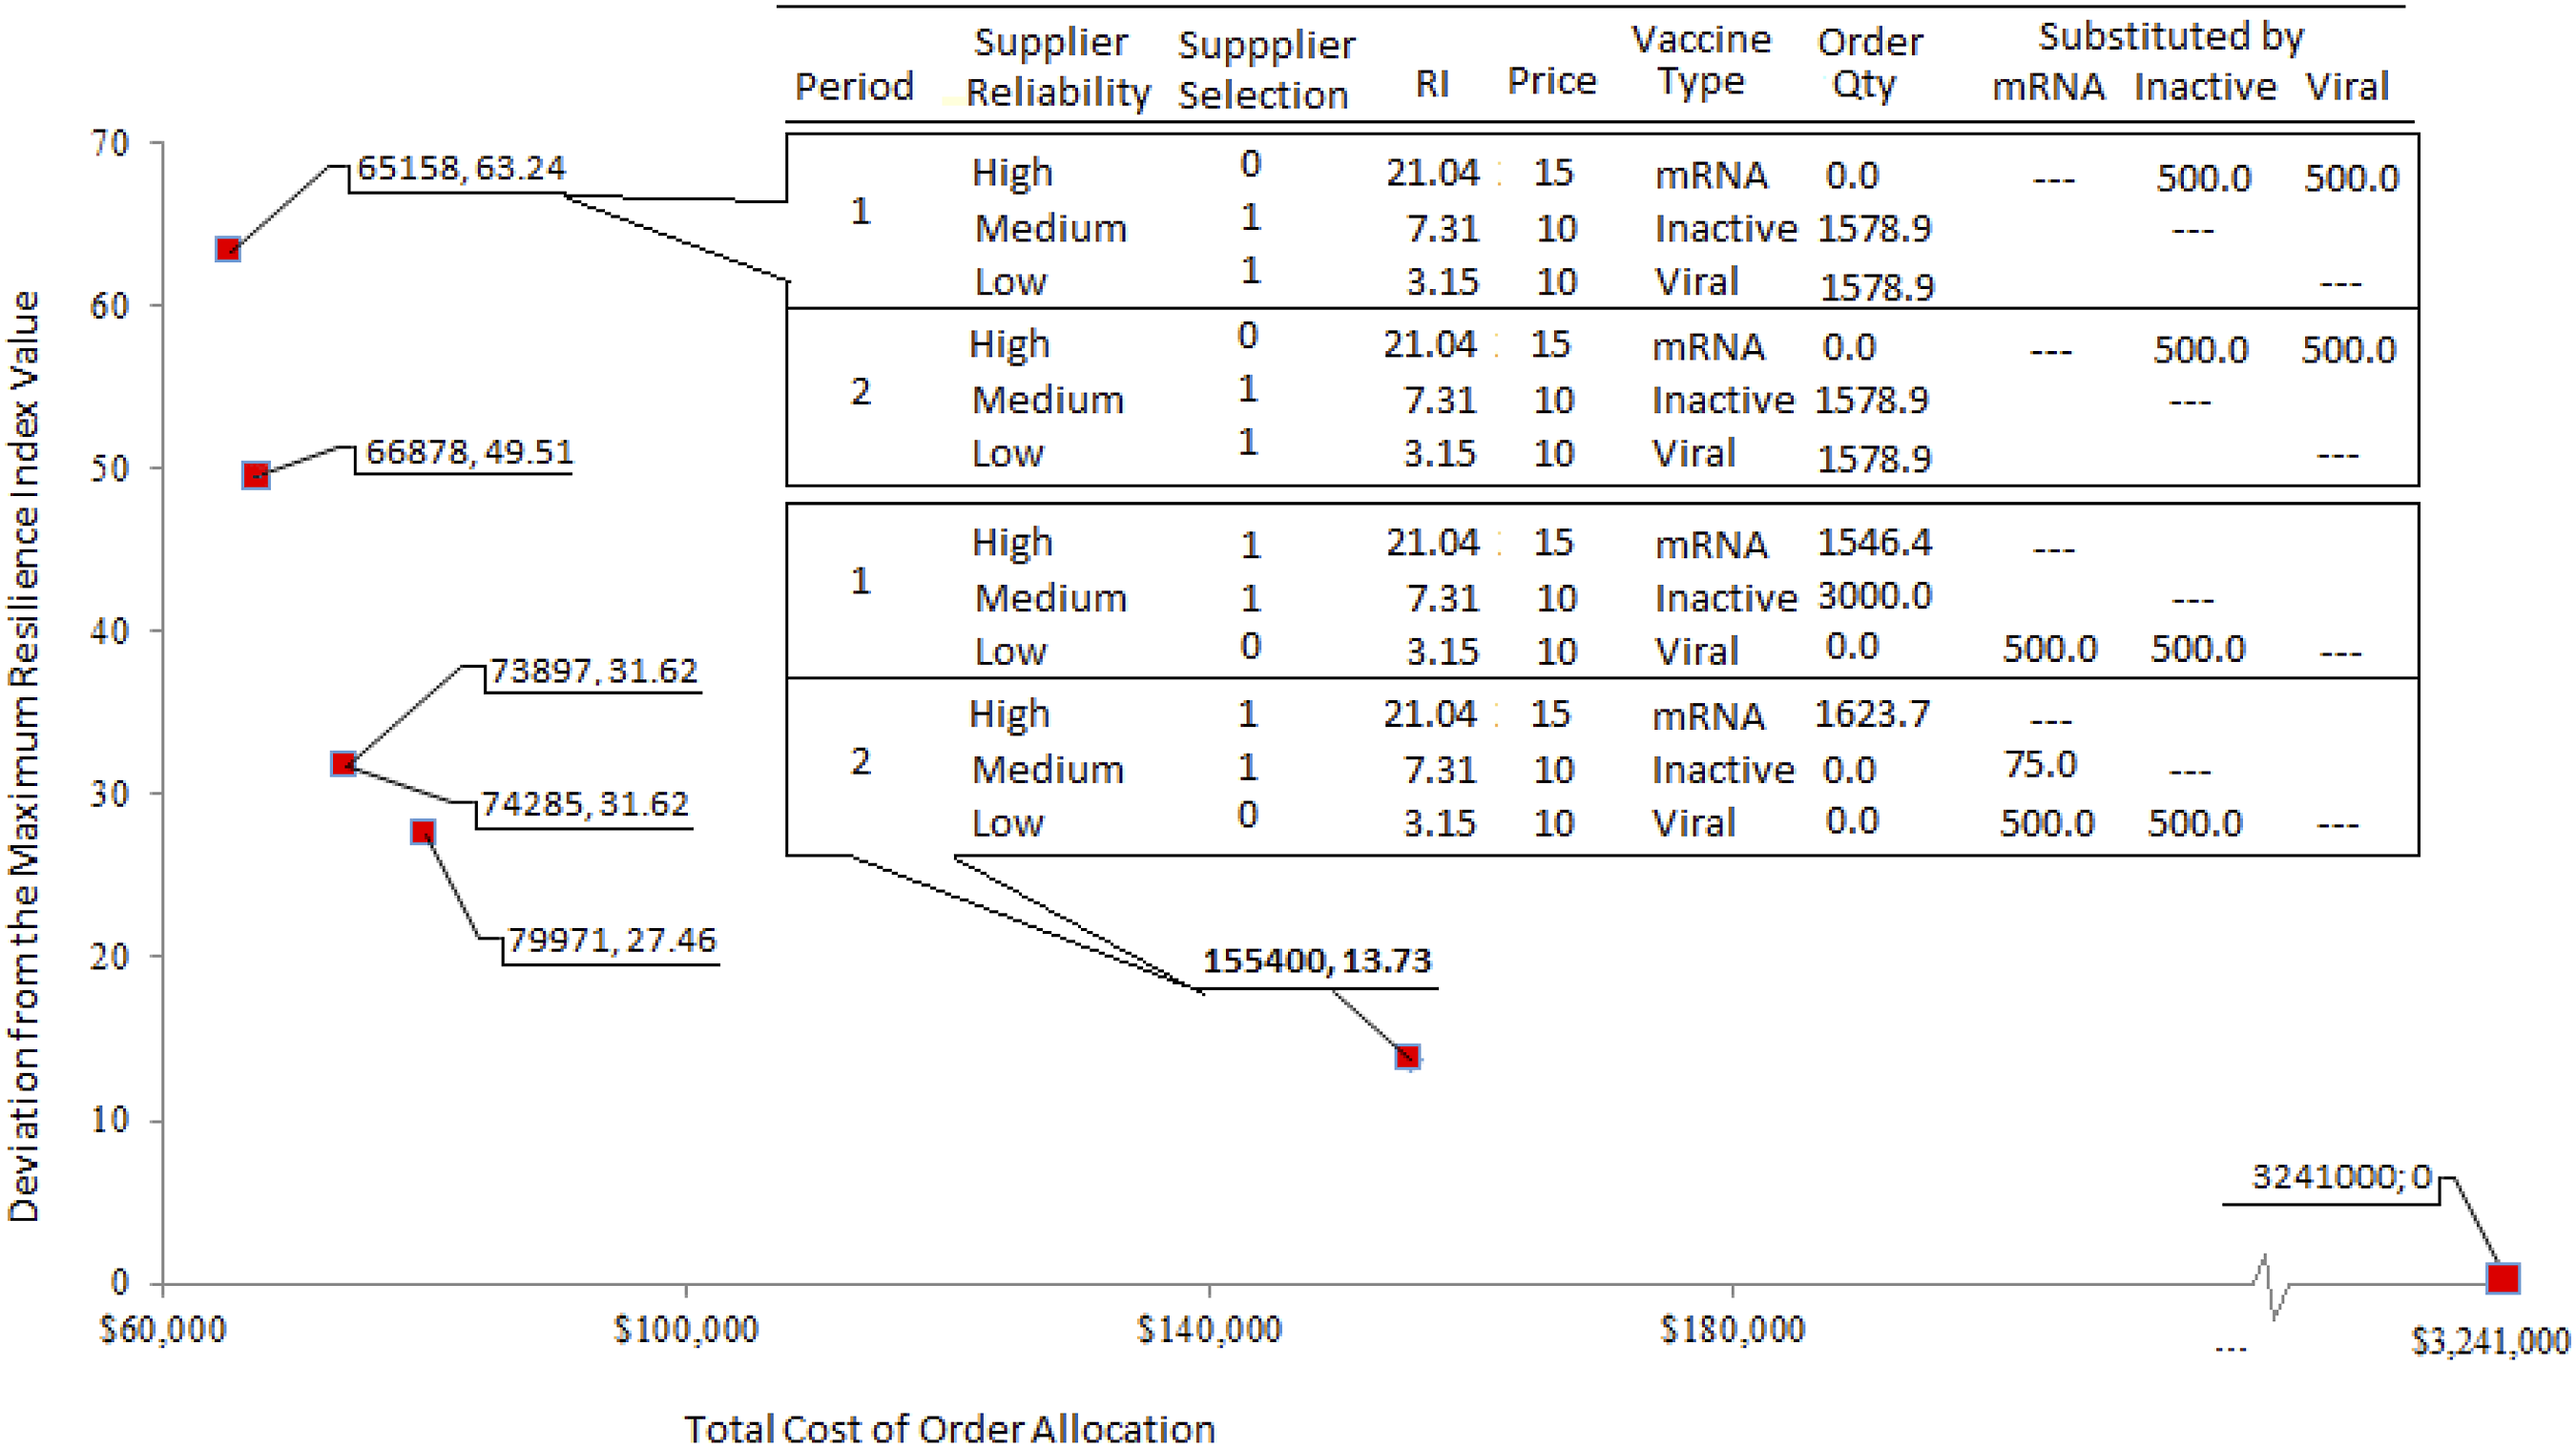
The most frequently repeated solution is indicated in bold in Figure 9. This solution shows 2.84% normalized value of cost minimization and 21.71% normalized value of minimum deviation from the target resilience in supplier selection.
Figure 10 compares the minimum cost and the practical most resilient solutions in terms of the decision variables such as the supplier selection results, order allocation, and vaccine substitutions. It is also observed that the minimum cost solution chooses less resilient suppliers producing less costly vaccines. Therefore, mRNA vaccines are substituted by Inactive and Viral Vector vaccine types. However, the practical most resilient solution with a higher cost of $155.4 K and fewer deviations from the target resilience value of 13.73 suggests ordering from high and medium reliable suppliers with larger resilience index values. The solution with the practical minimum deviation value also suggests that Viral Vector vaccine requirements are substituted by mRNA and Inactive vaccine types.
Results of the most resilient practical solution.
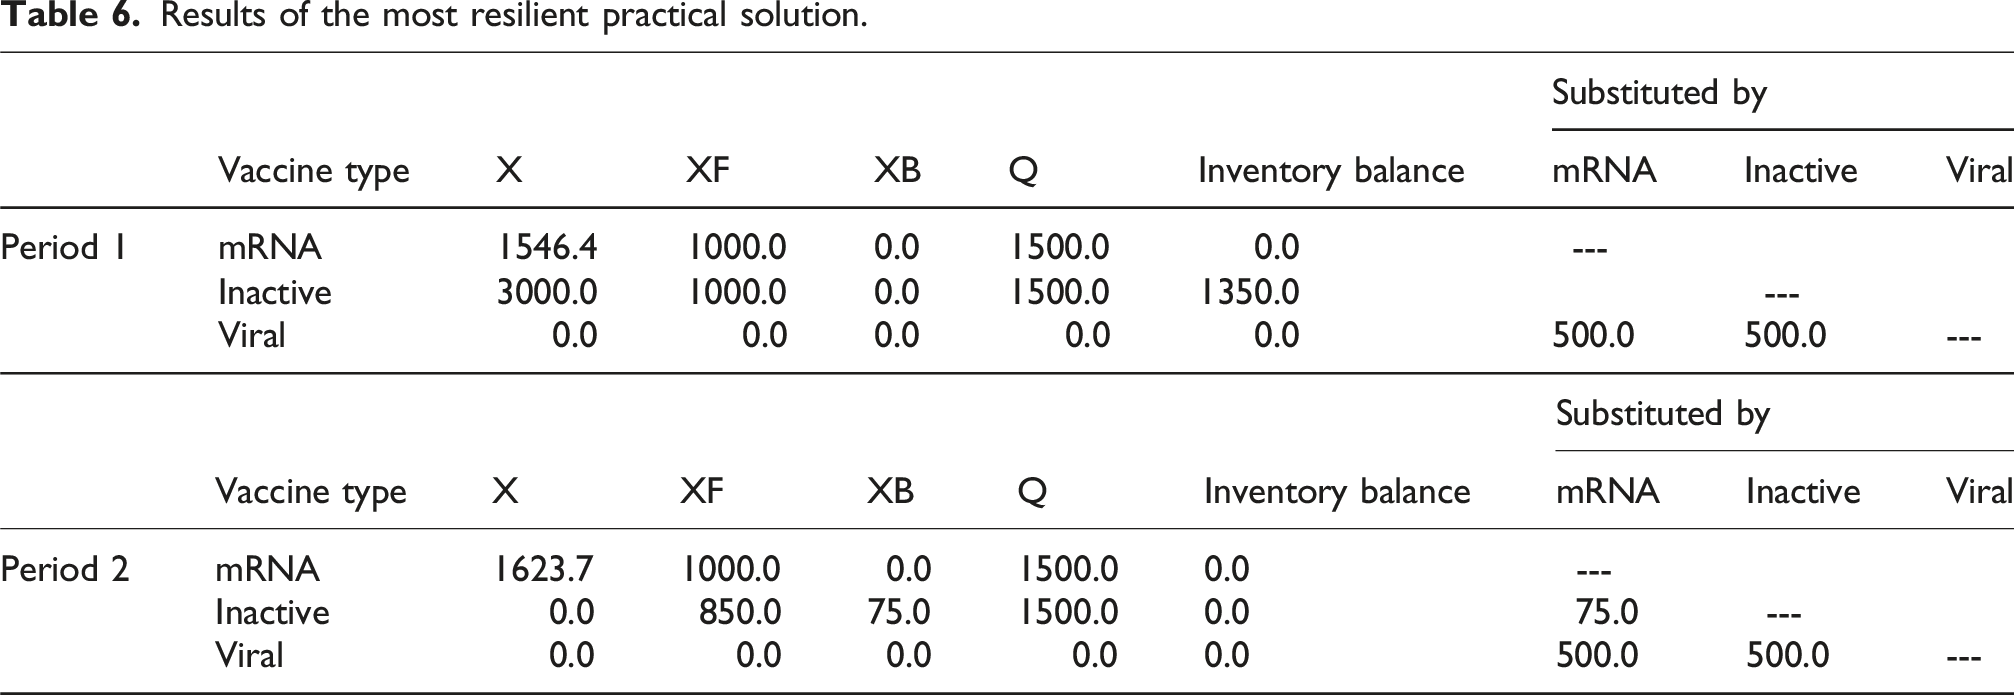
The received order quantities (X) from high and medium reliable suppliers in period 1 are 1546.4 K and 3000K, respectively. 1000K of vaccines received from each of these suppliers are used for vaccination of the people who prefer these vaccine types, which is denoted as direct vaccination in the model (XF). 46.4 K are spoiled due to storage and usage problems. The remaining vaccines are used to vaccinate the other people who accept to be vaccinated by these vaccine types in the absence of their preferred vaccine (XS). Thus, the total inoculation quantity of mRNA in period 1 is 1500K (Q) in Table 5. Table 6 also shows that only 75 thousand of vaccination of the people who prefer the Inactive vaccine type is postponed to the further planning periods.
Conclusion
The study focuses on the issue of selecting resilient suppliers and allocating vaccination orders in the presence of disruption risk. An innovative strategy for selecting resilient suppliers is to build and deploy a risk assessment model utilizing a bow-tie structure. This model helps identify the resilience level of the suppliers. The suggested approach consists of two phases: the initial phase entails evaluating risks and determining the values of resilience indices. In the second phase, suppliers are chosen based on their ability to withstand challenges, and vaccine orders are allocated in a way that minimizes costs and deviations from the desired level of resilience. Substitution is allowed between selected suppliers to achieve these objectives. In the second phase, resilient supplier selection is established based on the results of the risk assessment in the first phase. The proposed bow-tie model produces the probabilities for disruption severity levels depending on how the defense stages are successful in preventing the disruption risk from interrupting the supply chain operations. In the developed bow-tie risk assessment model, three defense stages are defined as absorption, adaptation, and restoration. The highest severity level of the collapse of the supply chain occurs if all the defense stages fail to function against the disruption risks. The bow-tie model is also used to generate the resilience index values of suppliers, and it is a ratio of the probability of success in one of the first two defense stages to the probability of failure in both first two stages or in all three stages. These resilience index values are input to the developed MILP model for vaccine supplier selection and order allocation. The formulation of the model allows vaccine postponement and vaccine substitution among vaccine types. The entire approach is implemented on an illustrative numerical example and results are discussed under a variety of weight combinations for the objectives. The most frequently repeated solution shows a 2.84% normalized value of cost minimization and 21.71% normalized value of minimum deviation from the target resilience in supplier selection. It is also observed that the effect of the substitution on the number of orders and the quantity of postponed vaccination is substantial.
The study can be improved by incorporating vaccine efficacy and priorities of categories of the people to be vaccinated into the model. Having further experimentation of the effect of substitution ratios between vaccine types on the supplier selection and order allocation would also help deeper understanding of the concept of product substitution.
As a future research direction, it may be valuable to view the supply chain as a service system as defined in Ref. 33 and apply domain modeling, 34 which captures the essential components of a complex system such as a supply chain. Another promising avenue for future research is to integrate the method developed by Han et al. 35 to the order‐allocation mixed-integer programing model by systematically generating “damaged” versions of the vaccine‐supply instance (e.g., individual supplier failures, capacity cuts, or demand surges), re‐solving the weighted cost–resilience model under each disruption, and computing the ratio of damaged‐to‐nominal objectives. Such a study would yield a single worst‐case resilience index that quantitatively characterizes how much the combined procurement cost and resilience‐deviation penalty can increase under real‐world disruptions.
Footnotes
Funding
The author(s) received no financial support for the research, authorship, and/or publication of this article.
Declaration of conflicting interests
The author(s) declared no potential conflicts of interest with respect to the research, authorship, and/or publication of this article.