
Abstract
We present a case study that introduces a systematic framework for designing an automated guided vehicle (AGV) order fulfillment system. The multi-stage framework integrated discrete event simulation (DES), super-efficiency data envelopment analysis (S-DEA) model, and Design of Experiments (DOE) methodologies for the design of an AGV system in an existing large-scale surgical complex within a comprehensive hospital in Singapore. Performance metrics derived from this model were consolidated into a single relative efficiency score using the S-DEA model. This efficiency score was then utilized in a DOE methodology, combined with a post-hoc model selection process, to robustly identify appropriate models for evaluating alternative system designs. The proposed framework optimizes AGV deployment by first identifying opportunities for AGVs to add value within the surgical system through a value-stream mapping approach. It then derives the optimal system design by balancing cost efficiency, manpower reallocation, and order fulfillment rates, facilitated by the S-DEA model augmented with the DOE approach and post-hoc model selection. Application of this framework to the surgical complex revealed several insights that can significantly enhance AGV efficiency prior to actual deployment. However, a key limitation of this case-study-based approach is its limited generalizability across different systems. Despite this, the methodology provides a robust foundation for AGV system design in similar healthcare environments.
Keywords
Introduction
Logistics activities in hospitals refer to purchasing, storing, and transporting goods, and are very labor intensive. Logistics and supply chain costs can account for 40% of total hospital operational budget and 61% of those costs can be from perioperative services. 1 Many of the logistic activities are traditionally labor intensive divert trained healthcare manpower away from patient care. Hospital material management, such as the restocking of supplies, are known to be major drivers of nursing time diverted to non-essential activities. 2
Healthcare automation with the use of automated guided vehicles (AGVs) have shown significant promise in recent years to support material handling and inventory management activities. 3 Effective automation in materials management systems for hospitals must consider multiple conflicting objectives. Apart from economic viability (e.g., minimization of the cost per fulfilment), the ability of automation to release trained healthcare manpower for patient care tasks, 4 and the order fulfilment rates by automation are also important operational considerations. 5 These conflicting objectives can be evaluated from the lens of productive efficiency 6 of automation system across alternative designs. 7
We utilize a case-study approach to describe the implementation of a novel framework for the evaluation of AGV system efficiency across different design alternatives. The case study is based on the design optimization of an AGV system deployed in an existing operating room (OR) complex in Singapore. The framework first utilized a value-stream mapping (VSM) approach 8 to document the value and non-value-adding processes in the OR complex. A discrete events simulation (DES) model of the OR complex materials management system is then developed to evaluate various designs of an AGV system to augment (but not replace) manual order fulfillment activities in the OR complex. To deal with the multiple design objectives, a non-parametric super efficiency data envelopment analysis (S-DEA) model is introduced to derive a single efficiency objective. 9 The S-DEA model leverages on a non-parametric mathematical optimization model that allows for the differentiation of system alternatives along the production frontier, providing a more granular basis for performance evaluation. Design alternatives across different demand scenarios can then be effectively evaluated with a design of experiment (DOE) approach. 10 Finally, a post-hoc analysis identifies the appropriate model form for the final design optimization of the AGV system for the OR complex.
The application of DES for AGV system evaluation is not new, 11 and numerous authors have concluded that simulation modeling is effective in the evaluation of AGV systems.12–14 Similarly, the use of data envelopment analysis (DEA) model coupled with DES for determining efficient AGV fleet sizes has also been reported in the literature, albeit limited to the use of basic DEA models, such as the Charnes, Cooper and Rhodes (CCR) model. 15 The basic DEA models are not able to further differentiate efficient designs at the production frontier. 15 DOE approaches augmenting virtual DES models for the efficient evaluation of alternative system design have also been reported in the literature. 16 Individually, these approaches are not novel in their application to AGV systems designs. 11 However, there remain gaps in the development of a framework which can accurately differentiate AGV system design options across different order demand scenarios considering multiple conflicting tradeoffs. Furthermore, specific real-world case studies reporting the nuances of such tools within a comprehensive framework for AGV systems in cyber-physical systems in a large scale OR complex are relatively scarce.
Our case study describes the implementation of a framework that integrates the mature tools of DES, S-DEA model, and DOE to evaluate the design of AGV order fulfillment systems that augment (and not replace) human service providers within the context of a cyber-physical system. The case study is based on an existing operational OR system within a hospital complex. By considering different demand scenarios in addition to the actual historical demand, the case study showed that this framework offers a more thorough assessment which provided valuable insights for developing more robust and cost-efficient plans in AGV system designs. The S-DEA evaluates productive efficiencies across multiple input and output variables considering efficiency scores that can be differentiated for design alternatives along the production frontier. This facilitates the DOE and post-hoc analysis phases for generating design insights.
Data and methods
Data from use case
The study hospital (SH) for the case study was one of the largest comprehensive public hospitals in Singapore. The SH had more than 30 clinical disciplines and approximately 1700 inpatient beds at the time of study. The hospital saw more than 25,000 surgeries and had 18 ICU beds in 2019. Data for this study was derived from the SH’s Electronic Medical Record (EMR) based on Sunrise™ Clinical Manager (Allscripts, Illinois, USA), which was integrated with data from multiple other healthcare transactional systems (including administrative and ancillary systems) and loaded into an enterprise data warehouse. In the OR complex, ordering of instruments was done on the EMR, while in the Ambulatory Surgical Centre (ASC) the orders were submitted through a proprietary system known as the T-doc system. Study data contained all types of instruments for elective and emergency surgeries across five of the most common surgeries performed by the colorectal surgical department. The Ministry of Health Table of Surgical Procedures (TOSP) was used to identify these procedures. 17 A total of 12,745 requests from 253 types of instruments for 16 OTs were included in the study. Data was deidentified in compliance with existing data governance and information security policies and was not required for review by the SH Centralized Institutional Review Board (2019/2597).
Methods
The framework based on data envelopment analysis (DEA), discrete events simulation (DES) and design of experiments (DOE) is summarized in Figure 1 and described in this subsection. Framework for design optimization of AGV system.
Process understanding with value-stream mapping (VSM)
Through numerous focus group discussions (FGDs), the study team developed a detailed understanding of the surgical inventory management process. Each surgery necessitated a range of resources, from surgical instruments to medical consumables. Surgical teams can pre-order inventory based on the OR schedules known at least 1 day in advance from the Theatre Sterile Supply Unit (TSSU). Besides these regular orders, ad hoc requests can be made by surgeons using a “preference card” system on the day of surgery.
18
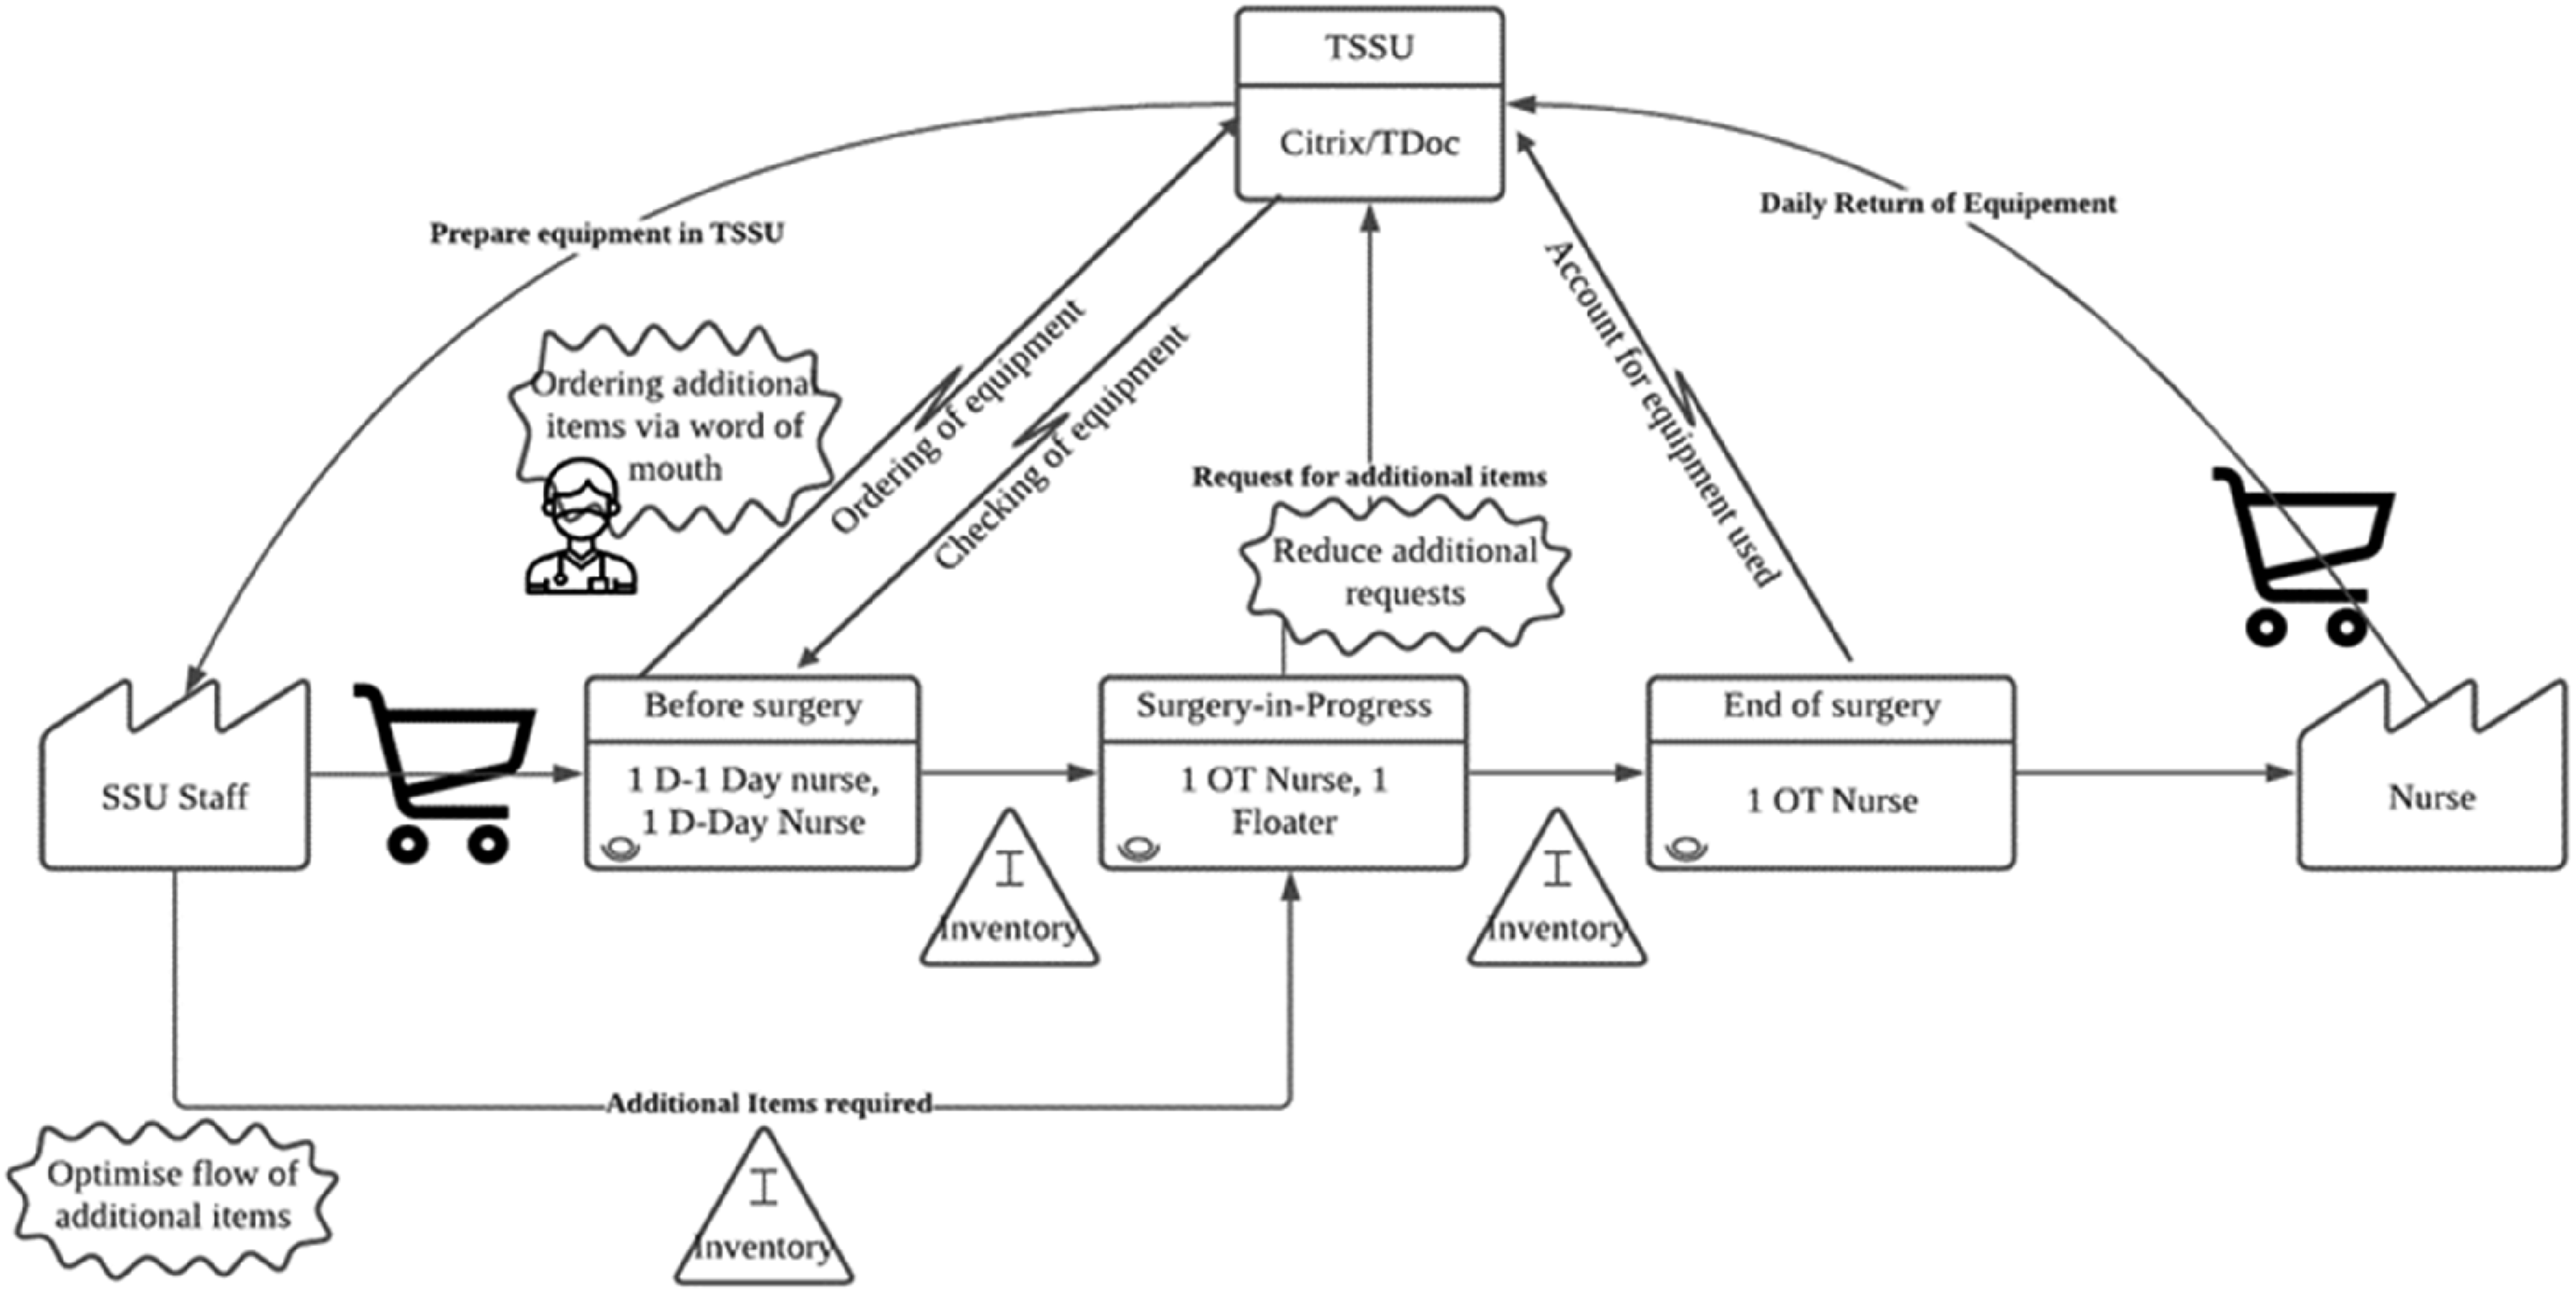
Surgical instruments were sterilized and prepared at the TSSU, which is not co-located within the OR complex. While there were inventory storage areas within the OR complex, inventory not available had to be retrieved from the TSSU. OR circulating nurses were responsible for retrieving the necessary inventory from various locations. This search and retrieval process consumed a significant portion of the nurses’ time. A summary of the order fulfillment processes is presented in Figure 2. Order fulfilment processes in the OR complex.
With an initial understanding of the order fulfilment processes in the OR Complex, value and non-value adding activities were identified and documented via a value-stream mapping (VSM) approach. The VSM is shown in Figure 3. Through the VSM, and the following wastes (non-value adding tasks) were identified: 1. Overstocking of buffer inventories in the OR inventory areas due to uncertainties in the surgery. 2. Errors in order picking and the need for rework due to the ad hoc demands. These errors were worsened by the variety of inventory permutations required for each surgery. 3. Unnecessary movement from the TSSU to the OR complex as these two locations were not collocated. This was worsened by numerous unplanned ad hoc requests. 4. Wasteful searching tasks. When additional surgical instruments were required, possibly caused by a complication in the surgery leading to ad hoc requests, nurses would have to search for the requisite inventory. VSM of the order fulfilment process.
The non-value adding activities identified through the VSM point to the need for an intelligent automated order fulfillment system that can be achieved via an efficient AGV system.
Development of the DES model
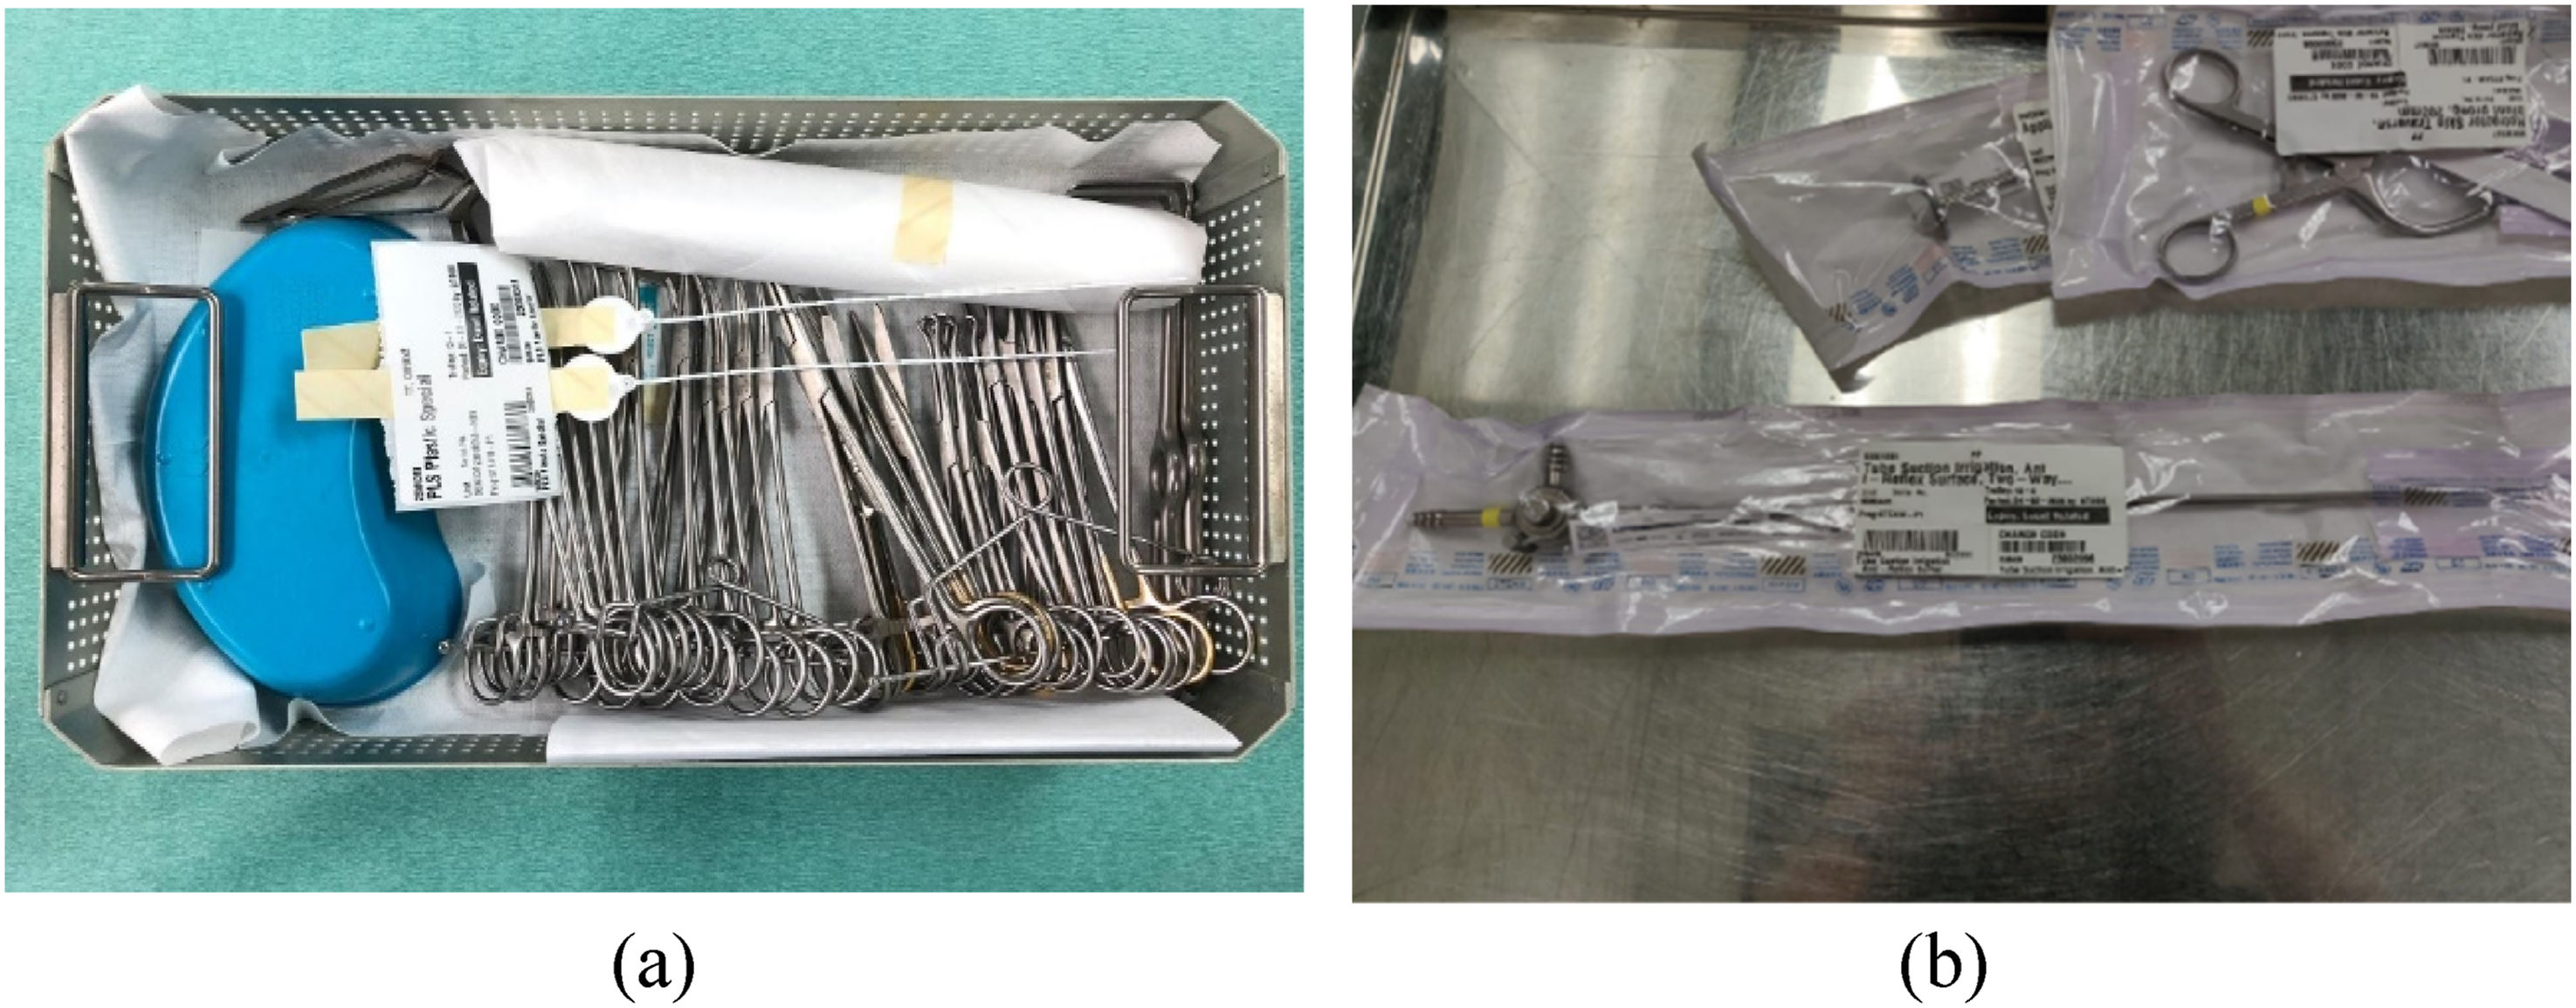
The main wastes identified were generally associated with ad hoc requests that were not fulfilled 1 day before the surgery date. The DES model thus focused on modelling the ad hoc requests that included additional requests from the surgeon “preference cards” submitted on the surgery date. Ad-hoc requests could also be due to unforeseen events that could happen during the surgery. Given the scope of the DES model, the input data required were: (1) historical ad hoc request data; (2) types of inventory (instrument set or loose packages of consumables and non-consumables as shown in Figure 4; (3) layout of the OR Complex with the AGV routing design (see Figure 5); (4) resources required (costs and workload information related to the AGV system and circulating nurses shown in Table 1, and; (5) Order picking heuristics (or AGV assortment algorithm) programmed into the AGV system. The study evaluated two order picking heuristics for the AGV system: 1. Base Assortment Policy. One item for each of the topmost requested instruments (e.g., there will be 12 instrument slots for two AGVs, both carrying one item from the top six items highest in demand). 2. Improved Assortment Policy. This algorithm prioritizes the selection of instruments with the highest ordering frequencies relative to the least requested instrument included in the assortment. The pseudo code for this algorithm is shown in Figure 6. Types of inventory (a) instrument set package; (b) loose packages. Schematic of the OR Complex and AGV routing and docking plan. (a) Input parameters for simulation model; (b) input parameters for cost analysis. Note: (1) associated with “Capital cost of AGV”, “Salvage cost of AGV”, “Annual maintenance cost of AGV”, “Electricity price”, “Annual average wage of nurse”; (2) associated with “Discount rate”
21
; (3) associated with “Electricity price”
22
; (4) associated with “Annual average wage of nurse” and “Annual wage change”.
23
Algorithm for the improved assortment policy (Note: instrumentList denotes the combined assortment of instruments in the AGVs, instrumentProbabilities denotes the relative ordering frequencies of instruments, and N is the maximum number of slots dependent on the number of AGVs deployed).


The DES model operated through a series of logical steps. First, a request for ad hoc inventory was generated based on historical data. Next, the specific operating room (OR) where the demand originates was identified using the same data source. The type of demand was then determined, with the understanding that demand distributions for instruments vary across ORs, days of the week, and times of day due to the different types of surgeries performed (e.g., total knee replacement, colorectal surgery, emergency surgery). The DES modelled a semi-automated cyber-physical system. Once the required instruments were identified, the model checked if the instrument is within the AGV’s servable assortment. If it was, the AGV delivered the item from its docking location to the requesting OR. Otherwise, a circulating nurse manually fulfilled the request. The time required for the nurses to manually fulfil the request was assumed to follow normal distributions based on the data from time-motion studies. The time taken for the nurses to restock one AGV is approximately 150 s. The base structure of the AGV is the mobile autonomous robot for healthcare from Aethon Inc. The velocity of a running AGV is at an average of 0.5 m/s. 20
The DES model of the OR Complex was developed using the AutoMod™ simulation software (Applied Materials, Inc). Structure and behavioral-based validation tests were conducted with the participation of domain experts in an iterative approach. Dimensional consistency of the outputs and quantitative data were checked against historical data. Extreme condition testing was used to further ensure the validity of the model. These validation tests are well established and described in the literature. 24
Multiobjective efficiency evaluation via S-DEA
S-DEA models are formulated and solved to derive the relative efficiencies across alternative designs 25 with the performance metrics estimated from the validated DES model. Data Envelopment Analysis (DEA) is a non-parametric method used to assess the efficiency of decision-making units (DMUs). The DEA method computes the efficiency scores relative to an efficiency frontier which is estimated from the most efficient designs. Constant return to scale (CRS) was assumed in our methodology. CRS means that changes in inputs result in proportional changes in outputs. 26
S-DEA extends the basic CCR DEA model to enable the differentiation of efficient designs by excluding the design under evaluation from the reference set.
27
Following the definition of minimal extrapolation sets, the S-DEA model to computes the relative efficiency of the k
th
design, given input factors, 
Optimization model (1) is defined over the technology (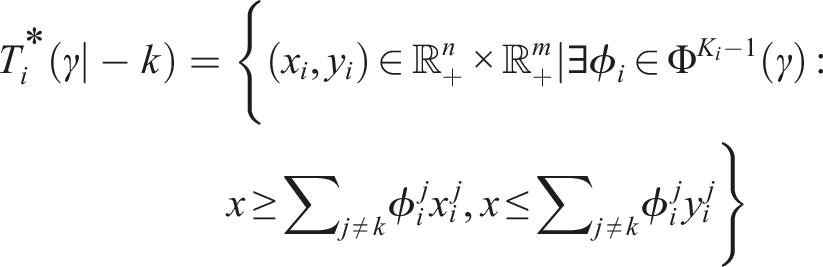
CRS is represented by the parameter γ. Model (1) is solved repeatedly for each design alternative, resulting in K i efficiency scores for each demand scenario i. In the case study, DMUs are the design alternatives. The relative efficiencies of these design alternatives are computed across four input variables: number of AGVs, restocking frequencies and cost per fulfilment; and two output variables: annual number of requests fulfilled by the AGVs, and the annual manpower-hour saved. The R Benchmarking package 27 was used to evaluate the S-DEA relative efficiencies.
Design and analysis of experiments
The DES model was run for different AGV design configurations and demand scenarios. The system design factors are: (1) assortment algorithm (basic and improved); (2) number of AGV deployed (2 and 3), and (3) restocking frequency per day (1 to 6 times). The alternative designs are evaluated across four demand scenarios: (1) baseline demand; (2) 2X baseline demand; (3) 5X baseline demand, and (4) 10X baseline demand. With the above four factors and levels for each factor, we adopted a full factorial design of experiments giving a total of 96 (2 * 2 * 6 * 4) simulation runs. This allowed for the evaluation of all main and interactions effects 10 on the relative efficiencies computed with the S-DEA model. Univariate analysis of variance (ANOVA) and non-parametric Kruskal Wallis (KW) tests were conducted across the multiple objectives and the relative efficiency scores. These tests helped identify significant differences in system performance attributable to variations in design factors and demand levels. Furthermore, multivariate analysis based on multiple linear regression (MLR) was used to evaluate both the main and interaction effects of assortment algorithm, number of AGV deployed and restocking frequency per day on the efficiency scores for all the demand scenarios. All statistical analysis were performed using R 4.0.4. 28
Post-hoc model selection
The post-hoc model selection process looked at different functional forms considering second, third and fourth order interaction effects. The adjusted R-squared for these alternative models were also evaluated to determine the extent of model improvement with higher order models. The half-normal probability plot allowed for the detection of anomalous deviations from the null hypotheses (changes in the input factors have no effect on the response).
10
Domain expertise was sought to validate the insights from this post-hoc evaluation phase prior to the detailed statistical inference of the results. In summary, the post-hoc design evaluation phase involved the following sub-tasks: 1. Identification of the relevant factors that have significant effects using the half-normal probability plot. 2. Use of automated variable section methods to derive an optimal combination of factors. 3. Evaluating the final subset of factors with domain experts through effect visualizations
Automated feature selection method based on the L1-regularization of the regression model was used to automatically identify the important effects. The Least Absolute Shrinkage and Selection Operation (LASSO) regression minimizes the following optimization problem function to automatically identify the important features:
Both the half-normal plot visualization and the L1 regularization should preferably converge to a similar subset of effects that are then validated with the domain experts. Normal probability plots and standard statistical tests (e.g., Shapiro Wilks test of normality and Levene test for the homogeneity of variance) were also used to ascertain the requisite normality assumption for the final statistical model used for deriving the key insights. Main and interaction effects plots together with other relevant graphical analysis were used to validate the analysis with domain experts from the OR support operations, clinical domain leads and the AGV design team. For this final phase, the effects plots together with the summary results were presented to the domain experts. If there were any discrepancies that significantly deviated from domain expectations, an iterative process with the re-identification of effects and the statistical assumptions were re-examined. The DES model may also be fine-tuned through the iterative process shown in Figure 1.
Results and discussion
Both AGV and manual transports of materials were jointly considered in the DES model to highlight cyber-physical considerations of this AGV system design problem. The S-DEA super-efficiency scores were computed across the various design settings. Figure 7 shows the differences in efficiency scores across different demand scenarios for different assortment policies and number of AGVs. Using boxplots with efficiency scores as the outcome variable enhanced the understanding of potential effects from a simple univariate and bivariate perspective based on a single efficiency score. Figure 7(a) shows that under all scenarios, the improved assortment can achieve higher efficiency scores. Figure 7(b) shows that the improvement in efficiency scores with more AGVs is more apparent with higher demands. When we consider both the number of AGVs and the assortment policy, relative efficiencies can significantly outperform with improved assortment and more AGVs at higher demand scenarios (see Figure 7(c)). ANOVA and KW test can be further used to evaluate the statistical significance of these effects. Boxplots of efficiency improvements across various demand scenarios for: (a) base versus improved assortment algorithm; (b) Number of AGVs; (c) interaction of assortment algorithm and number of AGVs.
The full factorial design of experiments with four factors was conducted with the following design factors: (1) Assortment algorithm (two levels); (2) number of AGV deployed (two levels); (3) Restocking frequency (six levels), and (4) Demand scenarios (four levels). A total of 96 simulation runs were evaluated. Given the full factorial design, models with the main effects, second, third and fourth order interactions can be estimated. Not all the models were suitable. Results from these models were evaluated in the “Post-hoc Design Evaluation” phase to determine the final functional form and degree of interaction effects.
The half normal probability visualization of the model with second and third order interaction effects are shown in Figure 8. All the models considered quadratic effects for restocking frequency (since restocking frequency has six levels). All the models showed that significant effects were related to higher order interactions. Further analysis revealed that the adjusted R-squared value increased from 86.5% in the model with only two factor interactions to 89.4% in the three-factor interactions model. The full model which considered four factor interactions did not yield noticeable performance improvement with respect to the adjusted R-squared and may be overfitted. The optimal tuning parameter, Half normal probability plot of ordered effects: (a) model with 2-way interactions; (b) model with 3-way interactions [Legend: assortment algorithm (AA); number of AGVs (AN); restocking frequency (R); demand (D); interaction effects of factors X and Y (X:Y)]. Log Results of the best MLR model. Note: SE: standard error; Sig: significance at p < .001 level.


Referring to Table 2, the number of AGVs was associated with the decline in relative efficiencies. However, the negative effects seen in increased demand scenarios can be better understood only when we examine the interaction effects. Interaction effects were seen to be significant across all the second order interactions except for AA: D interaction (Table 2). The interaction effects were plotted across each of the four demand scenarios. Non-parallel lines in the interaction effect plots indicated that the effect of one factor on response variable was influenced by the level of the other factor.
30
In Figure 10(a), it can be observed from the interaction effect plots that the decrease in efficiency when more AGVs were introduced can be mitigated when we have a better assortment algorithm. However, with more AGVs, a suboptimal configuration of the restocking frequency can easily result in a significant drop in the relative efficiency of the AGV system design (see Figure 10(b)). Interaction effects plots for: (a) AN:AA; (b) AN:R; (c) AN:D; (d) AA:D; (e) AA:R; (f) R:D.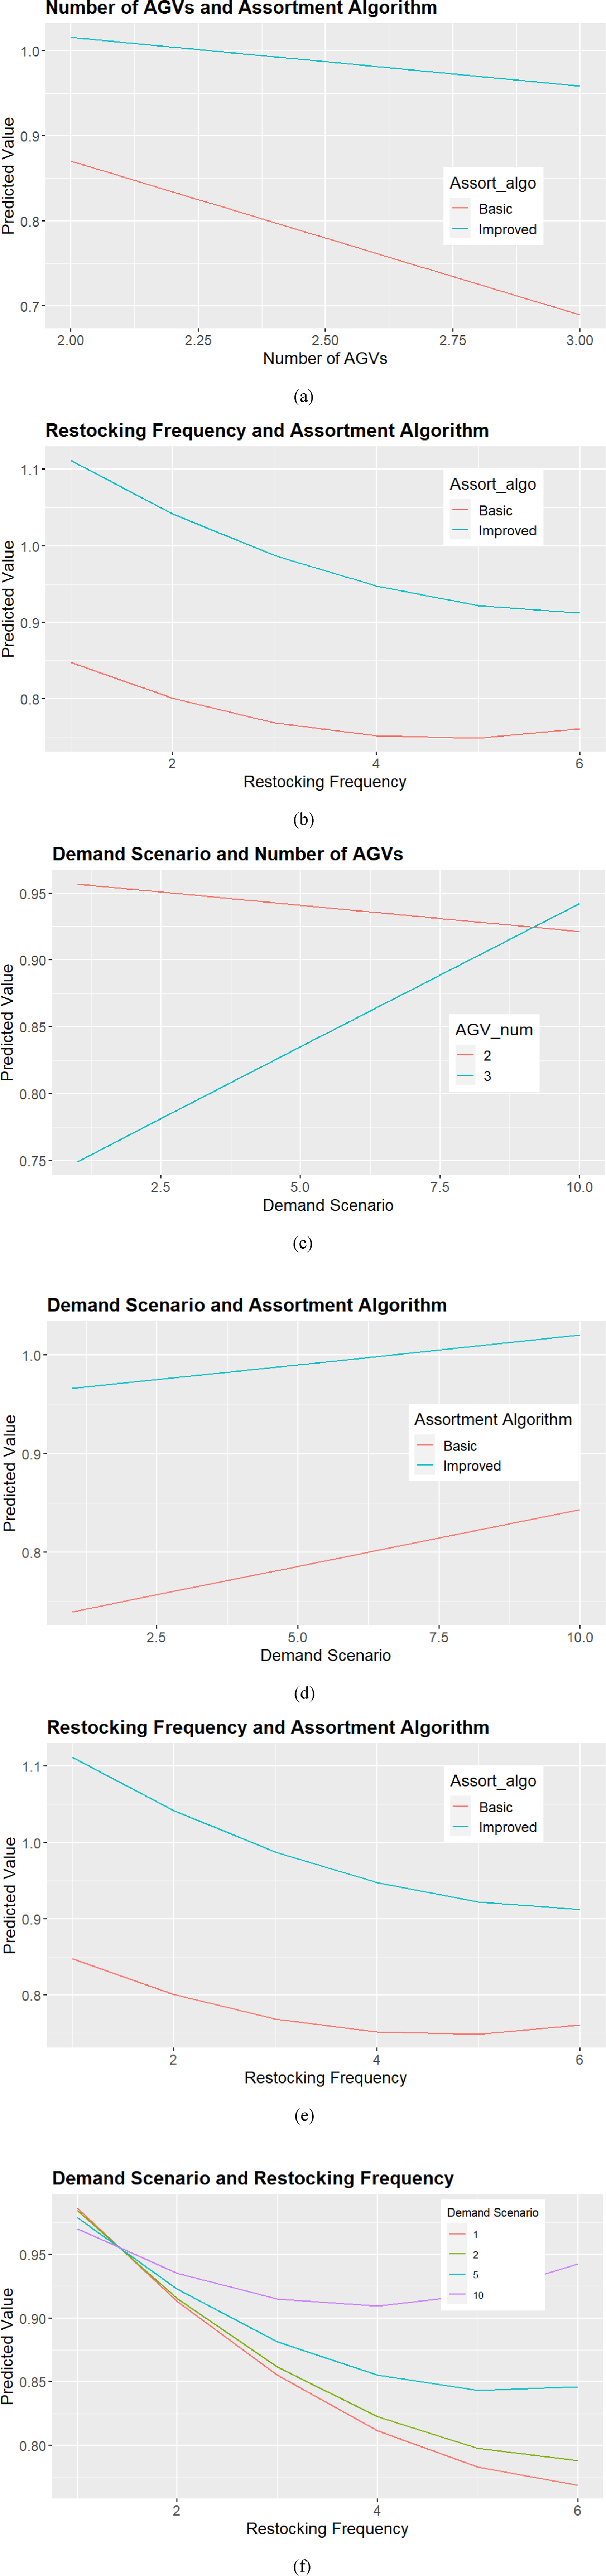
Even though the main effects of increasing demands could result in the decline in relative efficiencies (Table 2), this effect was reversed when we had a higher number of AGVs as shown in Figure 10(c). Consequently, it was not always true that the number of AGVs was negatively associated with efficiency scores seen in Table 2. Interestingly, Figure 10(d) shows the non-significance of the interactions between the assortment algorithm and demand level, but as mentioned earlier, the choice of the assortment algorithm will impact efficiency when the number of AGVs were increased. Figure 10(e) and (f) further showed that higher restocking frequencies can result in declines of relative efficiencies. However, in higher demand scenarios, the decline in efficiencies was less significant, indicating higher restocking frequencies will be useful only for higher demand levels (Figure 10(f)).
Effect analysis of the various design parameters led to the following insights in improving AGV system efficiency: 1. It was important to evaluate both the main and interactional effects of design parameters jointly to derive the correct insights for optimizing AGV system designs. 2. The importance of considering the interaction effects was highlighted across the following findings: a. The number of AGVs required can be optimally determined based on the insights derived from the framework. Effect plots played a significant role in this. b. A better assortment algorithm can reduce efficiency losses when we introduce more AGVs (Figure 10(a)). c. A suboptimal decision on the restocking frequency can result in significant efficiency losses. (Figure 10(b), (e) and (f)). 3. Design parameters, such as restocking frequency, can have non-linear effects that require more factor levels to identify the optimal configuration.
Higher demand levels may see a significant decline in relative efficiency if the system design was suboptimal. Whilst the univariate analysis confirmed the effects on efficiency improvements were more pronounced at higher demand levels, multivariate analysis through a systematic full-factorial DOE revealed that the effects were not so simple. Even just evaluating across the dimensions of assortment algorithm, AGV number and restocking frequencies revealed that significant insights can be derived from a systematic process which involved design of experiments, model selection and post-hoc design evaluation.
The ability to consider multiple design objectives can be embedded within a single design objective via a relative efficiency score derived from the S-DEA approach to generate additional insights for AGV system design. This single comprehensive efficiency score facilitated the relative comparison of efficiencies across various parameterized AGV system designs. Similar to existing simulation-based studies, 31 systematic multi-factorial experimentation facilitated the evaluation of alternative designs based on rigorous statistics and a keen understanding of the domain physics. Regardless of this lack of novelty, the proposed framework facilitated the engagement of domain experts via a case study approach. This case study further reinforced the importance of a systematic and well-documented evidence-based approach to engage system owners and AGV designers to realize the successful implementation of automated fulfillment systems. Such approaches could imbue more confidence on the final design decisions prior to the actual deployment of similar capital-intensive systems to support the delivery of health services in a public healthcare system.
The primary limitation of this study is its reliance on a case-study approach, which limits the evidence on the generalizability of the findings. Nonetheless, individual methods within the framework have been reported in a number of AGV system design literature.3,11 This evidence points to the fact that the multi-stage framework proposing the integration of these methods is sound and can be generically applicable for other AGV system design problems in a similar context. Another limitation is that the uncertainties considered in the case study did not include the potential reliability issues of AGVs, such as those related to downtimes and system maintenance within a cyber-physical system. 32 Such uncertainties can be easily implemented within the modelling framework with more data collected after the system is piloted within the actual OR workflows.
Conclusion
In this case study, we demonstrated the implementation of an integrated framework designed to evaluate various AGV system designs, considering multiple objectives across diverse demand scenarios. The use of S-DEA within this framework enabled effective differentiation among AGV system designs operating at the production frontier. This case study enriches the limited body of literature on multi-stage system design frameworks for AGV systems in large-scale OR complexes. It addresses the integration of existing manual order fulfilment processes with the AGV system. The proposed approach has been shown to be effective in facilitating stakeholder engagement throughout the system design process. Despite the limited opportunity to evaluate this methodology across multiple sites, the insights derived from this case study through the successful application of well-proven DES methodology integrated with S-DEA models, augmented with DOE and a post-hoc model selection process may still be noteworthy.
Footnotes
Acknowledgements
The study team wishes to thank Ms Ginny Chen and Duc Thinh Luu Phan for their support to this project.
Author contributions
HSSH, MEHO and SSWL had the original idea for this study. All authors contributed to the study. Data curation was done by SSWL and YG. SSWL and YG contributed to the methodology and analysis of the data. HSSH, SSWL and CWC supervised the data curation, analysis, and validation of the results. HSSH, MEHO and CWC contributed to the expert domain knowledge of the operations. SWSL and YG wrote the first draft of this paper and all the authors subsequently assisted in revising the work and have approved the final version.
Declaration of conflicting interests
The author(s) declared no potential conflicts of interest with respect to the research, authorship, and/or publication of this article.
Funding
The author(s) disclosed receipt of the following financial support for the research, authorship, and/or publication of this article: This project is funded by the Singapore Health Assistive & Robotic Programme Grant 192 22 00005.
Ethical statement
Data availability Statement
The raw data will be made available via a request to