
Abstract
Business intelligence (BI) and business process management (BPM) are widely implemented in various organizations. However, their impact on organizational performance strongly depends on their alignment. Previous research has focused mainly on large companies. Small and medium-sized enterprises (SMEs) also started to use BI and BPM in order to improve their performance. However, the research regarding this issue is scarce. The goal of the article is to examine the interrelationship of BI and BPM and their impact on organizational performance of SMEs. In order to attain this goal, a systematic literature review and a survey research on the sample of SMEs in Croatia and Slovenia have been conducted.
Keywords
Introduction
Small and medium-sized enterprises (SMEs) make a significant contribution to economic growth and to job creation in a global economy. According to Muller et al., SMEs provide about 70% of the total EU employment in the non-financial business sector. 1 Flexibility and ability of SMEs are considered a big advantage. 2 On the other hand, SMEs are vulnerable to external events and sparse internal resources. 3 In order to increase their resilience in times of crises, and increase their response time to market changes, SMEs started to use various ICT tools, such as business intelligence (BI) and business process management (BPM). Despite this, a number of studies reviewing the introduction and application of these initiatives in SMEs is low. Previous research indicates that BI and BPM systems are mainly applied in large enterprises, while BI and BPM practices in SMEs are very low. 4,5
In order to shed some light on the area of BI and BPM implementation in SMEs and their impact on organizational performance, two research goals are set. The first goal is to review the current research on the utilization of BI and BPM in SMEs. The second goal is to investigate the impact of BI, BPM and their alignment to SMEs’ organizational performance. In order to attain the first goal, we have conducted a systematic literature review of the utilization of BI and BPM in SMEs, and in order to attain the second goal, the survey research has been conducted on a sample of Croatian and Slovenian SMEs.
The structure of the article is as follows. After this introduction, a literature review is presented, aiming to meet the first research goal of the article. The literature review is going to present the methodology as well as the results, analysis and discussion parts of the reviewed literature. Next, in the third part of the article, the methodology used for the empirical part of the research is presented, including data description, research instrument overview, as well as the statistical analysis. In the fourth part of the article, the results of the empirical research in terms of descriptive statistics and cluster analysis are presented. In the fifth part of the article, the results of the study are discussed, and at the end of the article, a short conclusion with limitations and plans for future research is given.
Literature review
Literature review methodology
BI is defined as a set of applications, technologies and processes that are deployed across companies in order to support their decision-making process and to improve business performance. 6,7 BPM is recognized as a holistic management approach that enables process performance and monitoring, and facilitates process improvements, thus influencing the overall organizational performances positively. 8,9 Since the improvement of business performance is considered the common goal of both BI and BPM initiatives, some authors introduced a new term ‘process-centric BI’ arguing that BPM and BI should be linked and used together as important tools for supporting performance management. 10,11,12 Similar suggestions come from business experts. Capgemini report proposes a closed-loop approach towards BI and BPM alignment by extending BPM with the analytic mechanisms of BI, and by embedding a business model and a business process perspective into BI. 13 However, both academics and consultants agree that the alignment will not achieve its full effect if BI and BPM are perceived within the organizations as information technology (IT) tools. Instead, BI and BPM alignment should be driven by the organizational strategy, with the goal to increase their effect on organizational performance.
BI and BPM projects are mainly characterized by the high costs and risks of failure, and many studies investigate BI and BPM implementation and adoption with the aim of identifying projects’ critical success factors (CSFs). Some authors 14 –17 argue that CSFs are case-specific, affected by internal and external factors and vary over time. The readiness for BI and BPM adoption has been researched by numerous academics and business practitioners who developed numerous BI and BPM maturity models. 18,19 These models consist of multiple (usually 4–6) levels of maturity analogous to the stages of a BI or BPM life cycle. It is assumed that higher maturity provides higher value to the business. However, the usefulness of maturity models is still controversial. De Bruin and Rosemann point out that the highest level of BPM maturity does not necessarily lead to higher operational performance. 20 These issues have been mostly investigated in large enterprises, while the research in SMEs is scarce.
In order to shed some light on these issues in SMEs, we have conducted a literature review with the following goals (1) to explore how researchers identify CSFs of BPM or BI in SMEs, (2) to investigate the impact of BI or BPM maturity on organizational performance in SMEs and (3) to examine to what extent the BI and BPM alignment in SMEs has been researched in the literature.
In order to achieve these goals, a systematic literature review has been carried out in February 2019 using two databases: Scopus and Web of Science Core Collection (WoS). These databases have been selected for conducting the search process since they are widely used in various literature searches as a reliable source of peer-review articles. 21 Aghaei Chadegani et al. explain how WoS is the only citation and publication database which covers all science areas internationally, while Scopus is a good alternative since it is the largest citation and abstract database. 22 A systematic literature review was conducted in three phases: (i) literature search, (ii) selection of relevant articles and (ii) analysis of relevant articles. 23
Literature search
The articles were selected using the following criteria: (i) the articles should focus on SMEs are taken into account; (ii) the articles should be related to BI or BPM implementation, adoption or maturity models. The terms ‘implementation’ and ‘adoption’ are frequently considered synonymous in literature. However, for the purpose of this research, a distinction is made: ‘BPM implementation is seen as the introduction of BPM concepts while BPM adoption means the use and acceptance of those concepts in the organization’. 24
The time span for the reviewed research comprises the period from 2014 to 2019 in order to gain insight into the recent state of the research field. Only peer-reviewed, full-text articles written in English and published in research journals or conference proceedings were taken into account. Both databases were searched using the phrase: ‘business intelligence’ AND ‘SMEs’ and ‘business process management’ AND ‘SMEs’. This approach resulted in 122 articles: 85 articles about BI in SMEs and 37 articles about BPM in SMEs. Among them, 39 articles appeared in both databases. After they were removed, 83 articles remained.
Selection of relevant articles
In the second phase, all of the 83 abstracts were analysed and coded by two independent researchers to determine the relevance of the obtained articles for the goals of this study. The differences in coding were discussed by both researchers in order to agree on the relevance of abstracts. This procedure was conducted in two steps. Among 83 examined articles, 56 were excluded due to previously defined reasons: (i) 15 were excluded since their research was not related to BI and BPM in SMEs; (ii) 41 articles were excluded since they were not related to BI or BPM implementation, adoption or maturity models; (iii) 6 articles did not provide sufficient results in order to provide useful information for this study (mostly from conference proceedings). Therefore, 10 articles about BI and 11 articles about BPM (a total of n = 21) were selected for further discussion.
Analysis of relevant articles
Detailed analysis of the articles was conducted in order to extract the following information: publication type, research focus (BI and BPM; adoption, implementation and maturity), research type (quantitative or qualitative), study strategy (e.g. questionnaire survey, case study), sample size and country of research.
Literature review results
Table 1 presents the results for BI and BPM identified studies. The number of articles published in journals prevails (12) over the number of articles in conference proceedings (9). The analysis shows a similar proportion of qualitative (10) and quantitative researches (9), while in two cases, both approaches (qualitative and quantitative) were applied. The research strategy used in the articles includes case studies, in-depth interviews, questionnaire surveys, textual analysis and others. In qualitative research studies, the sample size varies from 1 to 200, while it ranges from 83 to 427 for quantitative research studies. Most of the studies were conducted in developed countries (11 European countries, Canada and Thailand). Only one study was conducted in 2014, while the greatest portion of research (six studies) was published in 2018. The growing number of published articles through the years indicates the increase of researchers’ interest in BPM or BI in SMEs.
BI and BPM studies.

BI: business intelligence; BPM: business process management; SME: Small and medium-sized enterprise.
A summary of the research focus and research approaches is presented in Table 2. The majority of BI studies investigate BI adoption and BI implementation, while two articles refer to BI adoption and maturity. BPM studies are mainly focused on adoption, maturity and implementation. One article investigates both implementation and maturity BPM issues, while the other discusses BPM adoption and maturity factors. The number of qualitative and quantitative studies is almost equal, while two studies used both quantitative and qualitative approaches.
Summary of research focus and research approach.

Literature review discussion
Detailed analysis of the articles is presented in Online Appendix 3. Based on this analysis, the detailed discussion is provided on (i) BI and BPM implementation and adoption in SMEs and (ii) BI and BPM maturity in the context of projects’ results and benefits.
BI and BPM implementation and adoption in SMEs
A discussion within this category refers to identification and understanding of BI and BPM implementation and adoption CSFs in SMEs. Following the recommendations of Nguyen, Meredith and Burstein as well as Rockart, the CSFs are categorized into three groups 43,44 : (1) common, (2) development and (3) use. Common CSFs are related to management support, alignment with business strategy, continuous improvement, organizational and people issues. Development CSFs comprise methods, communication, change management, project management, team skills, data quality, and data management, IT and resources capability. Use CSFs include organizational culture and readiness, governance, and key performance indicators (KPIs) measurement, perceived usefulness, information quality and security, system functionality and ease of use. An integrated list of 23 CSFs is presented in Online Appendix 4. Additionally, the main features, challenges, barriers and drivers of projects are identified.
Common CSFs
One group of authors stresses the impact of top management. According to Adeyelure et al., organizational factors (e.g. top management support, management expectations and financial resources) are the most pertinent in the implementation of mobile BI in SMEs. 28 The top management’s awareness and understanding of BPM and the strategic approach towards BPM are vital for the implementation success. 4,40 Other authors investigate the impact of organizational structure and strategy. Llave et al. identify an iterative and gradual investment strategy as the most important factor for the successful adoption of BI in SMEs. 30 On the other hand, the prevalence of functional organizational structure of SMEs negatively affects the implementation of the process-oriented approach. 39
CSFs for BI and BPM development
Although the IT implemented in SMEs should fit their needs and capabilities, low levels of data management and data quality have a negative influence on BI initiatives. 29,33 In this respect, different BI solutions are proposed, such as the automated data warehouse, mobile and cloud solutions. 30 In addition, the possibility to integrate the BI system with the present or future enterprise resource planning (ERP) is seen as an important factor of BI deployment. 31 Some authors evidenced the missing organizational support of BI and BPM. 8,31 Resource availability is one of the key factors that significantly affect BPM initiatives’ success. 6 Many SMEs do not provide sufficient staff and do not clearly establish relevant BI and BPM roles, for example, project champion and process owner. 8,31 Other authors reveal that the lack of IT support and lack of understanding can cause a failure of BI deployment in SMEs. 25,29,33 Bandara and Opsahl highlight the negative effects caused by the lack of BPM education and training. 4
CSFs for BI and BPM use
Puklavec et al. show that the BI costs and perceived relative advantage are not significant factors for BI diffusion, while organizational readiness strongly determines BI adoption. 31 The operationalization of process performance and measurement systems is very scarce in SMEs, which also affects the success of BPM initiatives in organizations. 8 Lückmann and Feldmann provide ‘insight into success factors of BPM initiatives in SMEs, summarizing and mapping 117 CSFs along 9 project management areas’. Project communication, cultural aspects and a supportive organizational culture are identified as BPM success factors. 40
Features, challenges and barriers of BI and BPM adoption
Some authors recognize that specific SMEs’ characteristics are itself a barrier to successful BI implementation. Various authors point out that family-owned companies are not aware of the importance of BI for decision-making. 29,30 However, SMEs’ need for BI implementation varies across industries, which indicates that it could be interesting to examine BI initiatives in specific industries. 6,29,30 Competitive pressure is considered a driver of BPM introduction for SMEs. 6 Giacosa et al. emphasize that SMEs family firms frequently adopt process organization, thus concluding: ‘familiness positively impacts BPM practice by taking advantage of their confidence and adaptability’. 41 Reher summarizes the barriers to BPM implementation in SMEs, emphasizing ‘the negative role of conservative behaviour, risk aversion, manager’s focus on daily activities and opportunistic information processing’. 36
BI and BPM maturity in the context of projects’ results and benefits
Our literature review revealed several research papers focused on BI and BPM maturity in SMEs. Boonsiritomachai et al. proposed BI maturity model identifying five levels of maturity in the following order: operate, consolidate, integrate, optimize and innovate. 6 These maturity levels comprise five maturity dimensions as follows: infrastructure, knowledge process, human capital, culture and applications. The results of the BI maturity model show that ‘Thai SMEs are at an early stage of BI adoption’. 6 Although the users of mobile BI recognize numerous benefits of BI systems adoption (e.g. increased efficiency, improved financial results, better cooperation between employees), less than 30% of SMEs use some form of mobile BI solutions. 25 These findings are in line with the results of a study conducted by Gauzelin and Bentz showing that despite the respondents’ awareness about the benefits of BI implementation (e.g. the increase of business process efficiency, the improvement of company performance), the majority of SMEs still have not implemented BI. 27 The results of the research conducted on Slovenian SMEs show that ‘the routine and innovative use of BI system impact internal operations, marketing, and sales, so indicating a positive and significant correlation of BI system usage with the partial impacts on SMEs performance’. 32
The results of a questionnaire survey conducted in SMEs operating in the Czech Republic demonstrate that ‘BPM is mostly applied to medium-sized enterprises, thus implying the positive correlation between the BPM maturity and the number of employees’. 34 Rolinek et al. show that it is not possible to prove the relationship between business process maturity and the financial performance of enterprises. 37 Singer combined qualitative and quantitative empirical methods to examine BPM maturity levels within SMEs and found a weak connection between BPM maturity level and organizational performance. 38 Okręglicka et al. found out that ‘(1) BPM maturity of Polish SMEs is on the average level, but the level of process maturity is the more advanced with the increase in the size of an SME; and (2) the risk management and human resources management are the areas that require the intensification of BPM efforts’. 35 Mamoghli et al. propose BPM maturity model and reveal that ‘the implementation of a sophisticated and integrated IT system does not mean that the highest maturity level is fully achieved’, yet human factors (e.g. training of employees and organizational culture) have a vital role in this achievement. 42
Methodology
This part of the article presents the research instrument used, data collected and statistical analysis approach.
Research instrument
Research instrument consists of five dimensions: (1) BPM maturity, (2) BI maturity, (3) BPM/BI alignment, (4) organizational performance assessment and (5) company characteristics (Table 3).
Research instrument.

BI: business intelligence; BPM: business process management; OP: organizational performance.
BPM maturity scale consists of the following items: (1) alignment with strategy, (2) holistic approach, (3) process awareness by management and employees, (4) portfolio of process management initiatives, (5) process improvement methodology, (6) process metrics, (7) customer focus, (8) process management, (9) information systems and (10) change management. Respondents used the scale from 1 to 5 to express their agreement with the statements. It has been developed based on the Rummler-Brache Group approach. 45
BI maturity scale has been developed based on the BI maturity model, 46 which has been reduced for the purpose of this research to the most important issues: (1) the scope of BI systems use, (2) the level of data architecture maturity, (3) the relevance of BI for the organization, (4) the level of technical architecture maturity, (5) the level of data management maturity, (6) type of BI tools used within the organization, (7) organizational structure related to BI, (8) the level of BI processes maturity, (9) the level of BI profitability assessment and (10) BI strategy. Respondents used the scale from 1 to 5 to express their agreement with the statements.
BPM/BI alignment scale is based on the previous research, 47,48 with the four statements referring to (1) coordination of BI/BPM initiatives, (2) usage of common BI/BPM terminology and communication of experts from both fields, (3) usage of BI systems for performance measurement of cross-functional processes and (4) usage of BI systems for process monitoring and control. Respondents used the scale from 1 to 5 to express their agreement with the statements.
Organizational performance scale is based on Law and Ngai research, and it consists of five statements referring to (1) level of customer satisfaction with products/services, (2) customer retention rate, (3) sales growth rate, (4) profitability of the organization and (5) competitive position of the organization. 49 As previously, respondents used the scale from 1 to 5 to express their agreement with the statements.
We also collected general information about the enterprises, such as the number of employees, turnover and the industry in which the company operates.
In order to check the reliability and internal consistency of the scales, Cronbach’s α coefficients have been calculated. Nunnally and Bernstein propose the cut-off value for the Cronbach α coefficients at 0.70 in order to confirm the reliability and internal consistency of the scale. 50 For the BPM maturity scale calculated, Cronbach α coefficient is 0.847, while for the BI maturity scale, it is 0.929. Next, the Cronbach α coefficient for the BPM/BI alignment scale is 0.909 and 0.868 for the organizational performance scale. It can be concluded that the reliability and internal consistency of the research instrument have been confirmed.
Data
We used the previously presented research instrument in order to collect the data from SMEs in Croatia and Slovenia. Data were collected from March to December 2016, as part of the PROSPER project (Process and Business Intelligence for Business Performance – IP-2014-09-3729) supported by the Croatian Science Foundation. The questionnaires have been distributed both as an online survey and in paper forms to companies operating in Croatia and Slovenia. We focused on these two countries due to their similar characteristics in terms of size and mutual history, following the approach of other authors. 51,52 Survey questionnaire has been filled in by top managers or other managers in charge of BPM and BI in their organizations. 53
Different sampling approaches were used for small and medium-sized companies. For conducting research among small companies, snowball sampling was used. 54,55 This approach is widely used for gathering data within hard-to-reach populations using qualitative research. 56 Although there is a large number of small companies in Croatia and Slovenia, not all of them use BPM and/or BI in their business. Therefore, the snowball method is adequate. For conducting research within medium-sized companies, we used two sample selection frames: (i) the Registry of business entities in Croatia and (ii) business directory bizi.si in Slovenia. Random sampling was used in order to select companies for the research sample.
The final sample consists of 107 companies, among which 87 (81.31%) are medium-sized companies and 20 (18.69%) are small companies. A relatively small number of small companies can be justified with the fact that a relatively low number of small companies are using BI and BPM and were hard to track, even with a snowball sampling approach.
Statistical analysis
The descriptive statistics for each research item were calculated for small and medium-sized companies separately. Mann–Whitney test was used in order to check the statistical significance of the differences between the research items calculated for small and medium-sized companies.
k-Means cluster analysis was conducted in order to extract the homogenous groups of companies in relation to their level of BI and BPM maturity, as well as organizational performance. k-Means cluster analysis is a statistical procedure, which divides ‘M points in N dimensions into K clusters so that the within-cluster sum of squares is minimized’. 57 Cluster analysis aims to discover an optimal and natural way of observed grouping units so that the units within one cluster have similar characteristics, while clusters differ from one another. In k-means clustering procedure, means of the clusters are being observed in iterations so that each unit is located (or relocated) into a cluster with the closest mean until there is no unit that could be moved. 58
Figure 1 presents the scree diagrams for determining the number of clusters, using the elbow method as a visual method for determining the optimal number of clusters. As it is visible from the diagrams, for both small and medium-sized companies, the appropriate number of clusters is 3 since the ‘knee’, that is, bend of the curve representing the number of clusters and related distances, is visible for three clusters.

Determining the number of clusters. Source: Authors’ work.
Results
This section of the article presents the results of the descriptive analysis as well as the results of the cluster analysis performed on the collected data.
Descriptive analysis
Table 4 presents the overview of the mean values of the research items for the two observed groups and the results of the Mann–Whitney test. The results for small and medium-sized companies are similar, and the differences between research items among them are not statistically significant, with the exception of BPM7, which is statistically significant at a 10% level. The results indicate that most of the observed variables are not statistically different among small and medium-sized companies, which indicates that there are no inherent differences between these two groups according to BPM maturity, BI maturity, BPM/BI alignment and organizational performance. Since the goal of our research is to compare if the relationships among these variables are different among small and medium-sized companies, the fact that they are not statistically different allows us the comparison of the relationships using cluster analysis.
Mean values of research items.a

Source: Authors’ work.
BI: business intelligence; BPM: business process management; OP: organizational performance.
a Mann–Whitney test results.
* Statistically significant at 10%.
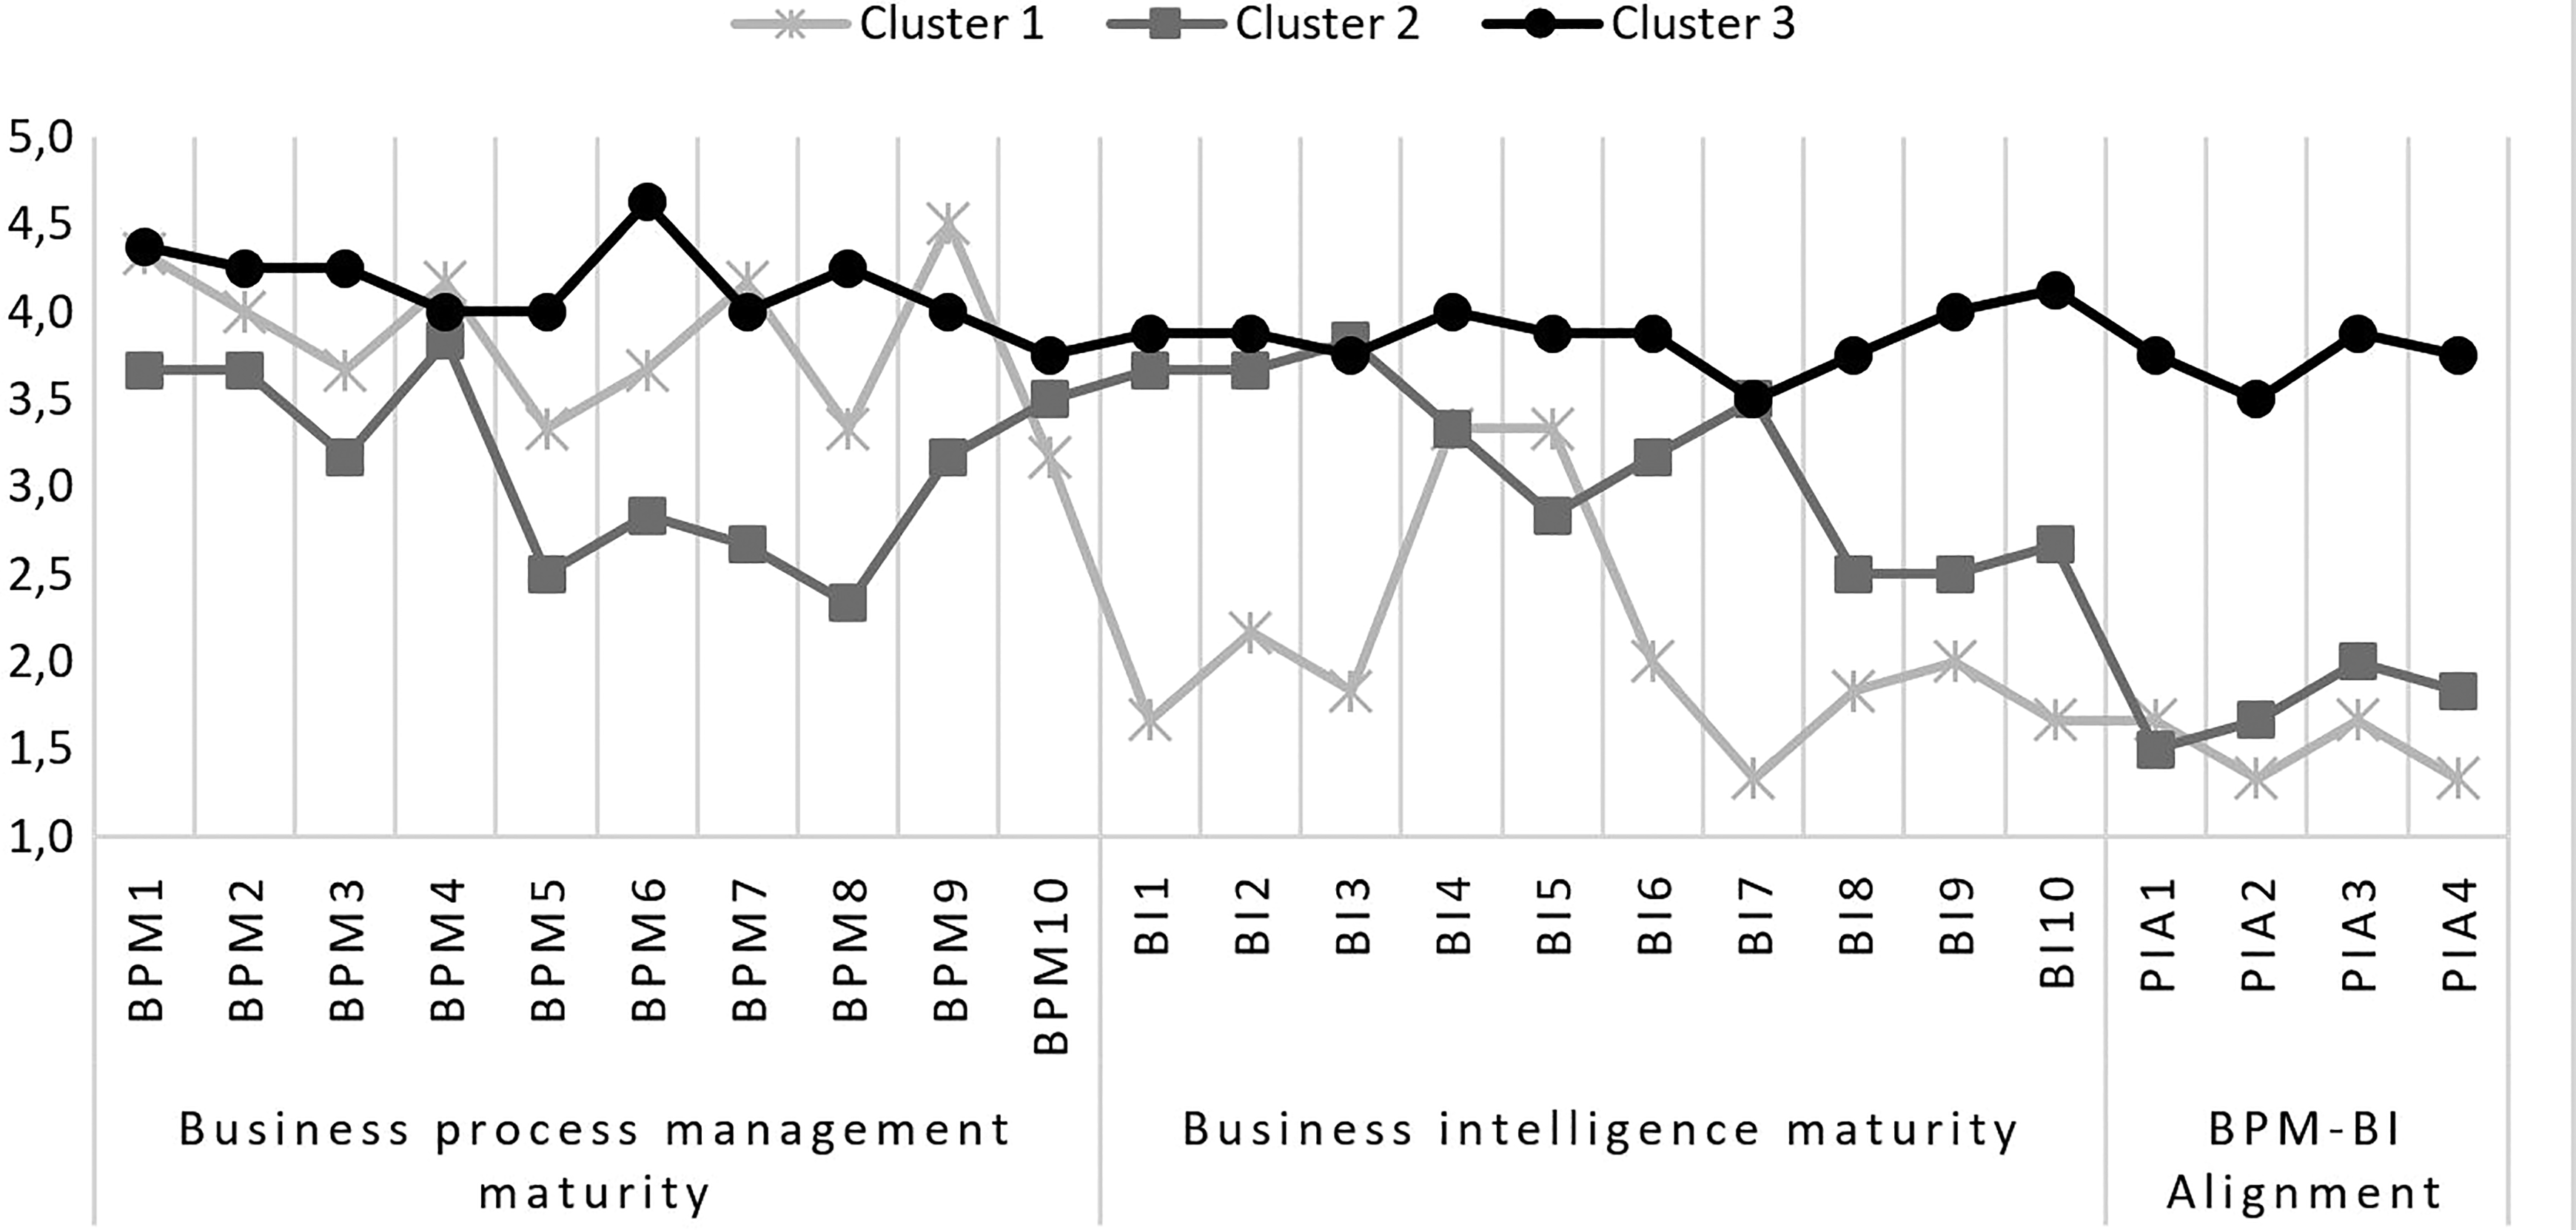
Figure 2 graphically presents the calculated means of the companies with less than 50 employees and the companies with 50–249 employees. Overall, the medium-sized companies performed better for most of the research items in BPM maturity, BI maturity and BPM/BI alignment groups of research items. The exceptions are visible with the BPM6, BPM9, BI4 and BI9 indicators, which are the means of following measures: the level of process metrics development and usage, the level to which information systems are based on processes rather than on business functions, the level of technical architecture maturity of BI and the level of the profitability assessment of BI, respectively. When it comes to organizational performance, the small companies had higher means for all research items.

Mean values of research items. Source: Authors’ work.
Cluster analysis
The cluster analysis was conducted separately for small and medium-sized companies.
Cluster analysis for small companies
Table 5 presents the mean values of research items for three clusters in small companies. Results of analysis of variance (ANOVA) are also presented. Cluster 3 comprises 40% of small companies, while clusters 1 and 2 both comprise 30% of small companies. ANOVA indicates that for some of the research items, the differences between clusters are not statistically significant for all items. Items BPM3, BPM5, BPM6, BPM7, BPM8 and BPM9 are statistically different among clusters, and items BI1, BI2, BI3, BI6, BI7, BI8 and BI9 are also statistically different among clusters. This indicates that these items related to BPM maturity are mostly related to the BI maturity and BI/BPM alignment in small companies.
Mean values of research items across clusters in small companies.a

Source: Authors’ work.
BI: business intelligence; BPM: business process management; OP: organizational performance; ANOVA: analysis of variance.
a ANOVA across clusters.
* Statistically significant at 10%.
** Statistically significant at 5%.
*** Statistically significant at 1%.
Figure 3 graphically presents the mean values for small companies across clusters. Companies from cluster 3 have the highest value of indicators for almost all research items, while the lowest results have been recorded within companies from cluster 1, comprising 30% of the observed small companies. BPM/BI alignment is present in those companies in which both BPM and BI maturity are at higher levels. On the other hand, if one of those two concepts is not used within a company in a way that improves its maturity, the alignment between them is low.
Mean values across clusters for small companies. Source: Authors’ work.
Cluster analysis for medium-sized companies
Table 6 presents the mean values of research items across clusters in medium-sized organizations with 50–249 employees, as well as the results of the ANOVA across three observed clusters. Cluster 1 is comprised of 41% of companies, cluster 2 of 30% and cluster 3 of 29% of companies.
Mean values of research items across clusters in medium-sized companies.a

Source: Authors’ work.
BI: business intelligence; BPM: business process management; OP: organizational performance; ANOVA: analysis of variance.
a ANOVA across clusters.
* Statistically significant at 10%.
** Statistically significant at 5%.
*** Statistically significant at 1%.
Most of the differences between the research items are statistically significant, with only a few exceptions. This indicates that all of the research items have a significant impact on the relationship between BPM maturity, BI maturity, BI/BPM alignment and organizational performance in medium-sized companies.
Figure 4 presents the mean values of research items across clusters in medium-sized companies. Medium-sized companies aggregated in cluster 3 performed better for all research items compared to the other two clusters. Cluster 1 is the one with most dispersed mean results across research items as well as the lowest mean results compared to the other two clusters. Moreover, like in the sample of small companies, it could be noticed that there is a strong relationship between BPM/BI alignment and the maturity of BPM and BI. If one of the two maturities is lower, then the overall BPM/BI alignment results tend to be lower.

Mean values across clusters for organizations with 50–249 employees. Source: Authors’ work.
Relationship between BPM, BI, BPM/BI alignment and organizational performance
Table 7 presents the results of the mean values of organizational performance items across the clusters in small and medium-sized companies, as well as the results of the Kruskal–Wallis test.
Cluster mean values of organizations according to size and organizational performance.a

Source: Authors’ work
OP: organizational performance.
a Kruskal–Wallis test results.
* Statistically significant at 10%.
** Statistically significant at 5%.
*** Statistically significant at 1%.
Most of the research items measuring organizational performance have similar values for small companies. The only statistically significant difference between clusters for small companies was noticed at the 10% level for the OP1 research item, which is representing customers’ belief that they are receiving value for their money when buying products or using services of an observed company.
However, research items measuring organizational performance are significantly different in medium-sized companies. Kruskal–Wallis test results have revealed statistically significant difference at the 5% level for the OP2 research item, referring to the customer retention rate, and statistically significant differences at the 1% level for OP3, OP4, OP5 and OP_AVG research items. Those research items are referring to the sales growth rate, profitability, comparative position and the average organizational performance result of the observed company.
Figure 5 presents the mean values of individual research items of organizational performance, as well as the average result of the organizational performance with regard to the company size. Mean values of organizational performance items of cluster 3 for both medium-sized and small companies are the highest, compared to the other two observed clusters. This research result indicates that those companies that have the most mature BI and BPM systems, which are at the same time the most aligned, have the highest chance to attain the above-average organizational performance.
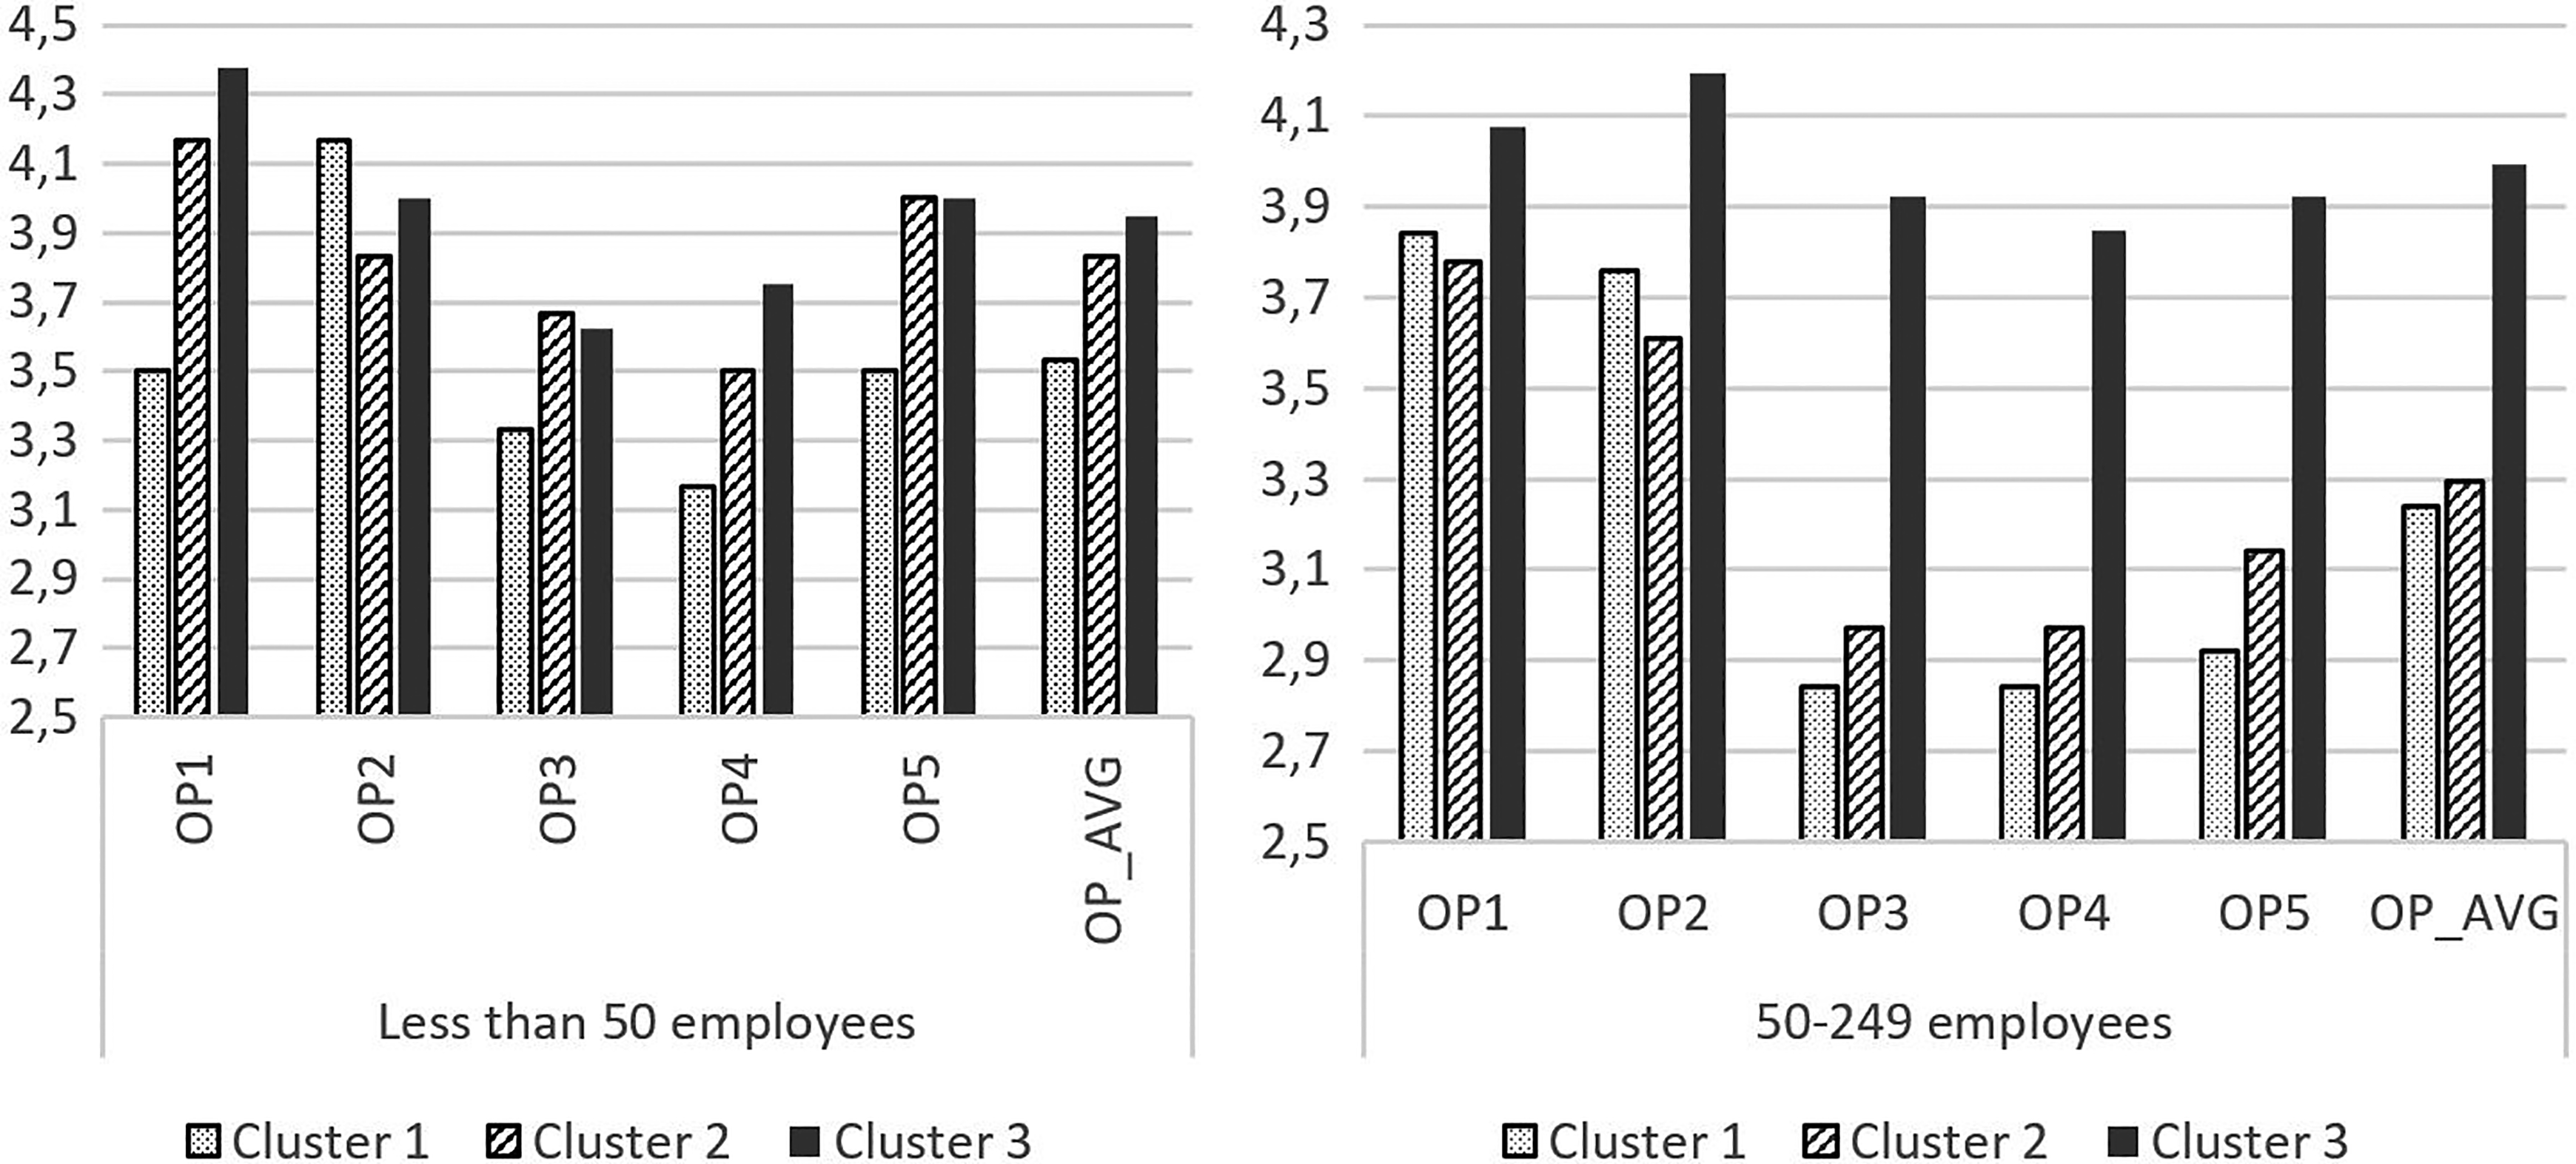
Mean values of organizational performance indicators across clusters and organizational size. Source: Authors’ work.
Our results reveal that higher levels of BI and BPM maturity empower SMEs to achieve higher performance. In addition, SMEs with the higher levels of both BI and BPM maturity also have a higher BI and BPM alignment, which in turn has a positive impact on organizational performance.
Discussion
The aims of this work are (i) to provide the systematic literature review on BI and BPM research in SMEs, and (ii) to present empirical evidence on BI and BPM maturity within the SMEs in Croatia and Slovenia, as well as their influence on the organizational performance of SMEs.
The results of our literature review highlighted the key issues of BI and BPM implementation and adoption as discussed by researchers
5,12,15,59
–61
over the last 5 years, such as: A relatively small number of articles discusses BI and BPM initiatives in SMEs. Thus a gap in the evaluation of BPM adoption in SMEs is present. BI and BPM practices in SMEs are rather scarce, and the majority of enterprises reside in the lowest level of BI and BPM maturity. The results of research regarding the relationship between BPM maturity impacts and organizational performance are inconsistent. While some papers indicate a positive effect of BI and BPM usage on SME performance, the others did not find evidence of such influence. Besides, several articles emphasize a positive correlation between BI and BPM maturity and non-financial performance. Although BI and BPM CSFs do not differ significantly with regard to the size of the organization, some differences have been found. BI and BPM are often perceived as initiatives appropriate only for large organizations due to the lack of top management’s awareness of the importance of BPM and BI initiatives and limited human and financial resources in SMEs. Several authors set up the guidelines for SMEs to overcome the obstacles associated with the introduction of BI and BPM. Still, SMEs are still slow in the implementation of BI and BPM, indicating a lack of knowledge and skills and/or a lack of motivation and resources. The papers focused on BI or BPM separately, and we did not find evidence of previous research about BI and BPM alignment as a driver of SMEs business performance.
According to the results of the empirical analysis, the level of BI and BPM maturity is quite low for about two-thirds of both small and medium-sized companies. These findings are in line with the results of other studies identifying a low level of BI and BPM maturity in SMEs and emphasizing a positive correlation between the maturity level and the number of employees. 4 –6,8,34,37 The results of empirical research studies show that BPM initiatives are of interest to large organizations, with a large number of processes. 62 On the other hand, many authors point out that the modern manufacturing and service companies should consider both BI (e.g. data analytics and big data mining) and BPM (e.g. business optimization, business process monitoring, process performance analysis) to gain business benefits. 63 –66 Although SMEs have recognized innovation capability and performance measurement to be the essential success factors for their business, there are many barriers preventing the implementation of modern management concepts, such as BI and BPM, in their business practices. 67 The long-neglected issue of human resources, poor knowledge of competitors and customers, and the lack of process KPIs and process capability indices are becoming the critical factors for further efficient SMEs development. 67,68
Clusters were compared according to the average level of organizational performance. The comparison revealed that companies that are members of clusters with higher BI and BPM maturity and higher BPM/BI also scored higher in the indicators of organizational performance. This result confirms the importance of BI and BPM alignment as leverage for attaining the full effects of BI and BPM on the overall organizational performances. 10,12 The results of previous research are partially in line with our findings. While Singer confirmed a weak statistical connection between the level of BPM maturity and organizational performance, Popovič et al. found a positive and significant partial impact of BI system usage on SMEs performance. 32,38 On the other hand, Rolinek et al. did not prove the correlation between the level of BPM maturity and the financial performance of the organization. 37 However, our results revealed that organizational performance is better if the level of BI and BMP maturity is higher, which is especially evident in small companies. For medium-sized companies, it has been noticed that companies in a cluster with the highest level of BPM/BI alignment also have a higher organizational performance. These findings are in line with the results of various studies, showing that BI and BPM effect customer satisfaction, improve customer support, increase sales and competitive advantage. 9,12,25,27,32 Some authors indicate that the implementation of social BPM technologies, process mining, online analytical processing (OLAP)-based intelligent systems and data mining could help enterprises to gain efficient collaboration throughout the whole supply chain and to manage customer experience. 69 –72
Conclusion
This research contributes to the BPM and BI literature on the interaction effect of these concepts on organizational performance. Our article had two main goals: (1) to present the results of an extensive systematic literature review related to BI and BPM within SMEs, and (2) to present the results of an empirical study of the level of BI and BPM maturity as well as their alignment within SMEs, with regard to the organizational performance.
First, we presented the results of a systematic literature review. In terms of methodology, most of the studies were case studies, followed by questionnaires and interviews. Moreover, there has been an increase in papers published through the years, which can be considered as evidence of a growing interest among researchers for the topic of BI and/or BPM within SMEs.
Second, we presented the results of the survey research conducted in Croatian and Slovenian companies, which revealed that only one-third of Croatian and Slovenian SMEs have a high level of BPM and BI maturity. An analysis of the relationship between BI maturity, BPM maturity, BPM/BI alignment and organizational performance indicates that higher levels of BI and BPM maturity enable SMEs to achieve higher performance. The higher levels of both BI and BPM maturity also result in stronger BI and BPM alignment, which again positively influences organizational performance. It can be concluded that BI and BPM should be aligned and used together as important tools for supporting performance management within SMEs.
In terms of the article’s practical contributions, the results of the empirical study reveal the need for higher levels of both BI and BPM maturity. Moreover, it can be concluded that BPM/BI alignment can help SME companies to achieve better organizational performance results.
Several limitations should be taken into account when evaluating the results of our research. First, we did not include white papers, professional papers and technical reports in our literature review. Second, we conducted empirical research in two countries (Slovenia and Croatia), on a relatively small sample, based on a cross-sectional approach. Finally, we used a self-reported measurement of organizational performance. Therefore, using a longitudinal approach while researching a larger sample of companies from various countries, would likely shed some more light on the controversial impact of organizational performance of BI and BPM in SMEs. In addition, additional sources of information regarding operational performance should be used, such as profitability and other financial indicators from official financial reports.
Supplemental material
Appendix - BPM and BI in SMEs: The role of BPM/BI alignment in organizational performance
Appendix for BPM and BI in SMEs: The role of BPM/BI alignment in organizational performance by Mirjana Pejić Bach, Vesna Bosilj Vukšić, Dalia Suša Vugec and Ana-Marija Stjepić in International Journal of Engineering Business Management
Footnotes
Declaration of conflicting interests
The author(s) declared no potential conflicts of interest with respect to the research, authorship, and/or publication of this article.
Funding
The author(s) disclosed receipt of the following financial support for the research, authorship and/or publication of this article: This research has been fully funded by the Croatian Science Foundation under the project PROSPER – Process and Business Intelligence for Business Excellence (IP-2014-09-3729).
Supplemental material
Supplemental material for this article is available online.
References
Supplementary Material
Please find the following supplemental material available below.
For Open Access articles published under a Creative Commons License, all supplemental material carries the same license as the article it is associated with.
For non-Open Access articles published, all supplemental material carries a non-exclusive license, and permission requests for re-use of supplemental material or any part of supplemental material shall be sent directly to the copyright owner as specified in the copyright notice associated with the article.