
Abstract
Historical narratives encode how people today perceive, understand, and reconstruct past realities. One basic form focuses on historical trajectories and encodes perceived changes. Here, we show that perceived changes in economic inequality are predicted by its objective changes over time, while both diverge from shifts in public attention to economic inequality. Using the Fill-Mask Association Test (FMAT), a new social computing paradigm, we quantified public perceptions of changes in economic inequality from 1800 to 2019, as represented semantically in large contemporary English-language texts. Perceived changes are consistent with how economic inequality has actually changed in the long history, which was replicated using various time series analysis methods (e.g., cross-correlation, vector autoregression, Granger causality test). In contrast, public attention to economic inequality, as measured by word frequency in Google Books, did not fluctuate in line with either objective or perceived changes. Our findings demarcate the objective–subjective relationships of economic inequality from a historical-psychological perspective. Objective changes are accurately perceived and encoded in natural language texts, forming a collective memory of economic inequality in history.
Keywords
Introduction
Economic inequality is a growing problem globally both as an objective phenomenon and a subjective construction, manifested in static situations and dynamic evolution. Recent scientific work highlights how objective and subjective inequality are intertwined (Willis et al., 2022) and how inequality has evolved throughout a long history (Alfani, 2024; Alvaredo et al., 2017; Piketty & Saez, 2014; Saez & Zucman, 2016). From a historical-psychological perspective, our research aims to quantify the subjective perceptions of objective changes in economic inequality. More importantly, by testing the relationships among objective changes, perceived changes, and attentional shifts in economic inequality, we seek to elaborate on how public perceptions of inequality diverge from public attention to inequality but can align with objective inequality over time.
Economic Inequality: From Objective to Subjective
Economic inequality refers to an unequal distribution of valuable resources—income or wealth—in a society. It is often measured objectively by the Gini coefficient (how income or wealth deviates from a perfectly equal distribution) or the share (%) of total income earned or wealth held by the richest population. Objective economic inequality is associated with both mental and social illness (Wilkinson & Pickett, 2017; Willis et al., 2022). For example, people living in more economically unequal societies tend to have worse physical and mental health (Pickett & Wilkinson, 2015) and experience lower subjective well-being (Du, 2024; Du et al., 2024); societies with higher economic inequality tend to produce more social problems like crime (Wilkinson & Pickett, 2009) and manifest lower civic honesty (Du et al., 2021).
However, subjective economic inequality is key to understanding the psychosocial effects of objective economic inequality (Willis et al., 2022). Subjective inequality consists of different components that we term attention, perception, and evaluation in a social-cognitive hierarchical framework (Table 1). At the bottom level, public attention refers to merely being interested in or concerned about inequality, and it can be measured by frequency of using or searching related terms (Peters & Jetten, 2023; Sánchez-Rodríguez & Moreno-Bella, 2022; Waldfogel et al., 2021). Stronger attention to inequality does not mean perceiving a higher degree of inequality. Perceived inequality—the degree of inequality that people think exists—is the core component of subjective inequality (Du & King, 2022; Willis et al., 2022), hence the focus of the current research. Moreover, a higher-level component is the evaluation of inequality, such as judging inequality as either fair or unfair (Schmalor & Heine, 2022). Taken together, subjective inequality is a mixed construct, but its core component is the perceived degree of inequality, which is distinct from the simpler component of attention to inequality and the more complex component of evaluations about it.
A Social-Cognitive Hierarchical Framework for Understanding Subjective Economic Inequality.

Note. Perception (i.e., perceived degree of economic inequality) is the core component (Willis et al., 2022).
From a cross-sectional perspective, objective inequality is more or less related to the different components of subjective inequality. For attention, people living in more unequal regions are also more interested in economic inequality—more frequently searching its terms on Google and talking about it on Twitter (Sánchez-Rodríguez & Moreno-Bella, 2022). For perception, laypeople may misperceive the degrees of objective inequality in their country (Du & King, 2022; Gimpelson & Treisman, 2018; Hauser & Norton, 2017). For evaluation, people living in more unequal countries tend to tolerate (i.e., accept or legitimize) inequality (Schröder, 2017), and people who legitimize inequality may perceive lower inequality years later (Du & King, 2022). In sum, the relationships between objective and subjective economic inequality are mixed.
A Historical-Psychological Perspective on Economic Inequality
Economic inequality is never static. Its historical dynamics are of growing interest to scholars in economics, politics, and psychology. From a historical-psychological perspective (Atari & Henrich, 2023; Muthukrishna et al., 2021), it remains largely unclear how objective and subjective inequality are related and intertwined over a long history. Objective data show that inequality has not followed a simple linear rise: global economic inequality declined from the early twentieth century until the late twentieth century, before increasing again after the 1980s (Alfani, 2024; Alvaredo et al., 2017; Piketty & Saez, 2014; Saez & Zucman, 2016; United Nations, 2020). Meanwhile, public attention to inequality has steadily risen over recent years, as reflected by the increasing frequency of terms about inequality (e.g., rich, poor, economic inequality, and income inequality) in books, media posts, and academic articles (Peters & Jetten, 2023; Peters et al., 2022).
These trends leave a deeper research question: Do people's perceptions of changes in inequality mirror historical reality, or do they simply echo the rising attention to this issue? Direct evidence for this question is scarce. A 2013 survey across 22 countries, for example, showed that citizens often misperceived how inequality had changed in their country during 2007∼2012 (Gimpelson & Treisman, 2018). However, this study tested how ordinary people could correctly identify the direction of short-term change simply by asking them: “Do you think the gap between the rich and the poor in (survey country) has increased, decreased, or stayed the same in the last five years?” Our study aims to better address the above research question, from a historical-psychological perspective, by testing a much longer history and utilizing more ecologically valid methods of social computing and time series analysis.
The Present Study
Distinct from past studies that measured perceived inequality at the individual level, we conceptualize public perceived changes in economic inequality at the societal level. These perceived social changes can be semantically derived from historical narratives—social representations and shared beliefs of history, involving various forms of perceptions and evaluations of history, among which a fundamental form is the narrative of historical trajectories (Freel & Bilali, 2022; Liu & László, 2007).
First, by leveraging a new social computing paradigm with pretrained language models, we aim to quantify such public perceived changes in economic inequality over 220 years (1800∼2019) in Western societies. In particular, we would adopt a new method that can measure propositions in natural language—the Fill-Mask Association Test (FMAT; Bao, 2024; Bao & Gries, 2024, 2025), with 12 BERT models that have been pretrained on large contemporary English-language text corpora, to quantify people's retrospective propositional perceptions of how unequal the economy, income, and wealth was in different years. 1
Then, using a set of time series analysis methods, we aim to test how accurately these perceived changes in inequality can echo historical reality (i.e., objective changes over time), compared with public attention shifts (i.e., changes in word frequencies of inequality-related terms over time). We did not preregister this study, but we made all data and analysis code openly available at Open Science Framework https://osf.io/mz7b4.
Method
Our central research question is how perceived changes in economic inequality are related to objective changes and public attention shifts. To address this question, we measured economic inequality from three aspects. First, we employed the FMAT method to quantify how people today perceive the varying degrees of economic inequality in different years (i.e., perceived changes). Second, we collected objective indices to gauge how economic inequality has actually changed over time. Third, we used word frequencies to indicate shifts in public attention to economic inequality over time. Finally, and more importantly, we adopted multiple methods of time series analysis to test their long-term dynamic relationships and time-lagged predictions.
Perceived Changes in Economic Inequality (Measured by the FMAT)
We used the FMAT to quantify the public's perceived changes in economic inequality. The FMAT employs BERT models to compute semantic probabilities of words filling in the masked blank of a designed query (a cloze-like “fill in the blank” sentence). We used the same sample of the 12 most representative BERT models as used in previous FMAT research (Bao, 2024; Bao & Gries, 2024, 2025): BERT (base/large, uncased/cased), ALBERT (v1/v2), DistilBERT (uncased/cased), RoBERTa, DistilRoBERTa, BERTweet (base/large). All BERT models are openly available from HuggingFace (https://huggingface.co/models). 2 Prior analysis suggests that these BERT models can represent English speakers identified as American, British, Canadian, and Australian people (Bao, 2024; Bao & Gries, 2025).
FMAT queries such as “Most {TARGET} {ATTRIB} Query 1: “The {TARGET} Query 2: “The {TARGET} Query 3: “ Query 4: “
These query templates contain placeholders for both a target phrase {TARGET} and an attribute phrase {ATTRIB}. First, the {TARGET} and {ATTRIB} of each query sentence were replaced with phrases depicting a situation of economic inequality, producing final queries for the fill-mask workflow. Second, BERT models were used to estimate the semantic probabilities of year tokens from 1800 to 2019 filling in the [MASK] of each query sentence.
To tap into the concept of economic inequality, we referred to nearly all scale items that have been used to measure perceived economic inequality (Du et al., 2022; Du & King, 2022; Heiserman & Simpson, 2021; Lembregts & Pandelaere, 2014; Sánchez-Rodríguez et al., 2019; Schmalor & Heine, 2022). Adapting the scale items, we finally designed 144 unique (72 pairs of) FMAT queries, comprising 4 query templates × 3 query types (basic, distribution, gap) × 2 attribute phrases (high vs. low inequality) × 3 target types (economy/economic, income, wealth) × 2 target phrasing variations (see Table 2).
Query Design for the Fill-Mask Association Test.

Note. Four general and parallel query templates were used. Q1: “The {TARGET} in [MASK] {ATTRIB}.” Q2: “The {TARGET} in the year [MASK] {ATTRIB}.” Q3: “In [MASK], the {TARGET} {ATTRIB}.” Q4: “In the year [MASK], the {TARGET} {ATTRIB}.” For each query sentence, the {TARGET} and {ATTRIB} were first replaced with the phrases shown in this table; then, BERT models were used to estimate the semantic probabilities of year tokens from 1800 to 2019 filling in the [MASK].
…among the rich, the middle class, and the poor
…between the rich and the poor
We used R programming language (R Core Team, 2024) and the open-source R package “FMAT” (Bao, 2023) for data analysis: (1) produce full queries from templates and mask option words, using the FMAT_query() function; (2) run BERT models to estimate the semantic probability of each fill-mask year word, using the FMAT_run() function; and (3) compute the log probability ratio (LPR) between each pair of attributes (high vs. low inequality), for each {TARGET} phrase and [MASK] year word, to measure the relative semantic association, using the summary.fmat() function.
Finally, the data for analysis had N = 190,080 observations, which comprised LPR estimates from combinations of 220 fill-mask years, 72 query pairs, and 12 BERT models. Each LPR value, therefore, indicates how strong the semantic relation (contextual binding) was between a year marker and a statement of economic inequality in the pretraining corpora of a BERT model. A zero value of LPR indicates an equal semantic association of a year with economic inequality and economic equality.
Objective Changes in Economic Inequality Over Time
We accessed the full dataset from the World Inequality Database (WID), a large open database offering various indices of objective economic inequality (https://wid.world/data/). Compared to other inequality databases, the WID provides more extensive data available on the historical evolution of income and wealth inequality for most countries around the world (Alfani, 2024; World Inequality Lab, 2024). Since we focused on English language in this study, we selected the four major Anglophone countries (i.e., the United States [US], Great Britain [GB], Canada [CA], and Australia [AU]), corresponding to the possible nationalities of text producers underlying the BERT models we used (see Bao, 2024; Bao & Gries, 2025).
By scrutinizing the WID dataset, we found three indices with sufficient continuous time series for the Anglophone countries. We describe below the key information of these indices. Technical details can be found in the WID guidelines (World Inequality Lab, 2024).
Gini Coefficient of Income
The Gini coefficient of pre-tax national income (= pre-tax labor income + pre-tax capital income) among the population of equal-split adults (i.e., resources are split equally within couples; adults over age 20). A coefficient of zero means perfect equality between individuals. A coefficient of one means maximal inequality, where only one person owns all the income. Its variable name is “gptincj992” in the WID, with data available for all the Anglophone countries: US (1913∼2023), GB (1980∼2023), CA (1920∼2023), and AU (1910∼2023).
Top 10% Share of Income
The share of pre-tax national income by the top 10% population of equal-split adults. Its variable name is “sptincj992” in the WID, with data available for all the Anglophone countries (1820, 1850, 1880, 1900, 1910∼2019).
Top 10% Share of Wealth
The share of net personal wealth (= personal financial assets + personal non-financial assets – personal debt) by the top 10% population of individual adults (i.e., assuming no sharing of resources within couples; adults over age 20). Its variable name is “shweali992” in the WID, with data available for the US (1913∼2014) and GB (1895∼2012) but not for the other two Anglophone countries.
Public Attention Shifts Regarding Economic Inequality Over Time
We used word frequency in large historical text corpora to measure public attention to economic inequality over time. Higher word frequency about a concept reflects higher public attention it receives. Specifically, we used the R package “ngramr” (Carmody, 2023) to retrieve word frequencies in English-language books over time, with data originally from the Google Books Ngram Database v3 (https://books.google.com/ngrams). Google Ngram has been widely used to study changes in public attention to a topic, concept, event, person, or cultural value by testing frequency shifts in (1-gram) words or (n-gram) phrases over time (e.g., Michel et al., 2011; Peters & Jetten, 2023; Varnum & Grossmann, 2017).
We retrieved data on frequencies of six pairs of 2-gram phrases indicating economic inequality (vs. equality): “economic inequality” vs. “economic equality”; “income inequality” vs. “income equality”; “wealth inequality” vs. “wealth equality”; “unequal economy” vs. “equal economy”; “unequal income” vs. “equal income”; and “unequal wealth” vs. “equal wealth” (cf. Peters & Jetten, 2023). To match the FMAT data, we restricted the years of the Google Ngram frequency data to 1800∼2019 as well. To get more inclusive data, we specified a case-insensitive search so that uppercase and lowercase phrases were aggregated. We kept the raw frequencies without smoothing.
Analytic Strategy
We conducted time series analyses to test how objective changes, perceived changes, and public attention shifts in economic inequality have influenced each other.
First, focusing on perceived changes, we tested (1) how reliable the FMAT method and BERT models were in estimating the LPR of each year token, (2) how the FMAT-measured perceived changes in economic inequality were over years, and (3) how convergent such perceived changes were across query types and target types. Following prior FMAT research (Bao, 2024; Bao & Gries, 2024, 2025), we fitted a Linear Mixed Model (LMM) with the R package “nlme” (Pinheiro & Bates, 2023) to address the nested data structure where LPRs (Level 1) were nested within BERT models (Level 2), while including year, target types, query types, query templates, and all their interactions as the predictors of LPR.
Second, we aggregated LPRs for each year to illustrate an overall perceived trajectory, comparing it with objective changes and public attention shifts. We used linear regression models, controlling for the year trend, to test whether and how each index predicted LPRs.
Third, to test more rigorously their cross-temporal relationships, we used cross-lagged correlation, vector autoregression, Granger causality test, and impulse-response analysis (Box-Steffensmeier et al., 2014; Granger, 1969; Pfaff, 2008; Sims, 1980). These methods together can identify the direction and magnitude of long-term dynamic relationships and time-lagged predictions among objective changes, perceived changes, and attentional shifts.
Results
FMAT Reliability Analysis
Before the main analyses, we estimated how reliable the FMAT method and BERT models were by computing: (1) an average-score intraclass correlation coefficient (ICCaverage) to assess the interrater agreement among the 12 BERT models in understanding query sentences and estimating semantic probabilities (of the years 1800∼2019); and (2) Cronbach's α to assess the internal consistency of LPRs for the four query templates (αquery), three query types (αtype), and three target types (αtarget) (Bao, 2024; Bao & Gries, 2024, 2025).
The FMAT showed high interrater agreement among BERT models (ICCaverage = .91). The internal consistency was also good among the four parallel query templates (αquery = .77), among the three query types (basic, distribution, gap) of economic inequality (αtype = .70), and among the three target types (economy/economic, income, wealth) of inequality (αtarget = .88). In addition, the nine time series of LPRs aggregated by query types and target types (3×3) showed high correlations between each other (rs = .67∼.99, ps < .001, median r = .86), suggesting LPRs were convergent across phrasings. Accordingly, it would be unnecessary to distinguish between different BERT models, FMAT queries, and inequality target types when interpreting the main results.
Trends Over Time
The FMAT revealed that economic inequality was perceived higher in earlier decades than in later years from 1800 until 2019, with a brief rise after the 1990s (Figure 1). The LMM (R2marginal = .07) showed a main effect that LPRs significantly varied over years, F(1, 189,997) = 3,865.16, p < .001, η2p = .02. While year also had statistically significant interactions with all other factors (Fs = 6.10∼154.73, ps < .001), each interaction explained only a trivial proportion of variance (η2p < .0024). Indeed, the overall trend was consistent for different target types (economic inequality: byear/100 = –.094, SE = .003, p < .001, 95% CI [–.101, –.087]; income inequality: byear/100 = –.139, SE = .003, p < .001, 95% CI [–.146, –.133]; wealth inequality: byear/100 = –.129, SE = .003, p < .001, 95% CI [–.135, –.122]). These results suggest that people perceived the economy, income, and wealth to be more equal in modern times. Nonetheless, Figure 1 also shows a brief transition after the late 1990s, suggesting that the degree of economic inequality was perceived greater in the more recent two or three decades.

Perceived changes in economic inequality, measured by the Fill-Mask Association Test (FMAT). The log probability ratio (LPR) refers to the relative semantic probability of a year token (1800∼2019) filling in the masked blank [MASK] of an FMAT query sentence narrating economic inequality (e.g., “The income in [MASK] was unequal.”) vs. economic equality (e.g., “The income in [MASK] was equal.”). The black path shows the aggregated results across query and target types. The grey line shows the locally estimated scatterplot smoothing (LOESS) fitting results based on raw data points.
Then, we demonstrate long-term changes in objective economic inequality (Figure 2), including the Gini coefficient of income (Panel A), top 10% income share (Panel B), and top 10% wealth share (Panel C). As can be seen from these plots, objective economic inequality declined largely before the 1980s and then began to rise after the 1980s. In contrast, public attention to economic inequality, as measured by word frequency in books, has been steadily increasing ever since the 1930s (Figure 3).

Changes in objective indices of economic inequality over time—(A) Gini coefficient of income (1910∼2023), (B) top 10% share of income (1820∼2023), and (C) top 10% share of wealth (1895∼2014)—of English-speaking countries (United States, Great Britain, Canada, and Australia) with data available from the World Inequality Database. Black thicker paths show the average pattern of changes across countries.

Changes in public attention to economic inequality over time (1800∼2019), measured by word frequencies of 2-gram phrases in all English-language books from the Google Books Ngram Database.
Given these overall trends, we conducted a preliminary analysis, using ordinary linear regression, to test whether perceived changes in economic inequality measured by the FMAT (Figure 1) could be explained by objective changes (Figure 2) and/or public attention shifts (Figure 3). Importantly, we controlled for year in all models to account for a common time trend and therefore obtain their partial regression coefficients. As a result, higher objective economic inequality, but not greater public attention it received, could robustly predict higher economic inequality in perceived historical trajectories (bs = .238∼.268, ps = .002∼.011; see Models 1–3 in Table 3).
Linear Models Predicting Perceived Changes in Economic Inequality Measured by the Fill-Mask Association Test.

Note. Unstandardized regression coefficients are displayed, with standard errors in parentheses. Objective indices of economic inequality (with values in bold) include Gini of income, top 10% of income, and top 10% share of wealth. Public attention to economic inequality is indicated by frequency of phrases in books.
* p< .05. **p < .01. ***p < .001.
Vector Autoregression (VAR) and Granger Causality Test
The results above provide preliminary evidence that perceived changes align with objective changes in economic inequality but differ from public attention shifts. Nonetheless, the methods above could only test a concurrent relationship. To test time-lagged relationships and control for autoregressive effects, we used a more advanced econometric method: vector autoregression (VAR). A VAR(p) model is a system of k regression equations on p lags of k variables of time series, where each equation treats one time series variable as the outcome while the time-lagged variables (from 1 to p lags) of all series as predictors. It assumes that all series are endogenous variables that may influence each other (Box-Steffensmeier et al., 2014; Sims, 1980). In this study, we treated perceived changes (
In the VAR(p) model, b, c, tr, and e refer to slopes, intercepts, trends, and residuals, respectively. We standardized all variables for better interpretation of results, so we no longer included the intercepts. But we kept the trend term in each equation to control for any linear trend. The Akaike Information Criterion (AIC) and Final Prediction Error (FPE) suggested either 1 or 2 lags as the most appropriate lag order for VAR models with either Gini, income share, or wealth share as the objective index. Thus, we considered both choices but focused on VAR(1) models to ease the interpretation of slopes. We used the VAR() function from the R package “vars” (Pfaff, 2008) to fit VAR models and granger_causality() from the R package “bruceR” (Bao, 2021) to perform Granger causality test based on VAR models.
The results of VAR(1) models are presented in Table 4. Since we standardized all variables, the regression coefficients were also standardized estimates (β). Only the lags of objective indices of economic inequality could positively predict perceived changes in economic inequality (βGini = .232, SE = .058, p < .001; βShare−Income = .259, SE = .060, p < .001; βShare−Wealth = .402, SE = .085, p < .001), while the reverse-direction effects of lagged FMAT on objective indices were not significant (ps > .37; Table 4). In addition, objective changes were largely independent of public attention shifts measured by word frequency, with little lagged effects in either direction (Table 4).
Vector Autoregression (VAR) Models of Multivariate Time Series of Economic Inequality.

Note. Regression coefficients of standardized time series are displayed, with standard errors in parentheses. FMAT = perceived changes in economic inequality measured by the Fill-Mask Association Test. Obj. = objective indices of economic inequality in the World Inequality Database, which refers to Gini (income), top 10% share (income), and top 10% share (wealth) in Models 1, 2, and 3, respectively. Freq. = word frequencies of economic inequality in the Google Books Ngram Database. Values in italics are autoregressive coefficients. Values in bold highlight that objective changes in inequality positively and robustly predict perceived changes in inequality, with a 1-year lag.
*p < .05. **p < .01. ***p < .001.
The time-lagged effects of objective changes on perceived changes in economic inequality were further corroborated by Granger causality test (Table 5). The Granger causality test examines whether the past of a time series X helps to predict another time series Y over and above the prediction only by the past of Y (Granger, 1969). It is a basic method of causal direction inference in multivariate VAR models, particularly useful for testing VAR models with two or more lags, where multiple slopes of a predictor may not be easily interpreted as in VAR(1) models. By comparing two models with and without the lag(s) of a predictor, it uses the F test to determine the joint statistical significance. Our results again demonstrated the robustness of the Granger causal effects of objective inequality changes on FMAT-measured perceived changes, which held in both VAR(1) and VAR(2) model settings (Fs > 5.66, ps < .005; Table 5). In contrast, objective inequality changes did not influence public attention shifts measured by word frequency (Table 5).
Granger Causality Test (Multivariate) Based on Vector Autoregression (VAR) Models.

Note. FMAT = perceived changes in economic inequality measured by the Fill-Mask Association Test. Obj. = objective changes in economic inequality in the World Inequality Database, which refers to Gini (income), top 10% share (income), and top 10% share (wealth) in Models 1, 2, and 3, respectively. Freq. = word frequency shifts in economic inequality in the Google Books Ngram Database. Granger causality F test values in bold highlight that objective changes in inequality can Granger-cause perceived changes in inequality (but not vice versa).
*p < .05. **p < .01. ***p < .001.
Furthermore, we used cross-lagged correlations to illustrate how objective inequality dynamics preceded FMAT-measured perceived changes in economic inequality at different lags of years. As shown in Figure 4, significant cross-correlations at negative lags indicate that Gini and share indices preceded perceived changes in inequality, but not vice versa. 3
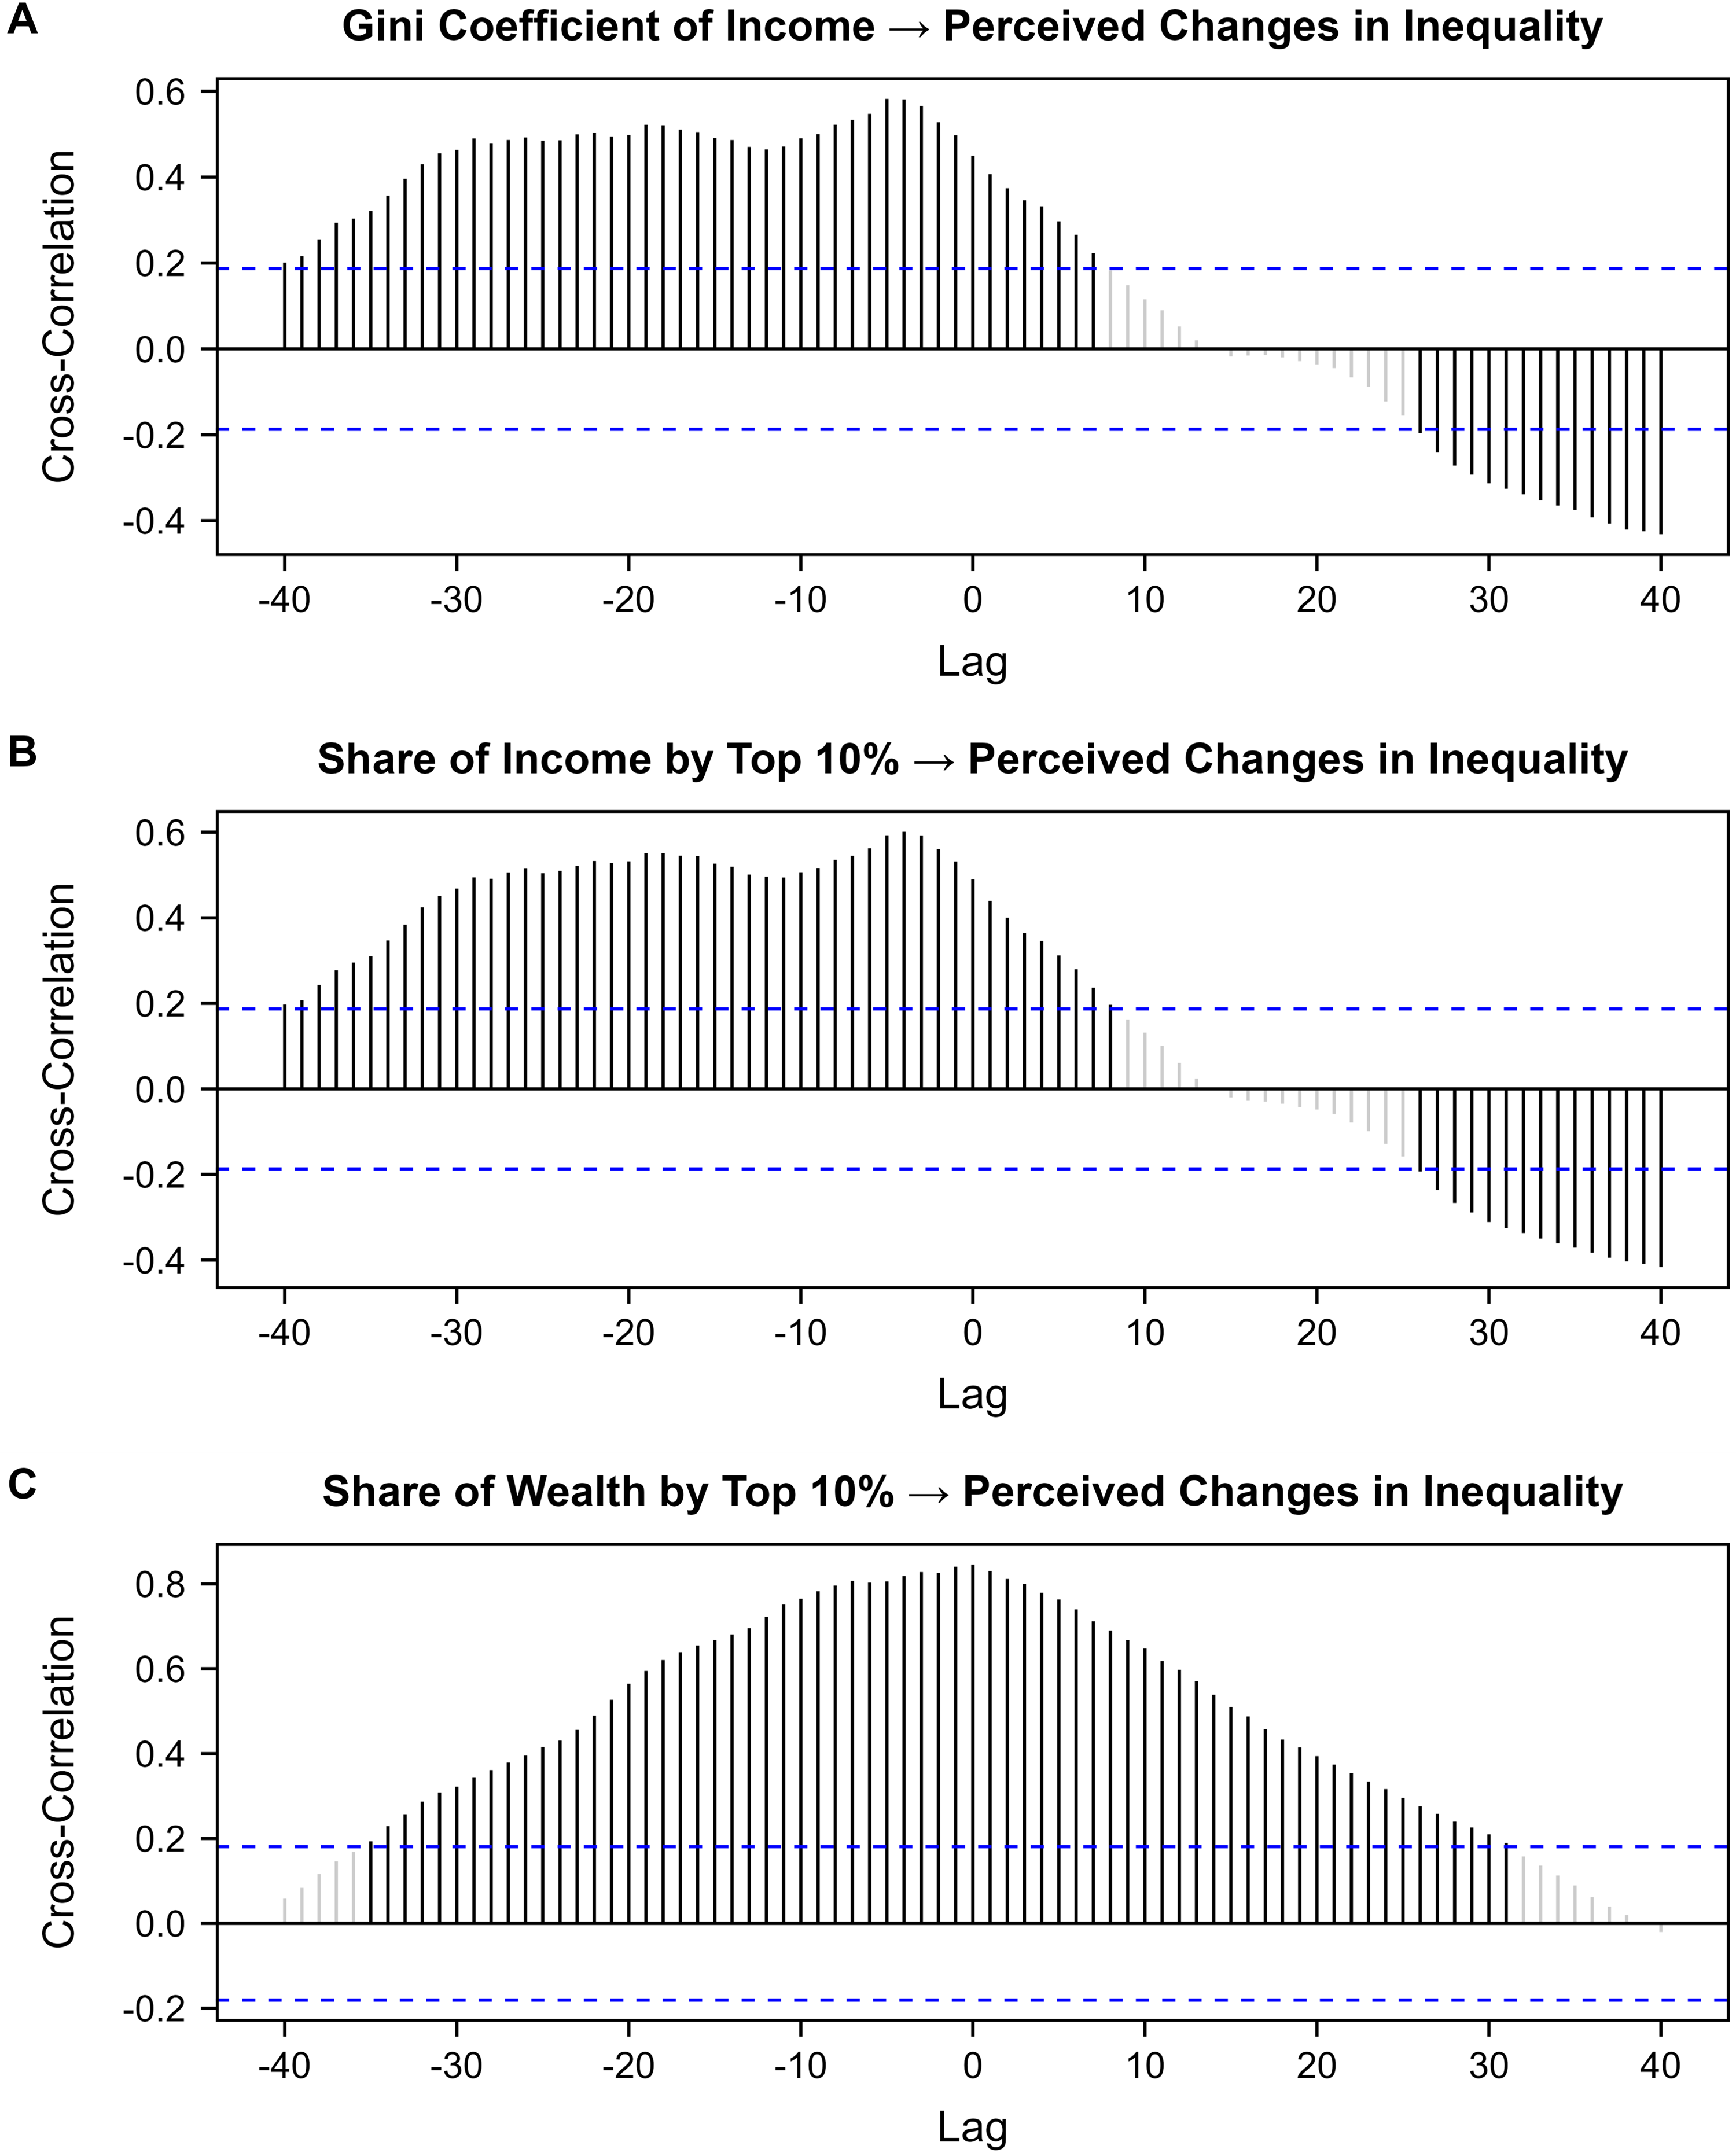
Cross-lagged correlations between objective changes in economic inequality (A: Gini coefficient of income; B: top 10% share of income; C: top 10% share of wealth) and perceived changes in economic inequality. Significant correlations (outside the blue dashed band) at negative time lags indicate the expected direction of relationship as described in each plot title.
Discussion
Using the new FMAT method with BERT models pretrained on large contemporary English-language texts, we quantified how the Western public today perceives the changes in economic inequality over the past 220 years. Derived from the texts binding a propositional statement of economic inequality (vs. equality) to a specific year, the degrees of economic inequality are generally perceived as declining between 1800 and 2019 yet with an emerging rise since the 1990s. More importantly, these public perceptions of changes in economic inequality align with how objective economic inequality has actually changed over time. Divergent from this pattern, public attention to economic inequality has been continuously growing, particularly since the 1930s. From a historical-psychological perspective, objective changes in inequality predict subjective perceptions of changes in inequality, but both of them are dissociated from changes in public attention to inequality.
Theoretical and Methodological Implications
Our findings, for the first time, discern the long-term dynamic relationships between objective and subjective economic inequality. Within the concept of subjective inequality, we differentiate between public attention and public perception, finding that they are dissociated from each other. More importantly, perceived changes in inequality, but not public attention shifts, are consistent with and predicted by objective changes in inequality. These findings provide a historical-psychological perspective (Atari et al., 2025) that not only clarifies how objective and subjective inequality can be convergent (Sánchez-Rodríguez & Moreno-Bella, 2022) or divergent (Du & King, 2022; Gimpelson & Treisman, 2018; Hauser & Norton, 2017) but also illustrates that public attention and public perception are distinct components of subjective inequality. Indeed, at the individual level, attention to inequality cues is only one step of psychological processes of forming inequality perceptions, while how people understand and transform the information is also crucial for the perception of economic inequality (Phillips et al., 2026).
Our interpretations of the main findings are threefold. First, the convergence between objective changes and perceived changes is theoretically meaningful, both supporting the “narrative theory of history” (Liu & László, 2007) and linking the study of economic inequality to the literature on collective memory (Hirst & Manier, 2008; Wertsch & Roediger, 2008). Regarding history, this key finding empirically illustrates how historical narratives can accurately reflect historical reality (McCullagh, 1987, 2000; Topolski, 1981). Putting the past into text, historical narratives can be either specific narratives recounting discrete historical events or general narratives approximating historical trajectories over time (Freel & Bilali, 2022). We tested the latter, which can also be termed “lay histories” (or lay perceptions of history) that encode social representations of history (or socially shared beliefs about history) at the collective level, with the society as the repository of narratives (Liu & László, 2007). Such historical narratives of trajectories over time can be characterized as “temporal structures that relate occurrences linked together thematically through time” (Liu & László, 2007). Our study substantiates this argument by designing and testing FMAT queries with a semantically temporal structure that binds a thematic statement (e.g., “economic inequality was high”) to a series of years (1800∼2019).
Beyond history, this key finding can extend to another concept in both sociology and psychology: collective memory. In particular, our findings suggest an empirical association between objective historical changes and collective memory, understood here as public/social representations of the past regarding economic inequality. This association suggests that collective memory is at least partly grounded in historical change, contributing to a socially maintained reality of history (Hirst & Manier, 2008; Wertsch & Roediger, 2008).
Second, the paradoxical divergence between attentional shifts and objective changes is plausible with psychological explanations. People living in countries with higher income inequality are paradoxically more tolerant of and less concerned about inequality (Mijs, 2021; Schröder, 2017). On a deeper level, system justification motivation—the motivation to justify the status quo and favor the existing social arrangements—can explain why people tend to legitimize inequality in their society (Trump, 2017). In line with this explanation, we observe that objective changes and attentional shifts in economic inequality have quite different, and sometimes even opposite, patterns over a long history. Nevertheless, alternative explanations are still possible, such as that social scientists paid little attention to inequality until the last two decades, when related studies began to emerge rapidly (Peters & Jetten, 2023).
Third, the paradoxical divergence between attentional shifts and perceived changes can be explained by the agenda-setting theory (McCombs & Shaw, 1972). Public attention to economic inequality (word frequency) maps onto the constructed importance of inequality on the public agenda, a process largely associated with academic and political discourse. In contrast, the accurate perception of historical changes as measured by the FMAT taps into historical narratives, which function as a cultural filter, preserving the long-term structural realities of the past while remaining separated from the volatile, short-term attention by the mass media agenda. While attention to inequality is necessary for the formation of inequality perceptions, people's comprehension and motivated processing of the inequality cues are also crucial for the final perceptions of inequality (Phillips et al., 2026).
In addition to these theoretical implications, our findings also clarify what the FMAT method can decode through retrospective queries. Social change research has long adopted word-counting and word-embedding approaches to detect values and associations in texts of specific years or decades. Their basic assumption is that texts of a year can represent exactly thoughts of that year. However, this assumption may lose its validity if year-specific texts mix narratives depicting concurrent and historical events. Neither word frequencies nor word embeddings can disentangle concurrent narratives from historical narratives. By contrast, the FMAT can measure propositions in natural language, allowing us to determine different types of narratives more accurately by designing queries with more specific relational information (Bao, 2024; Bao & Gries, 2024, 2025; Wang et al., 2025). Historical narratives can therefore be quantified via the contextual semantic relations (binding) between a statement and a year. In this way, the FMAT is promising to be used in future research on historical narratives and collective memory, benefiting both psychology and sociology.
Limitations and Future Directions
Our study also leaves some unresolved open questions that warrant future research. First, while we found fairly accurate perceptions of social changes from the case of economic inequality, misperceptions are nevertheless worth testing because they can influence policy preferences, such as legitimacy to undesirable policies (Gimpelson & Treisman, 2018; Hauser & Norton, 2017; Mastroianni & Dana, 2022). Since perceptions and evaluations of economic inequality are crucial for understanding how and when objective inequality influences psychological processes and individual outcomes (Willis et al., 2022), future studies can more fully explore both accurate perceptions and misperceptions, as well as how to correct misperceptions. By incorporating people's perceptions and evaluations into the inequality issue, we may finally better reduce objective inequality.
Second, we designed several FMAT queries with direct terms of economic inequality prevalent today (see Table 2). However, inequality can take many forms and have various linguistic representations over history (such as “earnings, capital, property, wages, livestock, slavery, allocation, and concentration, among many other terms prevalent in the 19th and 20th centuries”). 4 While our query design aims to provide an unbiased retrospective measure of perceived changes from the texts people today write about history (Bao, 2024), future work is needed to capture historical events narrated using those terms more prevalent in the history. Moreover, exploring shifts in the usage of terms about inequality would also be meaningful.
Third, we focused on the objective–subjective symmetry of economic inequality, but future research can test both antecedents and consequences of perceived historical changes in economic inequality, such as unfairness judgment and inequality legitimation (Du & King, 2022). In particular, the historical-psychological perspective needs to be further incorporated into economic inequality research, using more extensive historical data and multivariate time series analysis to test long-term dynamics, both in English and in many other languages (Bao et al., 2024; Box-Steffensmeier et al., 2014; Varnum & Grossmann, 2017).
Finally, the social-cognitive hierarchical framework we proposed in Table 1 integrates recent views of subjective economic inequality (Peters & Jetten, 2023; Phillips et al., 2026; Schmalor & Heine, 2022; Willis et al., 2022). We expect future work to revisit this model, applying it to other “subjective” constructs by distinguishing between attention, perception, and evaluation (an “APE” model of subjectivity).
Concluding Remarks
From a historical-psychological perspective (Atari et al., 2025), our findings reveal long-term dynamics of economic inequality, demarcating how it has changed objectively, how these changes are perceived retrospectively, and how public attention to it has fluctuated quite differently. Objective changes in economic inequality are accurately perceived and semantically stored in historical narratives, diverging from public attention shifts over time. Policymakers can take this conclusion into account, ensuring that interventions move beyond public attention and toward public perception in order to reduce inequality in the real world.
Footnotes
Acknowledgments
The authors thank Jie Hu and Cong Wei for their feedback on preliminary findings.
Ethical Approval Statements
Ethical approval was not required because this study collected publicly available data from open databases. This article does not contain any studies with human or animal participants.
Author Contributions
Han Wu Shuang Bao played a lead role in conceptualization, investigation, data curation, methodology, formal analysis, visualization, funding acquisition, project administration, writing–original draft, and writing–review and editing. Liwei Ma played a supporting role in investigation, data curation, visualization, and writing–review and editing. Zixi Wang played a supporting role in conceptualization, visualization, and writing–review and editing.
Funding
This work was supported by Shanghai Pujiang Programme (24PJC025) and Shanghai Chenguang Programme (24CGA28).
Declaration of Conflicting Interests
The authors declared no potential conflicts of interest with respect to the research, authorship, and/or publication of this article.