
Abstract
Background:
Body composition is increasingly recognized as an important modulator of chronic inflammation. However, the association between body composition parameters and disease activity in axial spondyloarthritis (axSpA) remains to be clearly established.
Objectives:
We aimed to investigate the association between muscle, subcutaneous fat composition assessed via computed tomography (CT) imaging, and disease activity in patients with axSpA.
Design:
This is a retrospective data registry observational study.
Methods:
This study analyzed 215 patients with axSpA. Body composition parameters were measured from pelvic CT scans. Parameters included the total adipose tissue volume to total skeletal muscle volume ratio (TATV/TSMV), a single-slice subcutaneous adipose tissue to skeletal muscle area ratio (SAT/SM), and skeletal muscle (SM) radiodensity. Disease activity was evaluated using the Ankylosing Spondylitis Disease Activity Score (ASDAS). Associations were analyzed using multivariate linear regression and restricted cubic splines (RCS). The probability of achieving major improvement (MI, ΔASDAS 2.0) was compared using Kaplan–Meier analysis.
Results:
After adjusting for age, sex, and disease duration, a higher TATV/TSMV ratio, rather than the single-slice SAT/SM ratio, was independently associated with increased ASDAS-C-reactive protein (β = 0.722, 95% confidence interval (CI): 0.215–1.231, p = 0.004). SM radiodensity showed an inverse, nonsignificant association (p = 0.48). RCS analysis identified a threshold effect of the TATV/TSMV ratio on disease activity at 0.65 (nonlinear p = 0.045). Above this threshold, a higher ratio was significantly associated with elevated ASDAS-CRP (hazard ratio (HR) = 3.64, 95% CI: 1.13–11.71, p = 0.029). Patients with a ratio <0.65 had a significantly higher probability of achieving MI (HR = 1.64, 95% CI: 1.04–2.59, log-rank p = 0.04).
Conclusion:
The pelvic TATV/TSMV ratio is an independent imaging biomarker associated with higher disease activity and lower odds of clinical improvement in patients with axSpA. A cut-off value of 0.65 may be a promising tool for risk stratification in clinical practice.
Plain language summary
Axial spondyloarthritis (axSpA) is a chronic inflammatory disease primarily affecting the spine. The balance of fat and muscle in the body (body composition) may influence chronic inflammation, but its specific link to disease severity in axSpA was unclear. This study investigated whether body composition measured from routine pelvic computed tomography (CT) scans relates to disease activity in axSpA. We analyzed data from 215 patients, calculating pelvic fatto-muscle ratios and muscle density from CT images. Disease activity was assessed using the standard Ankylosing Spondylitis Disease Activity Score (ASDAS-CRP). After adjusting for age, sex, and disease duration, a higher ratio of total fat volume to total muscle volume was independently linked to worse disease activity, while other measures were not significant. We identified a key threshold: a ratio of 0.65. Patients with a ratio above 0.65 had significantly higher disease activity and a lower probability of major clinical improvement. Conversely, those below this threshold had a better chance of improvement. In summary, the pelvic fat-to-muscle volume ratio is a practical imaging biomarker. A ratio above 0.65 predicts higher disease activity and a poorer outlook in axSpA. This finding could help doctors identify high-risk patients earlier for more personalized management.
Keywords
Introduction
Axial spondyloarthritis (axSpA) is a chronic inflammatory disease primarily affecting the sacroiliac joints and spine, leading to pain, stiffness, and structural damage. 1 Disease activity is generally quantified by the Ankylosing Spondylitis Disease Activity Score (ASDAS), which incorporates C-reactive protein (CRP) or erythrocyte sedimentation rate (ESR). 2 Growing evidence suggests that body composition plays a modulatory role in chronic inflammatory arthritis.3–7 High body mass index (BMI) or obesity is associated not only with high disease activity6–8 but also with a poorer response to treatment with biologic disease-modifying anti-rheumatic drugs (bDMARDs) in patients with rheumatoid arthritis (RA),9,10 psoriatic arthritis (PsA),11,12 or axSpA.13,14 High BMI may represent a biomechanical factor that can be considered as a trigger of the inflammatory process that influences the pathogenesis of new bone formation in axSpA.15,16 Mechanically, the adipose tissue is known to release pro-inflammatory cytokines.17–19 However, a major drawback of BMI is its inability to distinguish fat from lean body mass, 20 it has been shown that BMI has a good specificity, but low sensitivity in identifying excessive adiposity. 21
The pelvis is a core anatomical region in axSpA, frequently involved in both inflammation and structural damage in the sacroiliac joint. However, the associations between pelvic muscle, subcutaneous fat composition, and disease activity in axSpA are not well-established. Our study aimed to comprehensively evaluate the association between muscle and subcutaneous fat composition, skeletal muscle (SM) radiodensity, and disease activity in axSpA.
Methods
Study design and population
This retrospective data registry observational study was conducted at the Department of Rheumatology, Shanghai Jiao Tong University Affiliated Sixth People’s Hospital, Shanghai, China, based on an ongoing axSpA registry initiated by our department.22,23 Patients with axSpA were enrolled between September 2019 and December 2023. Eligibility required a clinical diagnosis of axSpA made by a rheumatologist. All patients must fulfill the 1984 modified New York classification criteria 24 or the Assessment of SpondyloArthritis International Society (ASAS) classification criteria for axSpA. 25 Exclusion criteria were as follows: (1) absence of baseline ASDAS data, and/or (2) absence of baseline pelvic computed tomography (CT) examinations. The reporting of this study conforms to the Strengthening the Reporting of Observational Studies in Epidemiology statement. 26
Data collection
Baseline demographic and clinical data, including age, gender, disease duration, and medication, were retrospectively collected. Data on CRP (mg/L) and ESR (mm/h), together with the ASDAS, were retrospectively collected from the time of registry enrollment and subsequent clinical follow-up visits. Pelvic CT examinations were performed on the same day as registry enrollment. For patients with two or more follow-up visits, the ASDAS recorded at the last visit was used to calculate major improvement (MI), defined as a decrease in ASDAS (ΔASDAS) of ⩾2.0. 2
Ethical approval
This study was approved by the Ethical Committee of Shanghai Jiao Tong University Affiliated Sixth People’s Hospital (IRB, 2025-KY-005(K)), Shanghai, China. The informed consent was waived because of the retrospective nature of the study and the fact that the anonymous datasets were used.
CT-derived body composition analysis
Pelvic CT images of all enrolled patients were obtained and anonymized. The scanning parameters were as follows: scanning plane, transverse; slice thickness, 5 mm; slice interval, 5 mm; resolution, 512 × 512. All pelvic CT images were preprocessed to retain only the slices from the fifth lumbar vertebra (L5)–the first sacral foramen (S1) intervertebral disc level to the superior acetabular rim. A radiologist (X.-Y.S., 5 years of experience), blinded to the clinical data, performed semi‑automatic segmentation of SM and subcutaneous adipose tissue (SAT) on the preprocessed images using ITK‑SNAP (version 3.8.0). The segmentation results were subsequently reviewed and confirmed by a senior radiologist (X.-E.W., 12 years of experience) and used as the final labels for measurement. On six slices at the pelvic level within the L5–S1 intervertebral disc to the superior acetabular rim range, the cross-sectional areas (mm2) of SAT and SM were measured (Figure 1). The SAT/SM ratio was calculated for each slice. SM radiodensity was obtained by averaging the CT values (Hounsfield units) of single-slice SM radiodensity across these slices. The total adipose tissue volume (TATV, mm3), total skeletal muscle volume (TSMV, mm3), and TATV/TSMV ratio were then calculated.
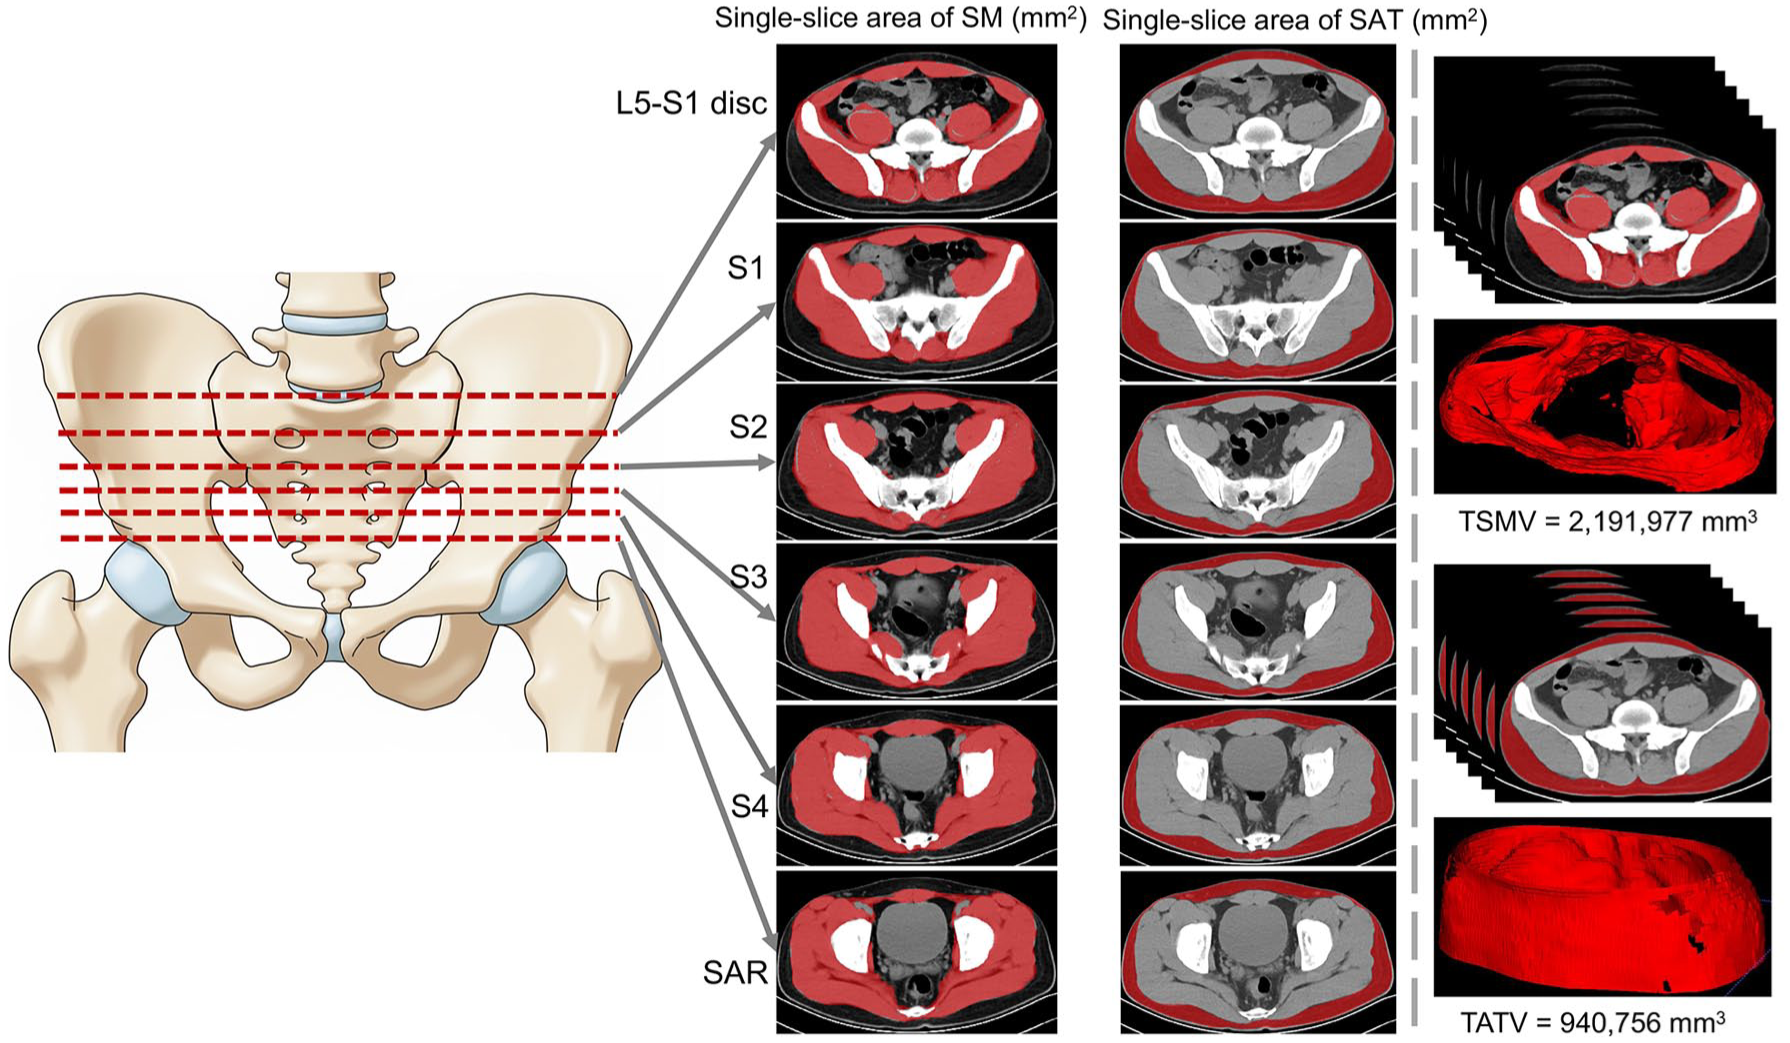
Schematic illustration of the measurement indices (original illustration). Measurements were performed at six predefined axial levels: the L5–S1 intervertebral disc, the S1, S2, S3, and S4 sacral foramina, and the SAR. At each level, the cross-sectional areas of SAT and SM were quantified. TATV and TSMV were calculated between the L5–S1 intervertebral disc and the SAR.
Statistical analysis
Continuous variables were presented as mean ± standard deviation (SD) or median (interquartile range, IQR) based on normality, assessed by the Shapiro–Wilk test. Categorical variables were presented as frequencies (%). The associations between SAT/SM ratio, TATV/TSMV ratio, SM radiodensity, and ASDAS were assessed using Spearman correlation analysis. To address the issue of multicollinearity among the body composition variables, a least absolute shrinkage and selection operator (LASSO) regression analysis was performed. Specifically, these comprised age, sex, disease duration, the slice-specific SAT/SM ratios, and the overall TATV/TSMV ratio. The optimal penalty parameter (λ) was selected via 10-fold cross-validation. The candidate variables selected by the LASSO regression, along with age, sex, disease duration, and SM radiodensity, were further included in univariable and multivariable linear regression analyses to evaluate their independent associations with ASDAS. Univariable restricted cubic spline (RCS) analysis was employed to explore the potential nonlinear relationships of the overall TATV/TSMV ratio and SM radiodensity with ASDAS. Furthermore, RCS within a Cox model was used to explore the potential nonlinear relationship between the overall TATV/TSMV ratio and the likelihood of not achieving MI (ΔASDAS ⩾2.0). This approach allowed us to flexibly model the relationship and calculate the corresponding hazard ratios (HRs) with 95% confidence intervals (CIs). Kaplan–Meier curves were further plotted to compare the probability of achieving MI between the two groups stratified by the inflection point was identified in the RCS analysis. The log-rank test was used to assess significance. A two-sided p-value <0.05 was considered statistically significant. All statistical analyses were performed using R software (version 4.4.2; R Foundation for Statistical Computing, Vienna, Austria).
Results
Patient characteristics
A total of 215 eligible patients were enrolled, comprising 26 with axSpA (defined as fulfilling the ASAS criteria but not the mNY criteria) and 189 with ankylosing spondylitis (AS; Table 1). Of the 26 patients with axSpA, 18 were classified under the imaging arm of the ASAS criteria. The cohort was predominantly male (77.2%) with a median age of 32 years (IQR, 17) and a median disease duration of 3 years (IQR, 6). The mean disease activity scores at the time of registry enrollment were 2.27 ± 1.1 for ASDAS-CRP and 2.46 ± 1.18 for ASDAS-ESR. Based on these scores, more than half of the patients were classified as having active disease.
Clinical characteristics of the patients with axial spondyloarthritis.

Prescribed for the patient at the initial visit.
ASAS, Assessment of SpondyloArthritis international Society; ASDAS, Ankylosing Spondylitis Disease Activity Score; CRP, C-reactive protein; DMARDs, disease-modifying anti-rheumatic drugs; ESR, erythrocyte sedimentation rate; IBD, inflammatory bowel disease; MASES, Maastricht Ankylosing Spondylitis Enthesitis Score; mNY, modified New York; NSAIDs, nonsteroidal anti-inflammatory drugs; Q1, 1st quartile; Q3, 3rd quartile; SD, standard deviation.
Body compositional measurements
In this analysis, 215 eligible patients were included. The mean SAT/SM ratios across the six pelvic slices (from L5 to S1 to the superior acetabular rim) were 1.15, 0.88, 0.70, 0.61, 0.55, and 0.59, respectively. The corresponding total volumes were as follows: TATV = 1,227,059.8 mm3, TSMV = 1,800,938.6 mm3, and the overall TATV/TSMV ratio was 0.69. The mean SM radiodensity was 46.3. Quantitative data on the cross-sectional area and volume of SAT and SM, as well as SM radiodensity in the pelvis, are presented in Table 2.
Summary of cross-sectional area, volume of SAT and SM, and SM radiodensity of pelvis (from L5 to S1 level to SAR level).

Calculated by averaging the CT values (in HU) of single-slice radiodensity of SM.
CT, computed tomography; HU, Hounsfield units; L, lumbar vertebra; S, sacral foramina; SAR, superior acetabular rim; SAT, subcutaneous adipose tissue; SD, standard deviation; SM, skeletal muscle; TATV, total adipose tissue volume; TSMV, total skeletal muscle volume.
Correlation analysis
Both the slice-specific SAT/SM ratios and the overall TATV/TSMV ratio demonstrated positive, albeit modest, correlations with ASDAS (correlation coefficients ranged from 0.16 to 0.21; all p-values <0.05). Although a negative correlation was observed between SM radiodensity and ASDAS, this represented a nonsignificant trend (Table 3).
Spearman correlations between SAT/SM ratio, TATV/TSMV ratio, radiodensity of SM, and ASDAS.

ASDAS, Ankylosing Spondylitis Disease Activity Score; CI, confidence interval; CRP, C-reactive protein; ESR, erythrocyte sedimentation rate; L, lumbar vertebra; S, sacral foramina; SAR, superior acetabular rim; SAT, subcutaneous adipose tissue; SM, skeletal muscle; TATV, total adipose tissue volume; TSMV, total skeletal muscle volume.
Regression analysis
At the optimal λ value of 0.00316, the LASSO regression model identified the SAT/SM ratio at the S4 level and the overall TATV/TSMV ratio as significant risk factors for higher ASDAS (Figure S1). Linear regression models further demonstrated that the overall TATV/TSMV ratio remained independently associated with both ASDAS-CRP (β = 0.722, 95% CI: 0.215–1.231, p = 0.004; Table 4) and ASDAS-ESR (β = 0.634, 95% CI: 0.059–1.208, p = 0.03; Table S1). Based on the residuals versus fitted values plot and the Q–Q plot, the regression models were validated as well-fitted (Figure S2). Despite a marginal inverse relationship, SM radiodensity was not statistically significantly associated with ASDAS (Table 4 and Table S1).
Linear regression models for estimation of effect of TATV/TSMV ratio on ASDAS-CRP.

ASDAS, Ankylosing Spondylitis Disease Activity Score; CI, confidence interval; CRP, C-reactive protein; SM, skeletal muscle; TATV, total adipose tissue volume; TSMV, total skeletal muscle volume.
Nonlinear dose–response analysis and Cox regression
The univariable RCS analysis identified a significant nonlinear relationship between the overall TATV/TSMV ratio and both ASDAS-CRP (Figure S3, p for nonlinearity: 0.009) and ASDAS-ESR (Figure S4, p for nonlinearity: 0.003). The SM radiodensity showed no significant nonlinear relationship with ASDAS (ASDAS-CRP: p for nonlinearity: 0.192, Figure S5; ASDAS-ESR: p for nonlinearity: 0.088, Figure S6). Next, the RCS analysis, combined with the Cox regression, was further performed. This analysis included 157 patients, all of whom underwent at least one follow-up visit to enable the calculation of ΔASDAS 2.0. The median follow-up duration was 3 months (IQR 1–4). The outcome variable was defined as failure to achieve MI. A significant nonlinear relationship was observed between the overall TATV/TSMV ratio and ASDAS-CRP (p for nonlinearity = 0.045; Figure 2), with an inflection point identified at a ratio of 0.65. Below this threshold, the ratio showed an inverse but nonsignificant association with ASDAS-CRP (HR = 0.35, 95% CI: 0.15–5.84, p = 0.45). In contrast, above 0.65, a higher ratio was significantly associated with elevated ASDAS-CRP (HR = 3.64, 95% CI: 1.13–11.71, p = 0.029). A similar pattern was observed for ASDAS-ESR (Figure S7). Within the framework of Cox regression, the RCS assessment revealed no significant nonlinear association between SM radiodensity and ASDAS (ASDAS-CRP: p for nonlinearity: 0.76, Figure S8; ASDAS-ESR: p for nonlinearity: 0.27, Figure S9).

Non-linear association between the overall TATV/TSMV ratio and major improvement (ΔASDAS-CRP 2.0), as assessed by restricted cubic spline analysis and Cox regression.
Kaplan–Meier analysis for MI
Using the inflection point of 0.65, patients were stratified into low (<0.65, n = 77) and high (⩾0.65, n = 80) TATV/TSMV ratio groups. The Kaplan–Meier curves for achieving MI are shown in Figures S10 and S11. Log-rank tests revealed that patients in the high-ratio group were significantly less likely to achieve MI compared to the low-ratio group (ASDAS-CRP: HR = 1.64, 95% CI: 1.04–2.59, p = 0.04; ASDAS-ESR: HR = 1.72, 95% CI: 1.07–2.78, p = 0.032). Similarly, patients were stratified by the SM radiodensity inflection point (47.5) into low (<47.5, n = 78) and high (⩾47.5, n = 79) groups. Kaplan–Meier curves for MI achievement are shown in Figures S12 and S13. The log-rank test showed no significant difference between the two groups in achieving MI (ASDAS-CRP: HR 0.87, 95% CI: 0.55–1.36, p = 0.53; ASDAS-ESR: HR 0.92, 95% CI: 0.60–1.41, p = 0.68).
Discussion
We conducted the first analysis exploring the link between body composition and disease activity in axSpA, thereby providing the initial evidence in this area. The central finding is the independent association of the TATV/TSMV ratio with elevated disease activity and a lower likelihood of achieving MI. Furthermore, the identification of a specific, nonlinear threshold at 0.65 offers new insights for clinical assessment.
The positive correlation between the TATV/TSMV ratio and ASDAS underscores the pathophysiological interplay between adipose and muscle tissue in chronic inflammation. Adipose tissue serves not only as an energy reservoir but also as a dynamic endocrine organ, secreting a wide range of bioactive molecules known as adipokines. 27 These adipokines can exert either pro-inflammatory or anti-inflammatory effects. Prominent examples of pro-inflammatory adipokines 28 include leptin, resistin, tumor necrosis factor (TNF), interleukin-6 (IL-6), retinol-binding protein 4, lipocalin 2, interleukin-18 (IL-18), angiopoietin-like protein 2 (ANGPTL2), CC-chemokine ligand 2, and CXC-chemokine ligand 5. In contrast, adiponectin is a key anti-inflammatory adipokine that helps to counteract inflammatory responses. 29 Excess adipose mass is closely linked to elevated concentrations of CRP in the blood. 30 Furthermore, increased levels of both CRP and IL-6 serve as independent predictors for the development of type 2 diabetes across diverse populations. 31 SM communicates with other organs through the secretion of proteins known as myokines. 32 These myokines can balance and counteract the effects of adipokines and are capable of mediating the protective effects of muscular exercise against diseases associated with physical inactivity. 33 Identified myokines include myostatin, leukemia inhibitory factor, IL‑6, IL‑7, brain-derived neurotrophic factor, insulin-like growth factor 1, fibroblast growth factor 2, follistatin-related protein 1, and irisin. 33 For example, exercise is now considered an anti-inflammatory therapy for various rheumatic diseases through myokine regulation. 34 In our study, a high TATV/TSMV ratio was associated with increased disease activity in axSpA. While this imbalance between adipose and muscle tissue may reflect a complex interplay of adipokines and myokines, the current data cannot determine whether these factors directly modulate disease activity in axSpA. Further investigation into these potential mechanisms is warranted.
Our assessment was confined to SAT and did not extend to visceral adipose tissue (VAT), a constraint of the retrospective design. It should be emphasized that VAT, despite comprising only 5%–20% of total body fat, is disproportionately harmful and constitutes a major determinant for the development of insulin resistance, type 2 diabetes, cardiovascular disease, and increased overall mortality. 35 This is largely because of its enhanced capacity to promote inflammation, mediated through the elevated release of factors such as TNF-α, IL-6, CRP, plasminogen activator inhibitor-1, and angiotensinogen. 36 SAT, in comparison, is the principal site of leptin synthesis—an adipokine that also participates in pro-inflammatory pathways. 37
The nonlinear relationship, characterized by an inflection point, is a crucial advancement. It suggests that the detrimental effects of adipose dominance become clinically significant only after a certain threshold is crossed. Below this threshold, a certain amount of adipose tissue might even be benign or have minor metabolic consequences, while SM mass might remain protective. We further investigated the association between SM radiodensity and disease activity in axSpA. SM radiodensity has been increasingly recognized as a critical factor influencing treatment response and clinical outcomes in various disease contexts. 38 In our study, SM radiodensity showed a nonsignificant inverse trend with ASDAS, suggestive of a potential relationship that was not confirmed statistically.
Compared to BMI, body composition analysis provides a more nuanced understanding of body adipose and muscle mass, offering greater potential for investigating their roles in modulating disease activity in axSpA. The observed nonlinear relationships, however, highlight the complexity of this regulation. To elucidate these mechanisms and ultimately inform strategies for optimizing body composition, future research utilizing larger sample sizes, advanced measurement tools, and multicenter study designs is needed. Recently, our team developed BioCompNet, a deep learning-based workflow specifically designed for the fully automated segmentation and quantification of body composition. 39 This tool integrates dual-parametric MRI sequences (water/fat) with a hierarchical U-Net architecture to quantify 15 biomechanically critical components across the abdomen and thigh. More importantly, it has been rigorously validated, achieving average Dice similarity coefficients of 0.944 and 0.961 on internal test sets and demonstrating excellent interreader reliability (intraclass correlation coefficient ⩾0.881) compared to expert annotations. This validated tool can underpin such investigations by providing rapid (0.12 min per case) and precise volumetric analysis.
Limitations
Our study has several limitations. First, as a single-center investigation with a limited sample size, the findings may not be generalizable to broader populations. Second, the relatively short follow-up period (median 3 months) may be insufficient for the accurate assessment of MI. This short timeframe may affect the robustness of the Kaplan–Meier estimates and should be considered when interpreting the longitudinal findings. Longer observation periods are warranted in future studies to confirm whether the observed associations persist over time and to better characterize the trajectory of clinical improvement in relation to baseline body composition. Third, SM and SAT were segmented using a semi-automatic, manual approach, which may introduce measurement variability. Although a senior radiologist reviewed the segmentations, the absence of an automated or fully blinded dual-reading process represents a potential source of interobserver variability that warrants acknowledgment. With the development of more specialized AI-based segmentation models in the future, such as TotalSegmentator, 40 automated quantitative segmentation is expected to become feasible. Fourth, the optimal cut-off value of 0.65 for the TATV/TSMV ratio was identified via RCS analysis within this specific cohort. As this threshold has not been validated in an external, independent population, its clinical utility remains preliminary and requires confirmation in future studies. Fifth, due to the retrospective design, we did not account for potential confounding factors during the follow-up period, including changes in body weight, dietary habits, and physical activity levels. As these factors are known to influence both body composition and systemic inflammation, their omission may limit the interpretation of the TATV/TSMV ratio as a factor independently associated with clinical improvement. These limitations should be considered when interpreting the results.
Conclusion
Our findings suggest that the pelvic TATV/TSMV ratio may serve as an independent biomarker associated with elevated disease activity in axSpA. A cut-off of 0.65 enables practical risk stratification, although further validation is required. These observations highlight body composition as a potentially modifiable factor in axSpA management.
Supplemental Material
sj-docx-13-tab-10.1177_1759720X261442029 – Supplemental material for Associations of muscle mass, adipose tissue mass, and skeletal muscle radiodensity with disease activity in axial spondyloarthritis
Supplemental material, sj-docx-13-tab-10.1177_1759720X261442029 for Associations of muscle mass, adipose tissue mass, and skeletal muscle radiodensity with disease activity in axial spondyloarthritis by Ran Cui, Xin-Yu Song, Jian-Yong Wei, Wen-Li Zhou, Yi-Li Tao, Xiao-Er Wei, Zhiyong Chen and Sheng-Ming Dai in Therapeutic Advances in Musculoskeletal Disease
Supplemental Material
sj-docx-14-tab-10.1177_1759720X261442029 – Supplemental material for Associations of muscle mass, adipose tissue mass, and skeletal muscle radiodensity with disease activity in axial spondyloarthritis
Supplemental material, sj-docx-14-tab-10.1177_1759720X261442029 for Associations of muscle mass, adipose tissue mass, and skeletal muscle radiodensity with disease activity in axial spondyloarthritis by Ran Cui, Xin-Yu Song, Jian-Yong Wei, Wen-Li Zhou, Yi-Li Tao, Xiao-Er Wei, Zhiyong Chen and Sheng-Ming Dai in Therapeutic Advances in Musculoskeletal Disease
Supplemental Material
sj-docx-15-tab-10.1177_1759720X261442029 – Supplemental material for Associations of muscle mass, adipose tissue mass, and skeletal muscle radiodensity with disease activity in axial spondyloarthritis
Supplemental material, sj-docx-15-tab-10.1177_1759720X261442029 for Associations of muscle mass, adipose tissue mass, and skeletal muscle radiodensity with disease activity in axial spondyloarthritis by Ran Cui, Xin-Yu Song, Jian-Yong Wei, Wen-Li Zhou, Yi-Li Tao, Xiao-Er Wei, Zhiyong Chen and Sheng-Ming Dai in Therapeutic Advances in Musculoskeletal Disease
Supplemental Material
sj-tif-1-tab-10.1177_1759720X261442029 – Supplemental material for Associations of muscle mass, adipose tissue mass, and skeletal muscle radiodensity with disease activity in axial spondyloarthritis
Supplemental material, sj-tif-1-tab-10.1177_1759720X261442029 for Associations of muscle mass, adipose tissue mass, and skeletal muscle radiodensity with disease activity in axial spondyloarthritis by Ran Cui, Xin-Yu Song, Jian-Yong Wei, Wen-Li Zhou, Yi-Li Tao, Xiao-Er Wei, Zhiyong Chen and Sheng-Ming Dai in Therapeutic Advances in Musculoskeletal Disease
Supplemental Material
sj-tif-10-tab-10.1177_1759720X261442029 – Supplemental material for Associations of muscle mass, adipose tissue mass, and skeletal muscle radiodensity with disease activity in axial spondyloarthritis
Supplemental material, sj-tif-10-tab-10.1177_1759720X261442029 for Associations of muscle mass, adipose tissue mass, and skeletal muscle radiodensity with disease activity in axial spondyloarthritis by Ran Cui, Xin-Yu Song, Jian-Yong Wei, Wen-Li Zhou, Yi-Li Tao, Xiao-Er Wei, Zhiyong Chen and Sheng-Ming Dai in Therapeutic Advances in Musculoskeletal Disease
Supplemental Material
sj-tif-11-tab-10.1177_1759720X261442029 – Supplemental material for Associations of muscle mass, adipose tissue mass, and skeletal muscle radiodensity with disease activity in axial spondyloarthritis
Supplemental material, sj-tif-11-tab-10.1177_1759720X261442029 for Associations of muscle mass, adipose tissue mass, and skeletal muscle radiodensity with disease activity in axial spondyloarthritis by Ran Cui, Xin-Yu Song, Jian-Yong Wei, Wen-Li Zhou, Yi-Li Tao, Xiao-Er Wei, Zhiyong Chen and Sheng-Ming Dai in Therapeutic Advances in Musculoskeletal Disease
Supplemental Material
sj-tif-12-tab-10.1177_1759720X261442029 – Supplemental material for Associations of muscle mass, adipose tissue mass, and skeletal muscle radiodensity with disease activity in axial spondyloarthritis
Supplemental material, sj-tif-12-tab-10.1177_1759720X261442029 for Associations of muscle mass, adipose tissue mass, and skeletal muscle radiodensity with disease activity in axial spondyloarthritis by Ran Cui, Xin-Yu Song, Jian-Yong Wei, Wen-Li Zhou, Yi-Li Tao, Xiao-Er Wei, Zhiyong Chen and Sheng-Ming Dai in Therapeutic Advances in Musculoskeletal Disease
Supplemental Material
sj-tif-2-tab-10.1177_1759720X261442029 – Supplemental material for Associations of muscle mass, adipose tissue mass, and skeletal muscle radiodensity with disease activity in axial spondyloarthritis
Supplemental material, sj-tif-2-tab-10.1177_1759720X261442029 for Associations of muscle mass, adipose tissue mass, and skeletal muscle radiodensity with disease activity in axial spondyloarthritis by Ran Cui, Xin-Yu Song, Jian-Yong Wei, Wen-Li Zhou, Yi-Li Tao, Xiao-Er Wei, Zhiyong Chen and Sheng-Ming Dai in Therapeutic Advances in Musculoskeletal Disease
Supplemental Material
sj-tif-3-tab-10.1177_1759720X261442029 – Supplemental material for Associations of muscle mass, adipose tissue mass, and skeletal muscle radiodensity with disease activity in axial spondyloarthritis
Supplemental material, sj-tif-3-tab-10.1177_1759720X261442029 for Associations of muscle mass, adipose tissue mass, and skeletal muscle radiodensity with disease activity in axial spondyloarthritis by Ran Cui, Xin-Yu Song, Jian-Yong Wei, Wen-Li Zhou, Yi-Li Tao, Xiao-Er Wei, Zhiyong Chen and Sheng-Ming Dai in Therapeutic Advances in Musculoskeletal Disease
Supplemental Material
sj-tif-4-tab-10.1177_1759720X261442029 – Supplemental material for Associations of muscle mass, adipose tissue mass, and skeletal muscle radiodensity with disease activity in axial spondyloarthritis
Supplemental material, sj-tif-4-tab-10.1177_1759720X261442029 for Associations of muscle mass, adipose tissue mass, and skeletal muscle radiodensity with disease activity in axial spondyloarthritis by Ran Cui, Xin-Yu Song, Jian-Yong Wei, Wen-Li Zhou, Yi-Li Tao, Xiao-Er Wei, Zhiyong Chen and Sheng-Ming Dai in Therapeutic Advances in Musculoskeletal Disease
Supplemental Material
sj-tif-5-tab-10.1177_1759720X261442029 – Supplemental material for Associations of muscle mass, adipose tissue mass, and skeletal muscle radiodensity with disease activity in axial spondyloarthritis
Supplemental material, sj-tif-5-tab-10.1177_1759720X261442029 for Associations of muscle mass, adipose tissue mass, and skeletal muscle radiodensity with disease activity in axial spondyloarthritis by Ran Cui, Xin-Yu Song, Jian-Yong Wei, Wen-Li Zhou, Yi-Li Tao, Xiao-Er Wei, Zhiyong Chen and Sheng-Ming Dai in Therapeutic Advances in Musculoskeletal Disease
Supplemental Material
sj-tif-6-tab-10.1177_1759720X261442029 – Supplemental material for Associations of muscle mass, adipose tissue mass, and skeletal muscle radiodensity with disease activity in axial spondyloarthritis
Supplemental material, sj-tif-6-tab-10.1177_1759720X261442029 for Associations of muscle mass, adipose tissue mass, and skeletal muscle radiodensity with disease activity in axial spondyloarthritis by Ran Cui, Xin-Yu Song, Jian-Yong Wei, Wen-Li Zhou, Yi-Li Tao, Xiao-Er Wei, Zhiyong Chen and Sheng-Ming Dai in Therapeutic Advances in Musculoskeletal Disease
Supplemental Material
sj-tif-7-tab-10.1177_1759720X261442029 – Supplemental material for Associations of muscle mass, adipose tissue mass, and skeletal muscle radiodensity with disease activity in axial spondyloarthritis
Supplemental material, sj-tif-7-tab-10.1177_1759720X261442029 for Associations of muscle mass, adipose tissue mass, and skeletal muscle radiodensity with disease activity in axial spondyloarthritis by Ran Cui, Xin-Yu Song, Jian-Yong Wei, Wen-Li Zhou, Yi-Li Tao, Xiao-Er Wei, Zhiyong Chen and Sheng-Ming Dai in Therapeutic Advances in Musculoskeletal Disease
Supplemental Material
sj-tif-8-tab-10.1177_1759720X261442029 – Supplemental material for Associations of muscle mass, adipose tissue mass, and skeletal muscle radiodensity with disease activity in axial spondyloarthritis
Supplemental material, sj-tif-8-tab-10.1177_1759720X261442029 for Associations of muscle mass, adipose tissue mass, and skeletal muscle radiodensity with disease activity in axial spondyloarthritis by Ran Cui, Xin-Yu Song, Jian-Yong Wei, Wen-Li Zhou, Yi-Li Tao, Xiao-Er Wei, Zhiyong Chen and Sheng-Ming Dai in Therapeutic Advances in Musculoskeletal Disease
Supplemental Material
sj-tif-9-tab-10.1177_1759720X261442029 – Supplemental material for Associations of muscle mass, adipose tissue mass, and skeletal muscle radiodensity with disease activity in axial spondyloarthritis
Supplemental material, sj-tif-9-tab-10.1177_1759720X261442029 for Associations of muscle mass, adipose tissue mass, and skeletal muscle radiodensity with disease activity in axial spondyloarthritis by Ran Cui, Xin-Yu Song, Jian-Yong Wei, Wen-Li Zhou, Yi-Li Tao, Xiao-Er Wei, Zhiyong Chen and Sheng-Ming Dai in Therapeutic Advances in Musculoskeletal Disease