
Abstract
Background:
Immune cells are involved in rheumatoid arthritis (RA), but the link between other blood cell indices and the disease activity of RA, along with the underlying mechanisms, is unclear.
Objective:
This study aimed to develop an interpretable machine learning model based on blood cell parameters to assess RA disease severity and assist in personalized treatment decisions.
Methods:
A retrospective case–control study was conducted with blood routine and biochemical detection data from 4401 patients at the First Affiliated Hospital of Guangxi Medical University, spanning from January 1, 2018, to January 1, 2024. The primary outcome was disease severity stratification. Recursive feature elimination was applied to identify key variables, and 10 machine learning algorithms were benchmarked on 55 clinical features with internal validation. Model interpretability was assessed with SHAP, while logistic regression and restricted cubic spline models were used to examine associations between blood cell indices and disease severity. In addition, Mendelian randomization analysis was performed to explore potential causal relationships.
Design:
This was a retrospective case–control study.
Results:
Blood cell indices were identified as the primary factors associated with RA severity. In model evaluation, the Random Forest achieved the best performance, with test set AUCs of 0.870 and 0.874. Mendelian randomization supported a causal relationship between blood cell indices and RA risk.
Conclusion:
These results reinforce the associations between blood cell indices and RA severity. The machine learning model demonstrates good predictive capabilities for RA severity and may assist clinicians in developing personalized treatment strategies.
Plain language summary
Keywords
Introduction
Rheumatoid arthritis (RA) is a chronic inflammatory autoimmune disease that frequently progresses to irreversible joint damage and significant physical disability. 1 RA primarily targets synovial joints, leading to progressive bone erosion and disability through chronic synovitis. 2 Blood biomarkers increase dramatically in response to tissue damage and inflammatory processes. Therefore, characterizing blood biomarker responses in RA critical to gain insight into the activity of the disease.3,4 Most existing studies focus on the association between acute reactants and disease activity, but lack studies on markers associated with disease severity.
Blood biomarkers, such as C-reactive protein (CRP) and erythrocyte sedimentation rate (ESR), have long been used to monitor RA activity.5,6 However, these markers lack specificity and may not fully capture the complex interplay between hematological and immune systems in RA progression. Emerging evidence suggests that routine blood cell indices including platelet count, neutrophil-to-lymphocyte ratio (NLR), and red cell distribution width (RDW) reflect systemic inflammation and oxidative stress, processes intimately linked to RA pathogenesis.7–10 For instance, platelets contribute to synovial inflammation via cytokine release, while elevated NLR correlates with pro-inflammatory cytokine levels.11,12 Despite these insights, the relationship between comprehensive blood cell indices and RA severity, the causal relationship between blood cell indices and RA, and the diagnostic value of blood cell indices in predicting RA severity remain underexplored.
In this study, the machine learning (ML) models built using blood cell indices can more accurately predict the severity of the disease. By analyzing a large retrospective case–control of incident RA patients, we establish associations between blood cell indices and RA severity. Utilizing interpretable ML models to predict disease severity stratification and identify key hematological thresholds with clinical relevance to support personalized management of patients with rheumatoid arthritis. Additionally, we employed Mendelian randomization (MR) analysis to assess causal associations.
Methods
Data sources
Patients diagnosed with RA were retrospectively examined for inclusion in the study. The reporting of this study conforms to the Strengthening the Reporting of Observational Studies in Epidemiology (STROBE) statement.13,14 All patients in this study demonstrated unequivocal radiographic evidence of joint erosions, accompanied by pain or swelling in the hands, wrists, or other small joints, and met the 2010 American College of Rheumatology/European League Against Rheumatism (ACR/EULAR) classification criteria for RA. 15 A comprehensive dataset, encompassing demographic characteristics, hematological indices, biochemical indices, and derived hematological parameters, was extracted from electronic medical records. The dataset included demographic information (age and sex), hematological indices (red blood cell count (RBC), hemoglobin concentration (HGB), hematocrit percentage (HCT), mean corpuscular volume (MCV), mean corpuscular hemoglobin (MCH), mean corpuscular hemoglobin concentration (MCHC), red blood cell distribution width (RDW), white blood cell count (WBC), basophil count (BASO), basophil percentage (BASO%), eosinophil count (EO), eosinophil percentage (EO%), monocyte count (MONO), monocyte percentage (MONO%), neutrophil count (NEUT), neutrophil percentage (NEUT%), lymphocyte count (LYMPH), lymphocyte percentage (LYMPH%), platelet crit (PCT), mean platelet volume (MPV), platelet distribution width (PDW), and platelet count (PLT)), biochemical indices (total cholesterol (TC), direct bilirubin (DBIL), indirect bilirubin (IBIL), direct-to-total bilirubin ratio (DTR), total protein (TP), albumin (ALB), globulin (GLOB), albumin-to-globulin ratio (AGR), gamma-glutamyl transferase (GGT), total bile acids (TBA), aspartate aminotransferase (AST), alanine aminotransferase (ALT), aspartate-to-alanine aminotransferase ratio (AAR), alkaline phosphatase (ALP), prealbumin (PA), urea (UREA), creatinine (Cr), uric acid (UA), bicarbonate (HCO3-), endogenous creatinine clearance (Ccr), cystatin C (CysC), high-sensitivity troponin (hsTn), creatine kinase (CK), creatine kinase isoenzyme (CK-MB), lactate dehydrogenase (LDH), alpha-hydroxybutyrate dehydrogenase (HBDH), random blood glucose (RBG), and erythrocyte sedimentation rate (ESR)), and derived hematological parameters (neutrophil-to-lymphocyte ratio (NLR), monocyte-to-lymphocyte ratio (MLR), and platelet-to-lymphocyte ratio (PLR)). Each indicator’s corresponding abbreviation is provided in Table S1. Participants with other inflammatory or infectious diseases (N = 109), autoimmune disorders (N = 13), lacking follow-up data (N = 461), or presenting serious complications or tumors (N = 76) were excluded from the study. Ultimately, the primary analysis included 4401 participants (Figure 1). Prior to analysis, data quality control was performed. Continuous variables were examined for implausible outliers, which were handled using winsorization at the 1st and 99th percentiles. Missing values were rare (<5% for all variables), and all samples with any missing values were excluded from the analysis. As a sensitivity check, analyses were repeated using multiple imputation by chained equations, and the results were consistent with the primary analysis. Patients were eligible if they: (1) were aged 18 years or older; (2) had a confirmed diagnosis of RA according to the 2010 ACR/EULAR classification criteria; (3) had complete baseline laboratory and clinical data, including Disease Activity Score 28 based on ESR (DAS28-ESR) and the Clinical Disease Activity Index (CDAI). Exclusion criteria were: (1) concomitant autoimmune diseases other than RA; (2) active infection, hematologic disorders, or malignancy at baseline; (3) missing key clinical or laboratory information; (4) pregnancy or lactation.

Flowchart of the study design.
Definition of disease severity
The RA patients’ treatment plan strictly followed the management of rheumatoid arthritis: summary of NICE guidance. 16 Disease severity was primarily determined using validated and widely accepted disease activity indices, including the DAS28-ESR and CDAI. Patients with DAS28 ⩽3.2 and CDAI ⩽10 were classified as having mild disease, whereas those with DAS28 >5.1 and CDAI >22 were classified as having severe disease. To better contextualize the clinical characteristics of each group, we reviewed accompanying clinical information (e.g., care setting or treatment intensity). However, these variables were not used to define severity labels; instead, they served only as supportive descriptors to confirm overall clinical plausibility. This approach ensured that severity labeling was based solely on standardized disease activity indices, thereby minimizing circularity and reducing the risk of treatment-related confounding.
Development and performance benchmarking of ML models
All features, including demographic characteristics, hematological indices, biochemical indices, and derived hematological parameters, were included in the development of 10 machine learning models. Compare and evaluate the performance of 10 machine learning methods through benchmarks. Benchmarking is a common practice in machine learning to assess the performance of different algorithms. The “mlr3verse” R package allows for comparison of multiple learners (algorithms), tasks (data), and average performance across various resampling strategies (multiple data copies). Ensuring the fairness of tests is essential in benchmarking. Each algorithm must train on the same resampling training set and be evaluated on the same resampling test set. These tasks are automatically handled by the benchmark() function with a repeated 10-fold cross-validation approach designed to maximize performance metrics.17–19 The optimal model was identified by benchmarking its performance on both the training and test sets using a comprehensive set of evaluation metrics. These included accuracy, sensitivity, specificity, precision, F1 score, and Brier score, all calculated based on the test set results with model-specific decision thresholds. To further assess model reliability, calibration curves were plotted to evaluate the agreement between predicted probabilities and observed outcomes. Additionally, decision curve analysis was performed to examine the clinical utility of each model across different threshold probabilities. The use of the independent test set ensured an objective and robust comparison, facilitating the selection of the best-performing model.
Feature selection and optimized ML model development
To ensure appropriate scaling for algorithms sensitive to feature magnitude, all continuous variables were standardized prior to model training. Specifically, z-score transformation (subtracting the mean and dividing by the standard deviation) was applied using parameters derived from the training set, and the same parameters were used to transform the validation and test sets. Standardized features were used for logistic regression, Support Vector Machine (SVM), neural network, K-Nearest Neighbors (KNN), and other distance- or gradient-based algorithms. Although tree-based models (Random Forest (RF), Extreme Gradient Boosting (XGB), LightGBM, CatBoost) are generally invariant to monotonic scaling, the same preprocessing pipeline was applied uniformly for consistency and reproducibility.
To identify key indices associated with RA severity, recursive feature elimination (RFE) was employed. 20 RFE is a feature selection algorithm that iteratively trains a model, ranks features based on their importance, and eliminates the least important features until an optimal subset is identified. In this study, RFE was implemented using a RF with the best performance classifier to evaluate feature importance, with 10-fold cross-validation to ensure robust performance assessment. 21 The initial input included all variables. The RFE process was iterated until model performance convergence. The final selected features were used to reconstruct the predictive models. All analyses were performed using “pbapply,” “rlang,” “tidyverse,” “reshape2,” “openxlsx” R packages. To train and validate the models, the dataset was randomly split into 70% for training and 30% for testing. Ten machine learning algorithms were implemented, including Logistic Regression, SVM, Gradient Boosting Machine (GBM), Neural Network, RF, XGBoost, KNN, AdaBoost, LightGBM, and CatBoost. Final hyperparameters for each model were optimized using a combination of grid search and manual fine-tuning.22,23 To improve reproducibility, we provide a detailed description of the hyperparameter tuning procedure. First, for each model, we defined a predefined hyperparameter search space (e.g., number of trees = 100–1000 and maximum tree depth = 3–15 for RF; learning rate = 0.01–0.3 and max_depth = 3–10 for XGBoost; C = 0.1–10 and kernel = radial basis/linear for SVM). Grid search was performed using a 5-fold cross-validation strategy on the training set to identify the optimal combination of hyperparameters within these ranges. Model performance was evaluated using average area under the curve (AUC) and Brier score across folds. After grid search, a second step of manual fine-tuning was performed only for the top-performing models (RF, XGBoost, LightGBM). This process involved adjusting a small set of sensitive parameters (e.g., learning rate, tree depth, or minimum child weight) within a narrower range around the grid-search-derived values. Adjustments were guided by cross-validated AUC and calibration performance. Because treatment factors such as conventional synthetic disease-modifying antirheumatic drugs (DMARDs), biologic DMARDs, targeted synthetic DMARDs, and surgery may influence both RA severity and hematological indices, we carefully considered treatment confounding. In the primary analysis, disease severity was defined independently of treatment factors, based solely on DAS28-ESR and CDAI. Additionally, we performed a sensitivity model excluding ESR and re-evaluated discrimination and calibration.
Explainable machine learning model
In this study, Shapley Additive Explanations (SHAP) was applied to gain insights into feature importance, interactions, and relationships.24–26 SHAP supports targeted feature engineering by identifying the most impactful features for ML models. 27 It assigns a level of importance to each individual patient (i.e., data point) based on the corresponding Shapley values. The SHAP value of a clinical variable reflects its average contribution across all possible combinations of clinical variables. These values can be positive or negative, representing an increased or decreased likelihood of achieving a clinical diagnosis, respectively.24,28 Model interpretation reveals not only the importance of features but also the direction of their impact on the predicted outcomes. This insight can help physicians understand potential associations between features and results.29,30 SHAP analysis can reveal the differences in features between different patients, helping doctors identify the heterogeneity of patient groups and thus perform stratified treatment. 29 Two commonly used visualization tools for model interpretation are SHAP waterfall charts and SHAP dependency graphs. SHAP waterfall charts are used to explain the prediction results of a machine learning model for a specific sample. It shows how the model’s prediction changes from the expected value (E[f(X)]) to the final predicted value (f(X)). 31 SHAP dependency graphs are used to show the impact of a single feature on the model’s prediction. This helps us understand how the feature affects the model’s output by plotting the relationship between the value of the feature and its corresponding SHAP value. 32 Interpretable ML methods were implemented via Python packages based on “NumPy,” “pandas,” “scikit-learn,” and “SHAP.” The code used in this study is available from the corresponding author upon reasonable request in accordance with the institutional confidentiality agreement.
Decision threshold determination
To enable clinical use of the model, a probability decision threshold was derived to convert predicted probabilities into binary severity classifications. The optimal threshold was determined on the training set using the Youden index (maximizing sensitivity + specificity − 1). For robustness, thresholds maximizing the F1 score and thresholds achieving a minimum sensitivity of 0.80 were also evaluated. The selected threshold was then applied to the held-out test set, and performance metrics including sensitivity, specificity, positive predictive value (PPV), negative predictive value (NPV), accuracy, and F1 score were calculated. The final threshold and its corresponding diagnostic metrics are provided in Table S2.
Covariates
At baseline, relevant covariates were chosen based on clinical expertise and previous research, including demographic factors such as age and sex, along with various blood cell indices and biochemical markers (see Table S3 for the complete list). To examine multicollinearity among these covariates, the variance inflation factor (VIF) was computed, and all VIF values were <10, signifying the absence of multicollinearity (Table S3 in the supporting information). Baseline laboratory tests were defined as those obtained within ±14 days of the index visit, which corresponded to the time of severity assessment. This time window was chosen to ensure temporal consistency between exposure and outcome measurements.
Statistical analysis
Baseline characteristics were described according to RA status, with continuous variables presented as medians (interquartile ranges (IQRs)) and categorical variables as frequencies (percentages). A flow diagram depicting the study design is shown in Figure 1. The top 15 significant clinical variables were ranked based on the SHAP feature importance plot. The Age, ESR, PLR, NLR, and ALP were excluded. Ten key blood cell indicators were identified: MPV, RBC, MCV, PLT, LYMPH, LYMPH%, HCT, PDW, NEUT%, and PCT. These 10 indicators were considered primary variables for their association with the severity of incident rheumatoid arthritis. Before performing binary logistic regression, the blood cell indices were standardized into Z scores (Z = [value − mean]/SD) to ensure that the odds ratio (OR) represented the effect of each standard deviation increase. The non-linearity was tested using cubic splines with three knots set as 10th, 50th, and 90th percentiles to facilitate comparison against the models with linear terms. Model I, adjusted for demographic variables, served as the baseline model. Model II made additional adjustments for other blood cell indices. In the sensitivity analysis, Model II was applied to examine the robustness of the results. All statistical analyses were carried out using IBM SPSS Statistics, version 27 (IBM Corp., Armonk, NY, USA).
MR analysis of blood cell indices on RA risk
We first retrieved the single nucleotide polymorphisms (SNPs) from the Integrative Epidemiology Unit (IEU) genome-wide association study (GWAS) database, and selected those SNPs that showed a p-value smaller than the GWAS significant threshold (p-value <5e-6). SNPs were then clumped based on the “TwoSampleMR” package in statistical software R, with the default linkage disequilibrium threshold r2 <0.001, distance >10,000 kb, and 1000 genomes European reference panel. Palindromic and ambiguous SNPs were further removed after harmonizing the data between exposure and outcome datasets (i.e., the default option in TwoSampleMR Rpackage). SNPs with F-statistic <10 were excluded to avoid weak instrument bias. 33 We employed multiple MR methods as summarized in Table S4.34–37 In brief, random-effect inverse variance weighted (IVW) provides unbiased estimates when all three MR assumptions are satisfied. The presence of pleiotropic SNPs that influence the outcome through pathways that bypass the exposure violates the exclusion restriction assumption of MR and undermine the validity of the estimates. Weighted median is robust to such outliers provided that the majority of selected genetic variants are valid instruments. 36 Fixed-effect inverse variance weighted (FE-IVW) provides unbiased and precise estimates when all three Mendelian randomization assumptions are satisfied, and there is no heterogeneity among the genetic variants. The presence of pleiotropic SNPs that influence the outcome through pathways bypassing the exposure violates the exclusion restriction assumption of MR, leading to biased estimates. FE-IVW is highly sensitive to heterogeneity, and its validity is undermined if the assumption of a common effect size across all variants is violated. 38 MR-Egger relaxes the assumption of exclusion restriction in the situation where the strengths of the instruments are uncorrelated with their direct effects on the outcome (the InSIDE assumption). 39 The Simple Mode method in Mendelian randomization clusters genetic variants to estimate causal effects, minimizing bias by assuming most variants are valid. 40 Weighted mode clusters genetic variants to estimate causal effects, allowing pleiotropic effects, and ensures consistency using kernel-smoothed density. 40 In this study, MR-Egger, weighted median (WM), IVW, simple mode, and weighted mode were used to conduct MR analysis to better evaluate the causal relationship between RA and blood cell count indices. When the level of pleiotropy of instrumental variables (IVs) does not exist, IVW has the highest statistical power; therefore, it is used as the main analysis method. 38 Different types of genetic pleiotropy are considered by other MR methods and are based on potentially different assumptions to check the robustness of the results. For example, WM can still provide unbiased causal estimation, when more than 50% of the information comes from invalid IVs. 34 The MR-Egger method can also provide an unbiased estimation of causality when all IVs do not meet the core MR hypothesis. 39 The effect of exposure on outcome was expressed using an OR and 95% confidence interval (95% CI). All the MR analyses conducted in this study were performed using “TwoSampleMR” packages in the R version 4.4.3.
Results
Basic characteristics of participants
The baseline characteristics of the study cohort, stratified by the severity of RA (mild vs severe), are presented in Table 1. This study included 4401 patients with RA, of whom 28.6% were male (n = 1260) and 71.4% were female (n = 3141). The median age of the overall cohort was 58 years, with the severe RA group being significantly older than the mild RA group. Significant differences were observed between the mild and severe RA groups in multiple hematological and biochemical indices, including RBC, hemoglobin, PLT, and ESR (all p < 0.05), as detailed in Table 1.
Baseline characteristics of patients with rheumatoid arthritis stratified by disease severity.

Data presented as median (IQR) for continuous variables and number (%) for categorical variables.
AAR, aspartate-to-alanine aminotransferase ratio; AGR, albumin-to-globulin ratio; ALB, albumin; ALP, alkaline phosphatase; ALT, alanine aminotransferase; AST, aspartate aminotransferase; BASO, basophil count; Ccr, endogenous creatinine clearance; CK, creatine kinase; CK-MB, creatine kinase isoenzyme; Cr, creatinine; CysC, cystatin C; DBIL, direct bilirubin; DTR, direct-to-total bilirubin ratio; EO, eosinophil count; ESR, erythrocyte sedimentation rate; GGT, gamma-glutamyl transferase; GLOB, globulin; HBDH, alpha-hydroxybutyrate dehydrogenase;
Performance evaluation and feature selection of machine learning models for rheumatoid arthritis severity prediction
The RF model, trained on 55 clinical variables without any feature selection or extraction, exhibited outstanding predictive performance on the test set, with an AUC of 0.870. Figure 3 presents a comparison of model performance, calibration curves, and decision curves. Additional evaluation metrics are provided in Table S5 of the supporting information. Given the superior performance of the Random Forest model compared to other models, its RFE effectively identified an optimal feature set comprising 15 variables (Figure 2). Beyond 15 features, the cross-validation error (0.20) and accuracy (0.75–0.78) stabilize, indicating diminishing returns and supporting the use of a concise feature subset. Variables such as Age, LYMPH%, PDW, PLR, ESR, RBC, HCT, PLT, MPV, NEUT%, PCT, LYMPH, MCV, ALP, and NLR were identified as key factors driving the model’s final output. Figure 3 shows a comparison of the performance, calibration curves, and decision curves for each final model using these improved variable sets. The RF models achieved the highest AUC of 0.874 on the test set. Other evaluation indicators are listed in Table S6 in the supporting information. We conducted a sensitivity analysis by excluding ESR and reassessed the model’s discrimination and calibration, with results remaining consistent (Figure S1 and Table S7). On the basis of these results, we chose the RF model as the optimal model for further analysis.

Cross-validation performance and feature importance from recursive feature elimination with Random Forest. The left panel displays the 10-fold CV error versus the number of features, with the dashed red line indicating the minimum error threshold. The middle panel shows the 10-fold CV accuracy versus the number of features, with the dashed red line marking the maximum accuracy threshold. The right panel presents the top 15 feature importances from RFE, ranked on the y-axis by significance, with higher-ranked features indicating greater importance.

The performance and comparison of 10 different predictive models. (a) ROC curves for the training set using all features. (b) Calibration curves for the training set using all features. (c) Decision curve analysis for the training set using all features. (d) ROC curves for the test set using all features. (e) Calibration curves for the test set using all features. (f) Decision curve analysis for the test set using all features. (g) ROC curves for the training set using the top 15 most important features. (h) Calibration curves for the training set using the top 15 most important features. (i) Decision curve analysis for the training set using the top 15 most important features. (j) ROC curves for the test set using the top 15 most important features. (k) Calibration curves for the test set using the top 15 most important features. (l) Decision curve analysis for the test set using the top 15 most important features.
Explainable machine learning model
The SHAP feature importance plot and SHAP summary plot (Figure 4) elucidate the interpretability of the RF model, highlighting the 15 most influential features. These key determinants of the model’s final output predominantly encompass blood cell indices and their potential derivatives, alongside demographic characteristics. Notably, 10 critical hematological parameters—LYMPH%, PDW, RBC, HCT, PLT, MPV, NEUT%, PCT, LYMPH, and MCV—emerge as central contributors, supplemented by the effects of Age, ESR, PLR, ALP, and NLR. Among these, LYMPH% and PDW exhibit the highest mean SHAP values, underscoring their significant impact on the model’s predictions. Therefore, we further analyzed the key blood cell indicators.

Global interpretation of the RF model and feature importance. The SHAP summary plot shows key features affecting the RF model’s predictions for rheumatoid arthritis severity. Features are ranked on the y-axis by significance, with higher-ranked features indicating greater importance. Each dot represents a patient, with its color indicating the feature value—blue for lower and red for higher values. The dot’s position on the x-axis (SHAP value) reflects the feature’s impact on the model’s output, indicating the likelihood of a clinical prediction, with higher SHAP values corresponding to a higher probability of the more severe rheumatoid arthritis.
From the waterfall plot of randomly selected patients (Figure 5), it can be seen that the order of influence of each parameter varies between different patients. The predicted value of sample 11 (Figure 5(a)) is 0.03, which is lower than the preliminary predicted value of 0.425, mainly due to the combined effect of negative contributions such as “PLT” (−0.06), “PLR” (−0.06), and “PDW” (−0.04). The predicted value of sample 1248 (Figure 5(b)) is 0.09, and the preliminary predicted value is 0.425, which is mainly affected by “PLT” (−0.05), “LYMPH%” (−0.05), “ESR” (−0.05) and the predicted value of sample 3341 (Figure 5(c)) is 0.64, and the preliminary expected value is 0.425, which is mainly driven by the positive and negative contributions of “PDW” (+0.25) and “LYMPH%” (−0.05). The predicted value of sample 4145 (Figure 5(d)) is 0.93, and the preliminary expected value is 0.425, which is mainly driven by positive contributions of “PLR” (+0.16) and “LYMP%” (+0.09). The SHAP waterfall chart analysis shows that indicators such as LYMPH%, PDW, ESR, and RBC have a significant impact on the prediction results. For further study, we use SHAP dependency diagram to analyze.

SHAP waterfall plots demonstrating feature contributions to model predictions for individual samples. Panels (a) to (d) correspond to samples with 11, 1248, 3341, and 4145 patients, respectively. Each panel displays features including LYMPH%, ESR, PDW, PLT, and others, with associated SHAP values. Red bars indicate positive SHAP values, increasing the likelihood of the predicted clinical outcome, while blue bars represent negative SHAP values, decreasing the likelihood. The x-axis shows the SHAP value (E[f(X)]), reflecting the impact of features on the prediction, with bar length indicating the magnitude of influence. The f(X) value at the top of each panel denotes the model’s predicted output for the sample, and the E[f(X)] value at the bottom represents the baseline expected output.
The influence of variables on the model’s output is shown in SHAP dependence plots (Figure 6). LYMPH% (Figure 6(a)), lower values (0.4) show negative SHAP values, suggesting a reduced likelihood of severe RA, with a transition around 0.2–0.4 where the influence shifts. PDW (Figure 6(b)) exhibits a positive contribution to severe RA likelihood, with SHAP values increasing sharply beyond 15, peaking around 20–25, indicating that higher PDW values are strongly associated with severe RA. ESR (Figure 6(c)) shows a non-linear trend: SHAP values are positive and increase with ESR up to approximately 60–80, suggesting a higher likelihood of severe RA, but plateau or slightly decline beyond 100, indicating a complex relationship with severity. RBC (Figure 6(d)) has a negative influence on severe RA likelihood, with SHAP values decreasing as RBC values rise above 4, particularly becoming strongly negative beyond 5, reflecting a protective effect of higher RBC levels. These patterns reflect key thresholds in the model’s interpretation of RA severity. Regarding the clinical significance and practical application of the selected variables, we emphasize that the final model relies on routinely available, low-cost hematological and demographic indicators (e.g., NEUT, LYMPH, Age, HGB), which are commonly assessed in clinical settings and may support severity stratification for RA in resource-limited environments. Furthermore, to improve the clinical utility of the model, we calculated additional diagnostic evaluation metrics, including Threshold, Accuracy, Sensitivity, Specificity, Precision, F1, and Brier, in both internal validation sets. In the all-variable model evaluation, the RF model achieved a F1 of 76.8% and a Brier of 14.8%. And in the evaluation restricted to the top 15 variables, it achieved a F1 of 77.5% and a Brier of 14.0% (Tables S4 and S5). These results highlight the strong predictive performance of the model and underscore its potential for future clinical integration, pending confirmation in prospective validation studies.

The SHAP dependence plot shows the effect of individual features on the prediction model’s output. Panels (a) through (d) depict features like LYMPH%, PDW, ESR, and RBC. Positive SHAP values indicate a higher probability of a clinical diagnosis. The x-axis represents the feature value, and the y-axis shows its impact on the predicted outcome. Each point corresponds to a prediction for a specific patient.
Partial dependence plots offer valuable insights into the nonlinear relationships effects within predictive models. As illustrated in Figure 6(a)–(d), the features LYMPH%, PDW, ESR, and RBC demonstrate nonlinear influences on RA severity. These four main indices were chosen for analysis due to their significant impact on the model’s prediction results. Figure 7(a)–(c) elucidates the interactions among LYMPH, NEUT%, PLT, and RBC: in Figure 7(a), the predicted probability of RA is elevated (0.48–0.50) when LYMPH is low (1.0–1.5 × 10⁹/L) and NEUT% is low (0.45–0.50), but it decreases to 0.38–0.42 when LYMPH rises to 2.0–2.5 × 10⁹/L and NEUT% exceeds 0.60; Figure7(b) shows an increased probability (0.60–0.63) with low LYMPH (1.0–1.5 × 10⁹/L) and high PLT (400–500 × 109/L), dropping to 0.36–0.42 when LYMPH is high (2.0–2.5 × 10⁹/L) and PLT is low (200–250 × 109/L); Figure 7(c) reveals a probability range of 0.57–0.63 when PLT is high (400–500 × 109/L) and NEUT% is low (0.45–0.50), decreasing to 0.36–0.39 when PLT is low (200–250 × 109/L) and NEUT% is high (0.70–0.80). Figure 7(d)–(f) further illustrates additional interaction effects: Figure 7(d) indicates a higher probability (0.64–0.68) with low LYMPH (1.0–1.5 × 10⁹/L) and high RBC (4.5–5.0 × 10¹²/L), falling to 0.36–0.40 when LYMPH is high (2.0–2.5 × 10⁹/L) and RBC is low (3.0–3.5 × 10¹²/L); Figure 7(e) demonstrates the highest probability (0.75–0.80) with high PLT (400–500 × 109/L) and high RBC (4.5–5.0 × 10¹²/L), dropping to 0.35–0.40 when both are low (200–250 × 109/L and 3.0–3.5 × 10¹²/L); Figure 7(f) shows a probability of 0.64–0.68 with low LYMPH (1.0–1.5 × 10⁹/L) and high RBC (4.5–5.0 × 10¹²/L), decreasing to 0.36–0.40 when LYMPH is high (2.0–2.5 × 10⁹/L) and RBC is low (3.0–3.5 × 10¹²/L). Collectively, the synergistic interaction between PLT and RBC, particularly at PLT levels of 400–500 × 109/L and RBC levels of 4.5–5.0 × 10¹²/L, emerges as the significant predictor of RA severity, with lower LYMPH and NEUT% levels further enhancing this effect. Consequently, monitoring and managing PLT, RBC, LYMPH, and NEUT% levels may hold critical importance for mitigating RA severity. In addition to probability-based discrimination metrics, we identified an optimal decision threshold based on the Youden index to facilitate clinical interpretation. Application of this threshold yielded high sensitivity and specificity on the internal test set, demonstrating the model’s potential utility for risk stratification in clinical settings. Detailed threshold values and associated metrics are provided in Table S2.

Synergistic effects of hematological indices on rheumatoid arthritis severity. PDPs elucidate the synergistic interactions between hematological indices and the severity of rheumatoid arthritis, encompassing (a) NEUT% and LYMPH, (b) PLT and LYMPH, (c) NEUT% and PLT, (d) NEUT% and RBC, (e) RBC and PLT, and (f) RBC and LYMPH. The color bar on the right provides an intuitive visualization of the predicted severity values for rheumatoid arthritis derived from model training. The x-axis and y-axis represent clinical data for the respective hematological indices, while the contour plots vividly illustrate the combined influence of the two indices on the predicted severity of rheumatoid arthritis.
Associations between blood cell indices and the severity of incident rheumatoid arthritis
The relationships between 10 significant blood cell indices and the severity of RA were examined using binary logistic regression model I. In the primary analysis, all indicators were significantly associated with the severity of incident RA (Table 2). Increased PDW (OR 2.17, 95% CI: 2.01–2.35, p < 0.001), PLT (OR 1.96, 95% CI: 1.81–2.13, p < 0.001), PCT (OR 1.61, 95% CI: 1.49–1.73, p < 0.001), and NEUT% (OR 1.47, 95% CI: 1.32–1.63, p < 0.001) were associated with a higher risk of severity of RA, while increased HCT (OR 0.11, 95% CI: 0.05–0.24, p < 0.001), RBC (OR 0.59, 95% CI: 0.53–0.65, p < 0.001), MPV (OR 0.70, 95% CI: 0.65–0.75, p < 0.001), LYMPH% (OR 0.54, 95% CI: 0.50–0.59, p < 0.001), LYMPH (OR 0.62, 95% CI: 0.57–0.67, p < 0.001), and MCV (OR 0.91, 95% CI: 0.84–0.97, p < 0.001) were protective against severity of RA. Sensitivity analyses confirmed that the relationship between all indicators and severity of RA remained significant in Model II (Table 2).
Associations between seven core blood count indices selected based on the SHAP feature importance plot and the severity of rheumatoid arthritis.

Model I: Adjusted for age, sex, hemoglobin concentration, mean corpuscular hemoglobin concentration, neutrophil count, monocyte count, monocyte percentage, eosinophil count, eosinophil percentage, basophil count, basophil percentage, red blood cell (erythrocyte) distribution width. Model II: Model I with additional adjustment for total cholesterol, direct bilirubin, indirect bilirubin, direct to total bilirubin ratio, total protein, albumin to globulin ratio, gamma-glutamyl transferase, total bile acids, aspartate aminotransferase, alanine aminotransferase, aspartate aminotransferase to alanine aminotransferase ratio, alkaline phosphatase, prealbumin, urea, creatinine, uric acid, bicarbonate, endogenous creatinine clearance, cystatin C, high-sensitivity troponin, creatine kinase, creatine kinase isoenzyme, alpha-hydroxybutyrate dehydrogenase, random blood glucose, and erythrocyte sedimentation rate.
CI, confidence interval; HCT, hematocrit percentage; LYMPH, lymphocyte count; LYMPH%, lymphocyte percentage; MCV, mean corpuscular volume; MPV, mean platelet volume; NEUT%, neutrophil percentage; OR, odds ratio; PCT, platelet crit; PDW, platelet distribution width; PLT, platelet count; RBC, red blood cell count; SHAP, Shapley Additive Explanations; Bold values indicate statistical significance (p < 0.05).
Using restricted cubic spline, we found that PDW, LYMPH%, HCT, PCT, RBC, LYMPH, MPV, and MCV blood cell indicators had significant nonlinear relationships with the severity of RA (p < 0.05), consisting of J-shape, inversion of a J-shape, and U-shape curve associations, but NEUT% and PLT had linear relationships with the severity of RA (Figure 8). The results from binary logistic regression and restricted cubic splines (RCS) align with the SHAP interpretability outcomes of the machine learning model, particularly in terms of feature importance, directionality, and nonlinear patterns, with key indicators such as LYMPH%, LYMPH, PDW, and PLT showing consistent trends. While logistic regression and RCS cannot directly validate SHAP results, their similar patterns provide corroborative evidence and complement the machine learning approach, fostering a more comprehensive understanding of data relationships. This integration enhances model interpretability and offers practical utility for stratification of RA severity, especially in resource-constrained clinical settings.
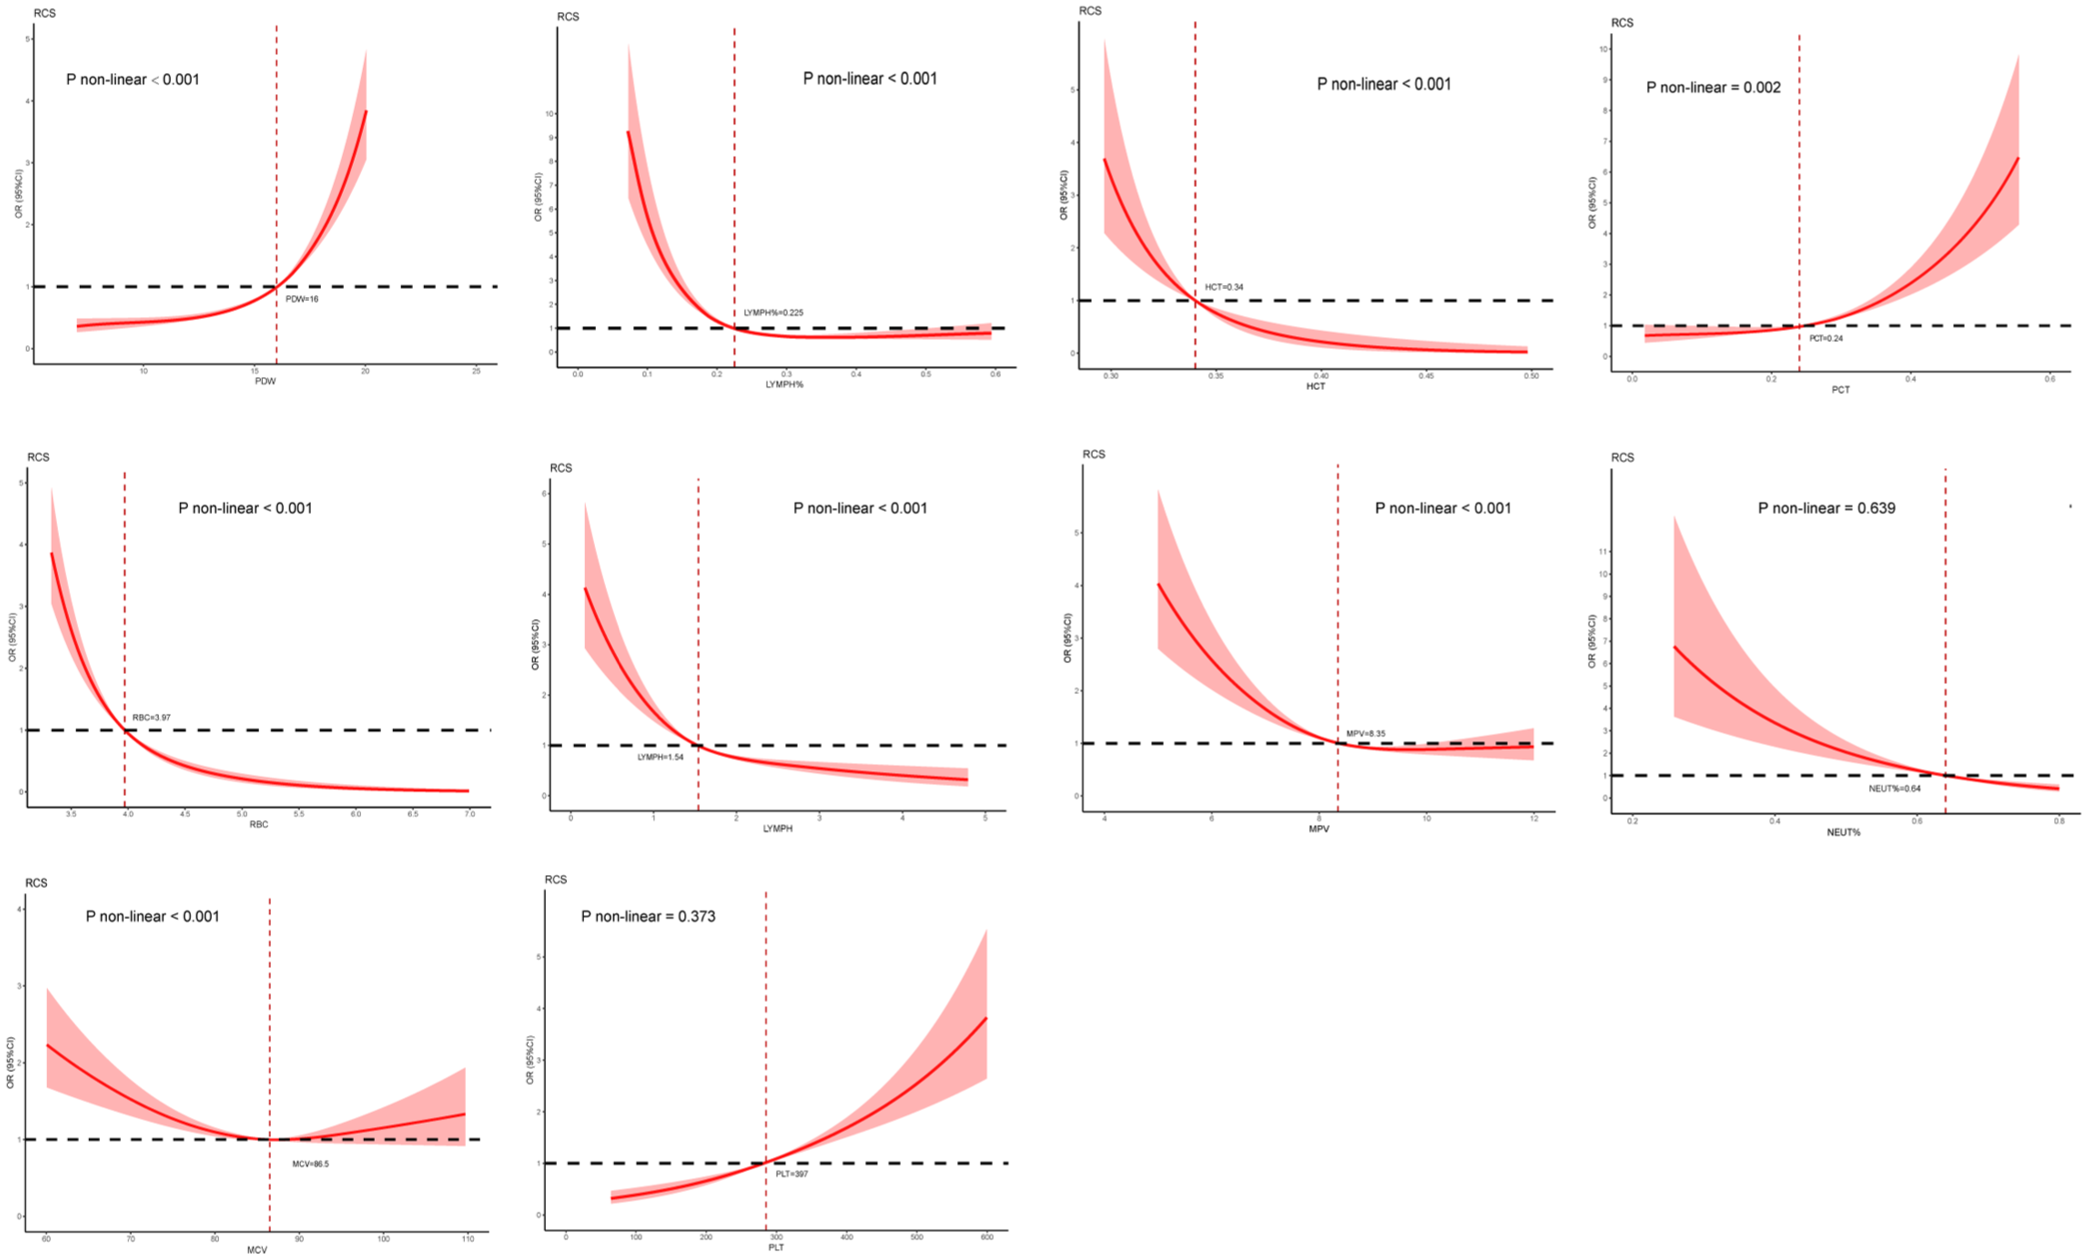
Nonlinear associations of hematological indices with rheumatoid arthritis severity fitted by logistic regression. Panels present RCS plots for MPV, RBC, MCV, PLT, LYMPH, LYMPH%, HCT, PDW, NEUT%, and PCT, with p-values indicating the significance of nonlinearity (p < 0.05). Red dashed lines represent the fitted curves, black dashed lines denote reference levels, and shaded areas indicate 95% confidence intervals. The x-axes display values of the hematological indices, while the y-axes represent the probability of severity.
Causal associations between blood cell indices with RA risk
MR analysis revealed causal associations between 10 blood cell indices and RA risk, as detailed in Table S8. Protective effects were observed for MCV (OR = 0.90, p < 0.0001 for both IVW-FE and IVW-RE), MPV (OR = 0.94, p = 0.0020 IVW-FE; p = 0.0195 IVW-RE), NEUT% (OR = 0.81, p < 0.0001 IVW-FE; p = 0.0136 IVW-RE), as well as slight protection from LYMPH, LYMP%, and PDW (OR = 0.90–0.94, p < 0.05 IVW-FE), though high heterogeneity and non-significant IVW-RE results suggest weak evidence requiring additional SNPs to address variability; PCT also showed potential risk reduction (weighted median OR = 0.84, p = 0.0384) but with limited support. Conversely, risk-increasing effects were linked to HCT (OR = 1.20, p = 0.0005 IVW-FE; p = 0.0361 IVW-RE), RBC (OR = 1.12, p < 0.0001 IVW-FE; p = 0.0098 IVW-RE), and PLT (OR = 1.08, p = 0.0010 IVW-FE; p = 0.0398 IVW-RE). These findings partially align with machine learning, binary logistic regression, and RCS analyses of RA severity, demonstrating consistent protective roles for MCV, PLT, LYMPH, and LYMPH%, yet directional discrepancies in HCT, RBC, and PDW underscore distinct pathological mechanisms between RA risk and severity. SHAP and RCS analyses further highlighted nonlinear effects across index ranges, complementing the linear MR estimates. All instruments exhibited F-statistics >10 for validity, with Cochran’s Q tests indicating no overall heterogeneity except localized elevations in LYMPH, LYMP%, and PDW; MR-Egger intercept and MR-PRESSO analyses confirmed the absence of horizontal pleiotropy, supporting the robustness of these causal inferences.
Discussion
RA is a chronic, progressive, immune-mediated inflammatory disease that primarily affects synovial joints, causing bone erosion and significant disability.41,42 Accurate assessment of disease severity remains challenging, as it typically requires composite indices, laboratory biomarkers, and imaging evaluations, which are costly and not always available in resource-limited settings.43,44 In this context, peripheral blood indices, which are inexpensive, widely accessible, and routinely measured, represent promising tools for evaluating RA severity.
Existing studies have established associations between hematological markers, such as NLR and RDW, and RA activity.45,46 However, these investigations often focus on isolated markers or acute-phase reactants like CRP and ESR, lacking comprehensive integration of blood cell indices for severity prediction. Moreover, causal relationships and nonlinear associations remain underexplored, limiting their clinical utility. Building on these insights, our study employed ML, SHAP, binary logistic regression, RCS, and MR to elucidate the role of blood cell indices in RA progression.
Our retrospective case–control analysis of 4401 RA patients identified significant associations between 10 key blood cell indices (e.g., LYMPH%, PDW, MCV) and RA severity. Binary logistic regression revealed that elevated PDW, PLT, and NEUT% were associated with higher severity, while HCT, RBC, and MCV were protective. RCS analyses confirmed nonlinear relationships, such as J-shaped or U-shaped curves for PDW and LYMPH%. The optimized RF model, using 15 selected features, achieved an AUC of 0.874 on the test set, with robust metrics including F1 (77.5%) and Brier (14.0%). SHAP analyses highlighted LYMPH% and PDW as top contributors, revealing patient-specific and synergistic effects.
Notably, MR analysis indicated that genetically higher HCT (OR = 1.20, p < 0.001) and RBC (OR = 1.12, p < 0.001) increased RA risk, contrasting with their protective role in severity models. This directional discrepancy likely stems from differing contexts: MR captures lifelong susceptibility, whereas severity models reflect baseline associations in established RA, where anemia of chronic inflammation reduces HCT and RBC in severe cases.47,48 These findings underscore distinct mechanisms between RA onset and progression.
The observed associations may involve immunological and inflammatory pathways. Elevated NEUT% could exacerbate severity through proinflammatory cytokines (e.g., IL-6, TNF-α), while higher LYMPH% may promote immune balance. Platelet indices like PDW and PLT contribute to synovial inflammation via cytokine release, 49 and red cell parameters influence tissue oxygenation. 50 These align with prior evidence linking hematological indices to RA activity.
Clinically, abnormalities in indices such as elevated PDW or reduced LYMPH% could serve as cost-effective markers for RA severity stratification. Integrated with clinical symptoms and biomarkers (e.g., ESR, CRP), they may guide tailored treatments, optimizing resource allocation in constrained settings. Future prospective studies should validate these markers across diverse populations, incorporating disease controls for specificity.
A limitation of this study is the potential construct overlap between predictors (e.g., ESR, CRP, and blood cell ratios) and the outcome measures (DAS28-ESR and CDAI), which may introduce same-source bias. While our analyses suggest that the main results are robust, future studies should exclude inflammation-based indices from predictor sets or employ alternative severity definitions to further minimize bias. Another limitation of this study is the lack of RA-specific serological biomarkers, such as rheumatoid factor and anti-CCP, as well as standardized composite indices (e.g., SDAI). These markers are widely used in clinical practice and are important for diagnosis and prognosis in RA. Their absence may limit the generalizability of our findings and the direct applicability of our models to clinical decision-making. Future studies incorporating these RA-specific biomarkers are warranted to further validate and enhance the predictive value of blood cell indices. A potential limitation of this study is treatment confounding. Therapeutic interventions such as conventional synthetic DMARDs, biologic DMARDs, targeted synthetic DMARDs, and surgery can affect hematological indices and are also related to disease severity. Although we minimized this issue by defining severity solely on DAS28-ESR and CDAI, residual confounding by treatment cannot be completely excluded. Future prospective studies should explicitly model treatment variables to further disentangle their effects. In addition, the single-center and retrospective nature of this study inherently limits the external generalizability of our findings. All patients were recruited from a single tertiary hospital, and the demographic as well as clinical characteristics may not fully represent the broader RA population in other geographic regions or healthcare systems. Moreover, although the machine learning models demonstrated excellent internal performance, their predictive ability may not directly translate to other institutions with different patient profiles, laboratory platforms, or clinical practice patterns. Future work will therefore include external validation in multicenter cohorts, prospective data collection, and model recalibration to improve robustness and applicability across diverse clinical settings.
Conclusion
This study developed and internally validated a prediction model for RA severity. Interpretable machine learning techniques were used to reveal important associations between key factors and RA severity, and the final model showed strong predictive accuracy. In addition, this population-based retrospective study explored the association between blood cell indices and RA severity, providing new insights into the molecular mechanisms behind RA disease severity stratification.
Supplemental Material
sj-doc-2-tab-10.1177_1759720X251407065 – Supplemental material for Associations of blood cell indices with the severity of rheumatoid arthritis: a retrospective case–control and machine learning modeling study
Supplemental material, sj-doc-2-tab-10.1177_1759720X251407065 for Associations of blood cell indices with the severity of rheumatoid arthritis: a retrospective case–control and machine learning modeling study by Rongqing He, Boli Qin, Xiaopeng Qin, Jiarui Chen, Jiang Xue, Tianyou Chen, Songze Wu, Zhuo Chen, Xinli Zhan and Chong Liu in Therapeutic Advances in Musculoskeletal Disease
Supplemental Material
sj-docx-3-tab-10.1177_1759720X251407065 – Supplemental material for Associations of blood cell indices with the severity of rheumatoid arthritis: a retrospective case–control and machine learning modeling study
Supplemental material, sj-docx-3-tab-10.1177_1759720X251407065 for Associations of blood cell indices with the severity of rheumatoid arthritis: a retrospective case–control and machine learning modeling study by Rongqing He, Boli Qin, Xiaopeng Qin, Jiarui Chen, Jiang Xue, Tianyou Chen, Songze Wu, Zhuo Chen, Xinli Zhan and Chong Liu in Therapeutic Advances in Musculoskeletal Disease
Supplemental Material
sj-docx-4-tab-10.1177_1759720X251407065 – Supplemental material for Associations of blood cell indices with the severity of rheumatoid arthritis: a retrospective case–control and machine learning modeling study
Supplemental material, sj-docx-4-tab-10.1177_1759720X251407065 for Associations of blood cell indices with the severity of rheumatoid arthritis: a retrospective case–control and machine learning modeling study by Rongqing He, Boli Qin, Xiaopeng Qin, Jiarui Chen, Jiang Xue, Tianyou Chen, Songze Wu, Zhuo Chen, Xinli Zhan and Chong Liu in Therapeutic Advances in Musculoskeletal Disease
Research Data
sj-xlsx-1-tab-10.1177_1759720X251407065 – for Associations of blood cell indices with the severity of rheumatoid arthritis: a retrospective case–control and machine learning modeling study
sj-xlsx-1-tab-10.1177_1759720X251407065 for Associations of blood cell indices with the severity of rheumatoid arthritis: a retrospective case–control and machine learning modeling study by Rongqing He, Boli Qin, Xiaopeng Qin, Jiarui Chen, Jiang Xue, Tianyou Chen, Songze Wu, Zhuo Chen, Xinli Zhan and Chong Liu in Therapeutic Advances in Musculoskeletal Disease
Footnotes
Acknowledgements
We are very grateful to Prof. Chong Liu and Prof. Xinli Zhan (Spine and Osteopathy Ward, The First Affiliated Hospital of Guangxi Medical University) for support in all stages of this study.
Declarations
Supplemental material
Supplemental Material for this article is available online.
References
Supplementary Material
Please find the following supplemental material available below.
For Open Access articles published under a Creative Commons License, all supplemental material carries the same license as the article it is associated with.
For non-Open Access articles published, all supplemental material carries a non-exclusive license, and permission requests for re-use of supplemental material or any part of supplemental material shall be sent directly to the copyright owner as specified in the copyright notice associated with the article.