
Abstract
Objectives:
To develop a tool which can evaluate the severity of the joint injury in individuals with gout and asymptomatic hyperuricaemia.
Methods:
This retrospective study included 616 male patients: 245 with asymptomatic hyperuricaemia and 371 with intercritical gout. All patients underwent ultrasonography of the knee, ankle and first metatarsophalangeal (MTP) joints. Ultrasound features that were significantly different between groups were entered into a binary logistic regression analysis to identify discriminative factors. The ultrasound signs were scored based on their odds ratios, which were then used to evaluate the severity of gout and asymptomatic hyperuricaemia. The performance of the ultrasound score was validated in an additional population including 163 patients with asymptomatic hyperuricaemia and 196 patients with gout.
Results:
Ultrasound signs were scored as follows: knee joint: synovial effusion, 2 points, tophus, 5 points; ankle joint: synovial effusion, 2 points, synovial hypertrophy, 5 points, tophus, 3 points, bone erosion, 7 points; and first MTP joint: double contour sign, 2 points, synovial hypertrophy, 3 points, tophus, 9 points, bone erosion, 4 points. The maximum possible total score was 42. The optimal cut-off score for gout was 6.5. The sensitivity, specificity and area under the receiver operating characteristic curve (AUC) were 86.9%, 75.2% and 0.878, respectively. The patients were stratified according to their ultrasound score (range 0–42). The prevalence of intercritical gout, tophi, and bone erosion increased with the increase of the score. In the validation population, 83.20% of 193 patients with gout had ultrasound scores above 6.5; 76.10% of 163 patients with asymptomatic hyperuricaemia had ultrasound scores under 6.5.
Conclusion:
The scoring system based on the differential ultrasound signs can effectively evaluate the severity of joint injury in individuals with gout and asymptomatic hyperuricaemia.
Introduction
Hyperuricaemia, defined as a serum urate (SUA) level greater than 7.0 mg/dL, is a well-known cause of gout. SUA levels are also associated with all-cause and cardiovascular mortality, independent of other cardiovascular risk factors or validated score risk algorithm. 1 Although hyperuricaemia is a prerequisite for the development of gout, many individuals with hyperuricaemia are clinically asymptomatic, with 5–18.83% estimated to develop gout later.2,3
Although gout is the most common inflammatory arthritis, it is still frequently misdiagnosed, especially in patients with atypical clinical features whose arthritis does not manifest acutely in a single joint, but appears gradually in several joints. For patients with atypical clinical features, it is recommended to use conventional and/or advanced imaging techniques to help the physician diagnose gout. Ultrasound scanning is recommended to be used in patients with suspected gout in the 2018 updated European League against Rheumatism (EULAR) evidence-based recommendations for the diagnosis of gout. 4
The deposition of monosodium urate (MSU) crystals in the musculoskeletal system is the basis of gout attacks. 5 The progression of MSU deposition evolves through several stages: asymptomatic MSU crystal deposition during which people have MSU crystal deposition in the absence of gout; gout defined by MSU crystal deposition and clinical disease elements such as gout flare, chronic gouty arthritis and tophi. 4 MSU crystals which are detected by dual-energy computed tomography (DECT) or ultrasound are significantly more prevalent in patients with intercritical gout than in those with asymptomatic hyperuricaemia. 6
Tophi are collections of MSU crystals surrounded by chronic inflammatory cells. 7 Tophus infiltration into bone has been strongly implicated in the development of bone erosion in gout, 8 which can in turn lead to joint damage, deformity and eventually musculoskeletal disability.9,10 Thus, tophus and bone erosion are important indicators of gout severity. Understanding the severity of gout is of great importance for the determination of the treatment intensity; however, there are no quantitative indicators used in practice to reflect the severity of gout.
Thus, the purpose of this study was to develop a tool which can evaluate the severity of the injury in individuals with gout and asymptomatic hyperuricaemia. We reviewed ultrasound features in patients with intercritical gout and in those with asymptomatic hyperuricaemia, and used the differences therein to develop a scoring system to evaluate the severity of the disease.
Patients and methods
Participants
This was a retrospective cohort study. All patients were consecutively observed from the outpatient clinic of endocrinology in Shanghai Jiao Tong University Affiliated Sixth People’s Hospital from April 2015 to September 2018. Everyone underwent an ultrasound examination of the knees, ankles and the first metatarsophalangeal (MTP) joints by an ultrasonologist ‘blinded’ to the clinical history. Asymptomatic hyperuricaemia was defined as >7.0 mg/dl of SUA and no history of gout according to the 2015 American College of Rheumatology (ACR)/EULAR diagnostic criteria. Intercritical gout was defined as a history of gout based on the 2015 ACR/EULAR diagnostic criteria, disease duration greater than 5 years, and no gout acute attack in at least 1 month. The patients taking any drug that might influence urate metabolism, such as losartan, benzbromarone, allopurinol, febuxostat and non-potassium-sparing diuretics, or without complete clinical data were also excluded. Ultimately, 616 male patients were included in the development cohort.
The ultrasound score was validated externally in an additional study: a cross-sectional cohort recruited from January to December in 2019. A total of 359 patients were enrolled for validation, including 163 patients with asymptomatic hyperuricaemia and 196 patients with gout, following the original inclusion/exclusion criteria.
This study was approved by the ethics committees of Shanghai Jiao Tong University Affiliated Sixth People’s Hospital (approval number: 2017-137-(1) ), and written informed consent was obtained from all subjects.
Clinical and laboratory assessments
Every patient had completed a uniform questionnaire at enrollment, including age, sex, disease duration, comorbidities, medications, current and previous illnesses, flare frequency. The physical examinations including height, weight, waist circumference, hip circumference, and blood pressure were performed according to standard protocols. The body mass index (BMI) was calculated as weight in kilograms divided by the height in meters squared. Venous blood samples were collected in the morning after an overnight fast to measure fasting plasma glucose (FBG), alanine aminotransferase (ALT), serum creatinine (SCr), SUA, blood urea nitrogen (BUN), cystatin C (CYC), C-reactive protein (CRP), erythrocyte sedimentation rate (ESR), glycosylated hemoglobin A1C (HbA1C) and lipid profiles. All subjects underwent standard clinical and laboratory evaluations.
Ultrasound image interpretation
The ultrasound examinations were performed by one of two trained musculoskeletal sonographers (JLX and CJ, who had 20 and 10 years of experience in ultrasonic examinations, respectively) using an Applio 500 ultrasound machine (Toshiba Medical Systems, Tokyo, Japan) which was equipped with a multifrequency linear transducer (12–14 MHz). The ultrasound examinations were performed in periarticular structures and soft tissues of the knees, ankles and the first MTP joints for five ultrasound features: double contour sign, synovial hypertrophy, synovial effusion, tophi, bone erosion. The double contour sign was recognized when hyperechoic irregular enhancement of the superficial margin of hyaline cartilage that is independent of the insonation angle of the ultrasound beam appeared. Synovial fluid was defined as the presence of anechoic or hypoechoic joint cavity widening. Synovial hypertrophy was recorded as the presence of abnormal hypoechoic or hyperechoic tissue within the joint cavity. Erosion was defined as a cortical interruption with a stepdown contour defect in both longitudinal and transverse views. Heterogeneous hyperechoic aggregates with poorly defined margins with or without areas with acoustic shadowing defined the presence of tophi (Figure 1).

The ultrasound features of gout. A. Synovial effusion of suprapatellar bursa in knee joint. B. Synovial hypertrophy in first metatarsophalangeal (MTP) joint. C. Double contour sign in knee joint. D. Tophi in second MTP joint. E. and F. Bone erosion in first MTP joint. According to the standard, bone destruction should be seen in both vertical sections.
Ultrasound intra-observer reliability has been evaluated. The sonographer collected 60 ultrasound images containing anatomical locations about knee, ankle and MTP joints from patients with asymptomatic hyperuricaemia and 100 ultrasound images containing the same locations from individuals with intercritical gout. These images were randomly tested twice and each image was evaluated at a 1-month interval.
Intraobserver reliability was assessed by the Kappa consistency test. The consistency was good when Kappa ⩾0.75, medium when Kappa <0.75 and ⩾0.4, poor when Kappa <0.4.
Statistical analysis
SPSS 23.0 for Windows was used for statistical analysis, with two sided p-values calculated, where a p-value of <0.05 was considered statistically significant. Quantitative variables are expressed as mean ± standard deviation, percentages or medians (interquartile range 25–75%) for skewed variables. Independent sample t test was applied to compare normally distributed continuous variables, Mann–Whitney U test was applied to compare abnormally distributed continuous variables and the chi-square test was used to compare frequencies.
To select the best combinations of ultrasound abnormalities, we used the following analysis. First, the chi-square test was used to find ultrasound features that were significantly different between groups (variable with significant difference, p < 0.05); second, ultrasound features that were significantly different between groups were entered into a binary logistic regression analysis to identify discriminative factors. The ultrasound signs were scored based on their odds ratios (ORs), which were then used to evaluate the severity of gout and asymptomatic hyperuricaemia; then, individual patient scores were used to calculate c-statistics, Hosmer–Lemeshow test, accuracy evaluation, and calculate the area under the receiver operating characteristic curve (AUC) to evaluate the utility of the ultrasound-based scoring system. The results of the analysis were further validated using an independent population.
Results
Patient clinical characteristics
The clinical characteristics of the patients are shown in Table 1. The study included 616 male patients with an average age of 50 years. The patients with intercritical gout were more likely to be older, have smoking and drinking habits, higher blood pressure levels, a larger waist circumference, higher serum triglyceride levels and total cholesterol, lower kidney function (higher BUN, SCr and cyclophosphamide levels), worse liver function (higher ALT) and a faster ESR than those with asymptomatic hyperuricaemia. The clinical characteristics of the validation population are summarized in Supplemental Table 1.
Comparison of clinical characteristics between asymptomatic hyperuricaemia patients and intermittent gout patients.

Values are expressed as percentages (n %), mean ± standard deviation, or median with interquartile range.
The Mann–Whitney U-test was applied.
The Pearson chi-square test was applied.
ALT, alanine aminotransferase; BMI, body mass index; BUN, blood urea nitrogen; CH, total cholesterol; CRP, C-reactive protein; CyC, cystatin C; DBP, diastolic blood pressure; DM, diabetes mellitus; ESR, erythrocyte sedimentation rate; FINS, fasting insulin level; FPG, fasting plasma glucose; Hb, hemoglobin; HbA1C, glycosylated hemoglobin; HDL, high density lipoprotein; LDL, low density lipoprotein; RBP, retinol binding protein; SBP, systolic blood pressure; SCr, serum creatinine; SUA, serum uric acid; TG, triglyceride; UUAE, urinary uric acid excretion rate; WHR, waist–hip ratio.
Ultrasound findings
The ultrasound findings for the intercritical gout and asymptomatic hyperuricaemia groups are shown in Table 2. Double contour sign (DCS) which is demonstrated two parallel hyperechoic contours on either side of the hypoechoic hyaline cartilage represents uric acid crystals accumulating on the surface of the hypoechoic hyaline cartilage. Compared with the asymptomatic hyperuricaemia group, the patients with intercritical gout had significantly higher incidence rates of DCS (47.7% versus 28.2%), synovial effusion (55.8% versus 34.3%), synovial hypertrophy (10.0% versus 2.9%), tophus (26.7% versus 1.6%), and bone erosion (2.4% versus 2.0%) in the knee joint; of DCS (42.6% versus 19.2%), synovial effusion (40.7% versus 20.4%), synovial hypertrophy (16.7% versus 1.6%), tophus (25.6% versus 3.3%) and bone erosion (21.6% versus 0.8%) in the ankle joint; and DCS (52.3% versus 27.3%), synovial hypertrophy (56.3% versus 30.6%), tophus (36.4% versus 2.4%) and bone erosion (43.9% versus 5.7%) in the first MTP joint. There was no significant difference in synovial effusion of the first MTP joint between the asymptomatic hyperuricaemia group (n = 162, 66.1%) and the intercritical gout group (n = 207, 56.1%) (p = 0.062).
Comparison of ultrasound findings between asymptomatic hyperuricaemia patients and intermittent gout patients.

Values are expressed as percentages (n %).
The Pearson chi-square test was applied.
MTP, metatarsophalangeal.
Generation of ultrasound score
In order to explore an ultrasound score model that could effectively evaluate the severity of joint injury in individuals with gout and asymptomatic hyperuricaemia, those features which were significantly different between groups (p < 0.05; Table 2) were entered into a binomial regression analysis. It revealed that synovial effusion (OR 1.5; p < 0.05), and tophus (OR 5.4; p < 0.05) in the knee joint; synovial effusion (OR 2.1; p < 0.05), synovial hypertrophy (OR 4.9; p < 0.05), tophus (OR 2.8; p < 0.05) and bone erosion (OR 7.3; p < 0.05) in the ankle joint; and DCS (OR 1.8; p < 0.05), synovial hypertrophy (OR 3.0; p < 0.05), tophus (OR 8.7; p < 0.05) and bone erosion (OR 4.0; p < 0.05) in the first MTP joint were positively associated with gout (Table 3).
Binary logistic regression of factors associated with intermittent gout.

CI, confidence interval; MTP, metatarsophalangeal; OR, odds ratio.
The scores assigned to each factor were based on their ORs (Table 3), as follows: knee joint: synovial effusion, 2 points, tophus, 5 points; ankle joint: synovial effusion, 2 points, synovial hypertrophy, 5 points, tophus, 3 points, bone erosion, 7 points; and first MTP joint: double contour sign, 2 points, synovial hypertrophy, 3 points, tophus, 9 points, bone erosion, 4 points. Thus, the maximum possible total score was 42. According to the Youden index, the optimal discriminative threshold score for intercritical gout was 6.5. The sensitivity was 86.9%, specificity was 75.2%, positive predictive value was 75.3%, negative predictive value was 87.6%; the area under the receiver operating characteristic curve (AUC) was 0.878 (Figure 2).
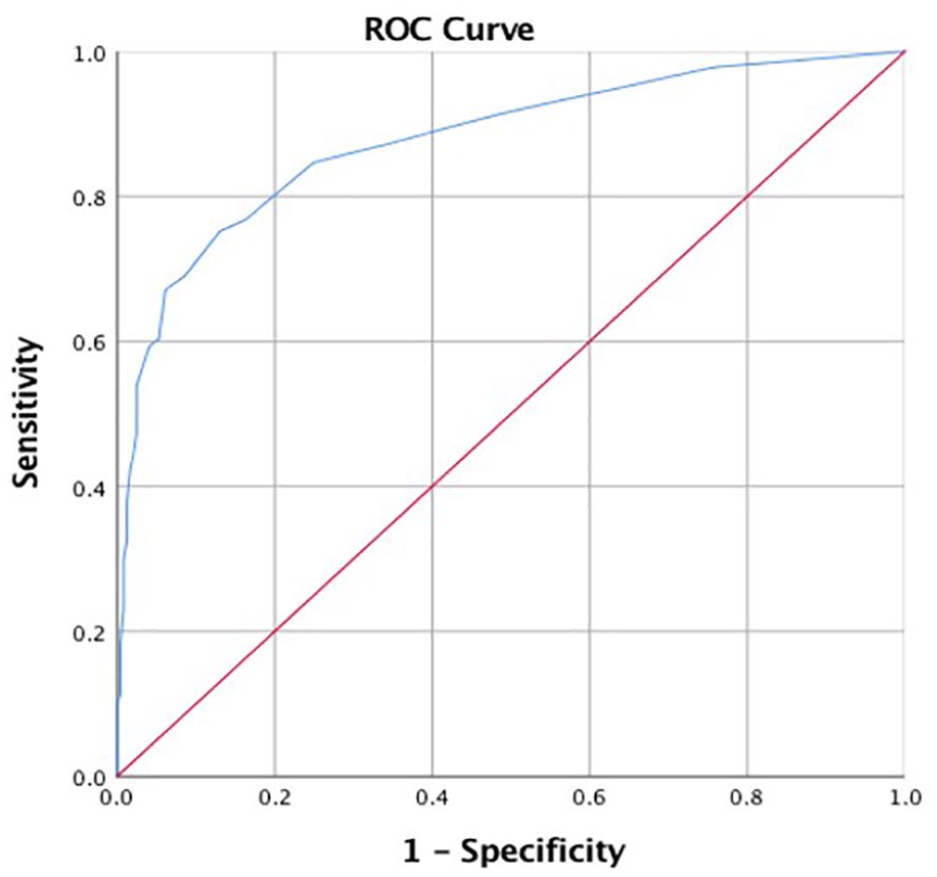
The receiver operating characteristic (ROC) curve of intermittent gout diagnosed by high frequency ultrasound. By analyzing the ROC curve, the area under curve was 0.878, the sensitivity was 86.9%, the specificity was 75.2%, the positive predict value was 75.3%, the negative predict value was 87.6%, and the cut-off value was 6.5.
Furthermore, the patients were stratified at 6.5, 13, and 26 of their ultrasound score. As shown in Figure 3A, the prevalence of intercritical gout was 30.0%, 78.4%, 96.6% and 100%, respectively. The rate of intercritical gout was 100% in patients with an ultrasound score more than 26. As shown in Figure 3B, the prevalence of bone erosion was 2.0%, 49.6%, 74.5% and 100.0%, respectively. That means the proportion of bone erosion increases as the ultrasound score rises. As shown in Figure 3C, the prevalence of tophi was 3.0%, 23.2%, 74.5% and 100.0%, respectively. That means the proportion of tophi increases as the ultrasound score rises.

The range of the ultrasound score in all patients was between 0 and 42. The patients were stratified at 6.5, 13, and 26 of their ultrasound score. A. The prevalence of intercritical gout was 30.0%, 78.4%, 96.6% and 100%, respectively. B. The prevalence of bone erosion was 2.0%, 49.6%, 74.5% and 100.0%, respectively. C. The prevalence of tophi was 3.0%, 23.2%, 74.5% and 100.0%, respectively.
Validation of ultrasound score
By analyzing the receiver operating characteristic (ROC) curve, the area under curve was 0.851, the sensitivity was 79.3%, the specificity was 77.5%, the positive predict value was 81.1%, the negative predict value was 75.5%, and the cut-off value was 6.5. As shown in Table 4, 83.20% of 193 patients with gout had ultrasound scores above 6.5; 76.10% of 163 patients with asymptomatic hyperuricaemia had ultrasound scores under 6.5.
The specificity of the ultrasound scoring system.

Discussion
In this study we describe a scoring system based on 10 independent ultrasound features and show that a higher score confers a significantly increased severity of the joint injury. The performance of the ultrasound score is adequate for evaluating the severity of the joint injury in individuals with gout and asymptomatic hyperuricaemia.
Although individuals with asymptomatic hyperuricaemia do not have clinical symptoms of acute arthritis, some structural changes in joints can be seen on ultrasound. Previous studies have confirmed that asymptomatic hyperuricaemia and gout may share the same ultrasonic appearance but have different degrees of severity.11–14 For example, the DCS was present in both patients with asymptomatic hyperuricaemia and gout; however, its prevalence was markedly higher in patients with intercritical gout. Our analysis of five different ultrasound features in the first MTP, ankle and knee joints revealed that all of the features, except synovial effusion in the first MTP joint, were significantly more prevalent in patients with intercritical gout than in those with asymptomatic hyperuricaemia. Similar results can also be found in a DECT study. Dalbeth et al. 6 reported that although urate deposition was observed in individuals with asymptomatic hyperuricaemia, the deposits occurred more frequently, and in higher volumes, in patients with gout.
According to all these results in imaging, EULAR suggested that hyperuricaemia/gout is a continuous and chronic pathophysiological process and updated their recommendations for the diagnosis of gout. 4 In this recommendation, it is suggested that patients with atypical clinical features should be investigated by imaging to search for MSU crystal deposition and features of any alternative diagnosis. In our study, the scoring system based on 10 key ultrasound features which were selected according to binary regression analysis was designed to find the cut-off point for gout and evaluate the severity of disease.
The optimal differentiated cut-off score of gout was 6.5, according to the Youden index. The prevalence of intercritical gout increased as the ultrasound score increased.
The prevalence of tophus and bone erosion which is the indicator of the severity of gout is relatively high in gout, which is around 41.5% and 44.0%, respectively, in ultrasound scanning. 15 In our study, the proportion of tophus and bone erosion increases as the ultrasound score rises, meaning that the score indicates the severity of gout. As far as we know, this is the first quantitative indicator for gout severity. Another similar study observed the relationship between the cardiovascular MSU deposits detected by DECT and coronary calcium score in patients with gout and controls. It was found that MSU deposits were associated with a higher coronary calcium score 16 and it may be speculated that our ultrasound score, mainly derived from the ultrasound features of MSU deposits, might also be associated with the severity of cardiovascular deposits in gout patients.
Our study had some limitations. Firstly, we did not use a polarization microscope for detecting MSU crystals in the synovial fluid, 17 which is the gold standard for diagnosing gout. However, we overcame this limitation by using the inclusion criteria of clinical signs and disease duration of more than 5 years to diagnose intercritical gout. Secondly, there is a paucity of information describing musculoskeletal ultrasound findings among people with normal serum urate levels. Thirdly, our study sample was relatively small, so the ultrasound-based scoring system should be validated in future prospective studies.
Conclusions
The scoring system based on the differential ultrasound signs can effectively evaluate the severity of diseases. Furthermore, our system may be useful for the development of individualized strategies for preventing, treating and managing gout in patients with similar SUA levels.
Supplemental Material
sj-pdf-1-tab-10.1177_1759720X211006985 – Supplemental material for Musculoskeletal ultrasound features-based scoring system can evaluate the severity of gout and asymptomatic hyperuricaemia
Supplemental material, sj-pdf-1-tab-10.1177_1759720X211006985 for Musculoskeletal ultrasound features-based scoring system can evaluate the severity of gout and asymptomatic hyperuricaemia by Fengjing Liu, Si Chen, Zhumeng Hu, Jie Chen, Lixin Jiang, Shen Qu and Haibing Chen in Therapeutic Advances in Musculoskeletal Disease
Footnotes
Author’s note
Conflict of interest statement
The authors declare that there is no conflict of interest.
Funding
The authors disclosed receipt of the following financial support for the research, authorship, and/or publication of this article: This work was supported by the National Key R&D Program of China, Synthetic Biology Research (grant number 2019YFA0904500) and the National Natural Science Foundation of China (grant numbers 81670737 and 81870616) to Haibing Chen. The funders had no influence on the study design, data collection and analysis, or preparation of the manuscript.
Supplemental material
Supplemental material for this article is available online.
References
Supplementary Material
Please find the following supplemental material available below.
For Open Access articles published under a Creative Commons License, all supplemental material carries the same license as the article it is associated with.
For non-Open Access articles published, all supplemental material carries a non-exclusive license, and permission requests for re-use of supplemental material or any part of supplemental material shall be sent directly to the copyright owner as specified in the copyright notice associated with the article.