
Abstract
Background:
We conducted an exploratory analysis of osteoarthritis progression among medication users in the Osteoarthritis Initiative to identify interventions or pathways that may be associated with disease modification and therefore of interest for future clinical trials.
Methods:
We used participants from the Osteoarthritis Initiative with annual medication inventory data between the baseline and 36-month follow-up visit (n = 2938). Consistent medication users were defined for each medication classification as a participant reporting at all four annual visits that they were regularly using an oral prescription medication at the time of the visit. The exploratory analysis focused on medication classes with 40 or more users. The primary outcome measures were medial tibiofemoral joint space width change and the Western Ontario and McMaster Universities Arthritis Index (WOMAC) knee pain score change (12–36-month visits). Within each knee, we explored eight comparisons between users and matched or unmatched nonusers (defined two ways). An effect size of each comparison was calculated. Medication classes had potential signals if (a) both knees had less progression among users compared with nonusers, or (b) there was less progression based on structure and symptoms in one knee.
Results:
We screened 28 medication classes. Six medication classes had signals for fewer structural changes and better knee pain changes: alpha-adrenergic blockers, antilipemic (excluding statins and fibric acid), anticoagulants, selective serotonin reuptake inhibitors, antihistamines, and antineoplastic agents. Four medication classes had signals for structural changes alone: anti-estrogen (median effect size = 0.28; range = −0.41–0.64), angiotensin-converting enzyme inhibitors (median effect size = 0.13; range = −0.08–0.28), beta-adrenergic blockers (median effect size = 0.09; range = 0.01–0.30), and thyroid agents (median effect size = 0.04; range = −0.05–0.14). Thiazide diuretics had evidence for symptom modification (median effect size = −0.12; range = −0.24–0.04).
Conclusions:
Users of neurovascular, antilipemic, or hormonal interventions may have less disease progression compared with nonusers.
Keywords
Introduction
Despite a strong history of animal studies and human clinical trials there has been limited success in developing disease-modifying interventions for knee osteoarthritis. Traditional approaches to identifying candidate disease-modifying interventions have included basic science research and/or epidemiology studies. Among epidemiology studies, a candidate intervention may be identified by assessing group differences between cases and controls, or evaluating disease incidence and progression among individuals with different exposures (e.g. users of a specific medication versus nonusers). It may be beneficial to expand these analyses by evaluating numerous medications in large cohort studies to find potential target medications or biologic pathways.
Large cohort studies, like the Osteoarthritis Initiative (OAI), provide an opportunity to evaluate multiple medications as well as various clinical measures. The OAI is a multi-center epidemiologic study of knee osteoarthritis that collected longitudinal clinical and imaging data over a 9-year period. Within the OAI, it is possible to assess disease progression (structural and symptomatic) among users and nonusers of specific medications. Furthermore, the large cohort provides sufficient sample sizes to compare disease progression among users and nonusers as defined by numerous medications. A novel approach to identifying interventions or biologic pathways that could be of interest for future research may be to analyze a large number of medications to detect signals of medications or biologic pathways. Potential signals in large cohort studies may be detected if: (a) multiple joints (e.g. right and left knee) have less progression among medication users compared with nonusers (rationale: independently assessed joints within a participant taking a systemic intervention should show similar/correlated findings across multiple joints); (b) the findings are replicated in repeated comparisons (rationale: findings should be robust when the sample of nonusers is changed); (c) multiple independently acquired outcome measures show less progression (rationale: independently evaluated but related outcomes should demonstrate consistent findings); (d) effect sizes in a sample of comparisons do not approximate a normal distribution (rationale: if effect sizes were random then they would have a normal distribution); or (e) multiple medication classes with common physiologic effects have similar findings. We believe the last source of potential signals (multiple medication classes with similar findings) may be most informative. The results from each medication class may be susceptible to indication bias but if multiple medication classes, with common physiologic effects and distinct indications for use, have similar findings then it may indicate a relevant biologic pathway. For example, if users of beta-adrenergic blockers and users of alpha-adrenergic blockers have large differences in disease progression in both the right and left knees compared with nonusers then it may be a signal that the sympathetic nervous system influences a biologic pathway that warrants further research. These analyses may reaffirm the biologic pathways or interventions, which are being tested, or highlight novel pathways that deserve further follow up. Therefore, we conducted an exploratory analysis of osteoarthritis progression among medication users in the OAI to identify interventions or pathways that may be associated with disease modification and therefore of interest for future clinical trials.
Methods
Study sample
We used OAI participants with annual medication inventory form data between baseline and the 36-month follow-up visit (n = 2938). Consistent medication users were defined for each medication classification as a participant bringing in their prescription medication and reporting at the first four annual visits (baseline, 12-month, 24-month, and 36-month visits) that they were regularly using an oral prescription medication at the time of the clinic visit (key OAI variables: VxxMIFUSE = 1 [still using], VxxMIFFREQ = 2 [regular use], VxxFRMCODE IN (1 2) [oral]). Two definitions of consistent medication nonuser were assessed: (a) definite nonuser: participants never brought in the prescription medication to a clinical visit (VxxINGCODE medication was never present); and (b) probable nonuser: participants may or may not have brought in the prescription medication but if they did bring in the prescription medication then they never reported regularly using an oral prescription medication at the time of the clinic visit (any participant not meeting the criteria of consistent medication user). The exploratory analysis focused on medication classes with 40 or more users to ensure that an adequate sample size would be available to calculate an effect size. We considered all 2938 participants eligible for analyses, regardless of baseline disease severity. All participants provided informed consent to participate in the OAI. Furthermore, the institutional review boards at the University of California, San Francisco (OAI Coordinating Center; Approval Number 10-00532) and the clinical sites approved the OAI.
OAI medication inventory forms
At each visit, study staff advised participants to bring all prescription and nonprescription medications used in the 30 days prior to the visit. An examiner recorded all the prescription medications, duration of use (e.g. < 1 month, 1 month to 1 year), frequency that the medication was taken (e.g. as needed, regular), formulation code (e.g. oral, topical), and whether the medication was still being used at the time of the visit. If a participant forgot to bring their medication to the clinic visit then a list of medications or a follow-up call were used to complete the data. Medication that was administered during surgery or hospitalization was not included on the medication inventory form unless it was continued after discharge. Duration of medication use was determined based on a self-reported answer to “How long have you been taking the medication since you most recently started it?”. Frequency of medication use was considered regular if the participant took the medication as prescribed on a regular schedule. For certain classes of medications this infers that regular medication use does not have to be daily medication use. The medication inventory forms are publicly available (http://oai.epi-ucsf.org). These analyses are based on the annual medication inventory forms between baseline and the 36-month visit (release versions 0.2.2, 1.2.1, 3.2.1, 5.2.1).
In the medication inventory form data files the medications are coded based on the Iowa Drug Information Service (IDIS) database developed at the University of Iowa [Pahor et al. 1994]. The IDIS ingredient coding system assigns each medication an eight-digit drug number that defines the medication classifications and specific medication. For example, the IDIS number for captopril (IDIS number = 24080203) indicates that it is an angiotensin-converting enzyme (ACE) Inhibitor (240802XX), which is a subcategory of hypotensive agents (2408XXXX). These drugs belong to the broader class of cardiovascular agents (24XXXXXX). When a sufficient sample size was available (
Outcome measures
The key structural outcome measure was quantitative joint space width at x = 0.250 (JSW250) change (12–36-month visits). Baseline outcomes were not included to ensure OAI documentation indicated that the participant had taken the medication at least 1 year prior to the first outcome assessment. The JSW measures at fixed locations within the knee were performed on bilateral, weight-bearing, fixed-flexion knee radiographs and the method has been previously described [Duryea et al. 2003, 2010; Neumann et al. 2009]. The semi-automated location-specific JSW measurements were determined based on paired images but the reader was blind to the chronological order. The JSW data are publicly available on the OAI website. These analyses are based on the annual JSW measures (release versions 1.5, 3.4, 5.2).
To control for image acquisition quality and consistency, we evaluated beam angle (OAI variable: VxxBMANG) and distance from tibial plateau to tibial rim closest to the femoral condyle (rim distance; OAI variable: VxxTPCFS). We excluded JSW250 measures at a time point if the beam angle was less than 5° or greater than 15° and the rim distance was greater than 6.5 mm. Furthermore, longitudinal JSW250 change was excluded if the rim distance change was not within ± 1.4 mm or the beam angle change was not within ± 5°. The threshold for longitudinal change was based on exploratory regression models of right knees with no osteoarthritis (Kellgren–Lawrence grade 0) at baseline and 12-month follow up. When only knees were included with rim distance change within ± 1.4 mm, a 5° change in beam angle could only contribute to approximately 0.1 mm change in JSW250 (approximately one pixel; mean pixel size = 0.15 mm, range 0.10–0.20 mm; model [n = 272, R2 = 0.06]: JSW250_change = [0.0199 * beam angle change] + [0.0661 * (rim distance change]). We used conservative cut-offs for data cleaning because beam angle change and rim distance change were not controlled for in regression models.
The key patient-reported outcome measure was the Western Ontario and McMaster Universities Arthritis Index (WOMAC) pain score change (12–36-month visits). Baseline outcomes were not included to ensure that OAI documentation indicated that the participant had taken the medication at least 1 year prior to the first outcome assessment. The WOMAC data are publicly available on the OAI website. These analyses are based on the annual WOMAC assessments (AllClinicalxx datasets release versions 1.21, 3.2.1, 5.2.1).
Data analyses
Medication use data were extracted from the medication inventory forms using SAS 9.2 (Cary, NC, USA). Each medication class was analyzed separately. We explored eights sets of comparisons per knee including four with nonusers matched to users based on OAI cohort, race, gender, age (± 5 years), and body mass index (± 5 kg/m2): (a) no matching: users to all definite nonusers; (b) no matching: users to all definite nonusers but restricted to only participants with JSW250 data; (c) matched (one-to-one): users to definite nonusers; (d) matched (one-to-one) and restricted to only participants with JSW250 data: users to definite nonusers; (e) no matching: users to all probable nonusers; (f) no matching: users to all probable nonusers but restricted to only participants with JSW250; (g) matched (one-to-one): users to probable nonusers; and (h) matched (one-to-one) and restricted to only participants with JSW250 data: users to probable nonusers. For each matched comparison, matching was independently repeated; therefore, the sample of nonusers could differ between comparisons. Each knee was assessed independently because potential signals may be detected if multiple joints (e.g. right and left knee) have less progression among users compared with nonusers. We opted to focus on the right and left knee instead of affected and unaffected knee to minimize biases introduced by conditioning on disease status. Furthermore, we opted to avoid averaging the knees because we hypothesized that a signal could be detected if it occurred in multiple joints. A standardized effect size [Cohen, 1988] was generated for each medication class in each set of comparisons (d = [user mean minus nonuser mean] divided by pooled standard deviation). Therefore, within each knee, we calculated eight effect sizes per outcome measure for all of the medication classes. We screened medication classes based on the median, range, and sum of the eight effect sizes. The primary outcomes were JSW250 change and WOMAC pain change. Change was calculated as 36-month visit data minus 12-month visit data.
Preliminary screening was performed to identify medication classes with median effect sizes in either knee for JSW250 change > 0.10 or < −0.10 for WOMAC pain change. Furthermore, medication classes underwent secondary screening if at least 14 of 16 total comparisons had effect sizes indicating better progression among users compared with nonusers (7 of 8 unilateral comparisons needed to be beneficial effect sizes). Secondary screening of selected medication classes were performed by evaluating box plots of WOMAC pain change among users and nonusers to determine if the median WOMAC pain change of matched definite nonusers was beyond the interquartile range (IQR) for WOMAC pain change among users (comparison (c) above). To assess median JSW change of nonusers compared with the IQR of definite users we assessed the box plots among matched definite nonusers when restricted to only participants with JSW250 data (comparison (d) above).
As a final confirmatory analysis, two Q-Q plots (right and left knee) were explored to determine if standardized effect sizes for WOMAC pain change among users and matched definite nonusers (comparison (c) above) differed from the normal distribution expected from random noise. By assuming that the 70% of medication classes with the smallest absolute standardized effect represent noise, we plotted what would be expected if none of the classes had any effect. Medication classes differing from the expected noise line may represent true signals. Furthermore, two Q-Q plots (right and left knee) were explored to determine if standardized effect sizes for JSW change among users and matched definite nonusers (when restricted to only participants with JSW250 data; comparison (d) above) differed from the normal distribution expected from random noise.
Results
A total of 28 medication classes were eligible for screening. Table 1 shows sample sizes and the sum of effect sizes for each medication class. Figures 1 and 2 show the distribution of effect sizes by comparison (color of symbols) and knee (shape of symbol) for WOMAC pain change and JSW change. Supplementary File 1 contains the sample size, means, standard deviation, and effect sizes for all of the comparisons.
Consistent medication user and nonusers sample sizes as well as ranking of potential benefits based on the sum of effect sizes for joint space width and WOMAC pain change analyzed from the eight sets of comparisons.

Note: green = potential beneficial effect for users; red = potential negative effect for users.
ES, effect size; JSW250, joint space width at x = 0.250; WOMAC, Western Ontario and McMaster Universities Arthritis Index.

Plots demonstrating the distribution of standardized effect sizes for joint space width change. The plots demonstrate the standardized effect sizes from eight comparisons (represented by different colors) per knee (left knee = pluses, right knee = circles). *Antidepressants (not including selective serotonin reuptake inhibitors).
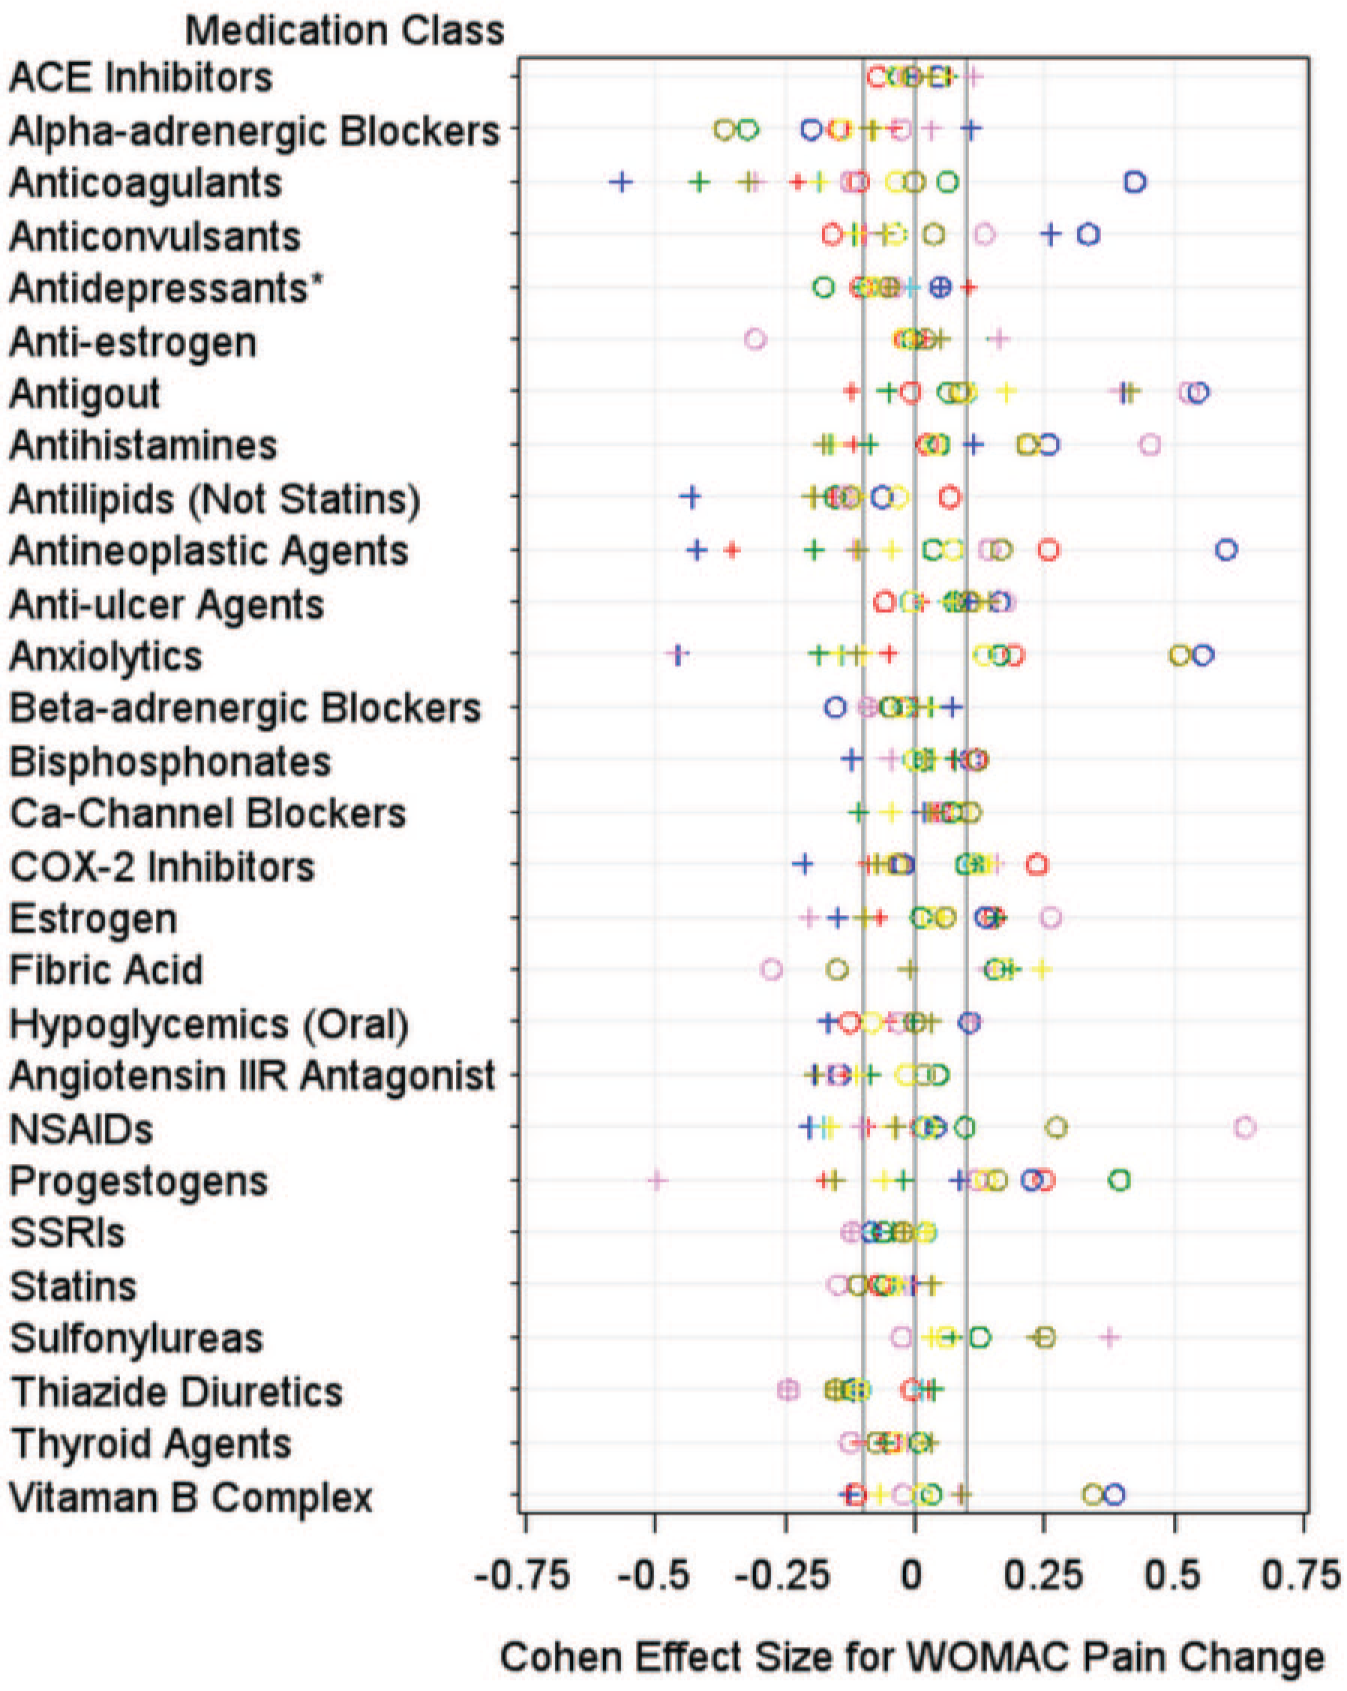
Plots demonstrating the distribution of standardized effect sizes for Western Ontario and McMaster Universities Arthritis Index (WOMAC) pain change. The plots demonstrate the standardized effect sizes from eight comparisons (represented by different colors) per knee (left knee = pluses, right knee = circles). *Antidepressants (not including selective serotonin reuptake inhibitors).
Preliminary screening: JSW change
We performed preliminary screening using several methods to identify medication classifications warranting further evaluation. The preliminary screenings were intended to be liberal to identify initially a larger number of medication classes for follow-up evaluation but to eliminate medication classes that showed no signals. Among right knee comparisons, six medication classes had median effect sizes greater than 0.10 for JSW250 change: ACE inhibitors (median effect size = 0.16; range = 0.14–0.28), anticonvulsants (median effect size = 0.38; range = 0.08–0.64), anti-estrogen (median effect size = 0.37; range = 0.33–0.64), selective serotonin reuptake inhibitors (SSRIs) (median effect size = 0.17; range = −0.13–0.32), antilipemic agents (excluding statins and fibric acid (median effect size = 0.38; range = 0.05–0.50), and antineoplastic agents (median effect size = 0.17; range = −0.17–0.60). Seven medication classes had median effect sizes greater than 0.10 for JSW250 change among left knee comparisons: antineoplastic agents (median effect size = 0.27; range = 0.11–0.68), anti-estrogen (median effect size = 0.22; range = −0.41–0.23), anticoagulants (median effect size = 0.25; range = 0.19–0.61), estrogen (median effect size = 0.14; range = −0.23–0.22), antihistamines (median effect size = 0.22; range = 0.08–0.37), SSRIs (median effect size = 0.17; range = 0.01–0.32), and alpha-adrenergic blockers (median effect size = 0.12; range = 0.07–0.44). Six medication classes were also screened because at least 14 of 16 comparisons had positive effect sizes: ACE inhibitor (median effect size = 0.13; range = −0.08–0.28 in both knees), anticoagulants (median effect size = 0.19; range = −0.02–0.61 in both knees), anti-estrogen (median effect size = 0.28; range = −0.41–0.64 in both knees), antineoplastic (median effect size = 0.27; range = −0.17–0.68 in both knees), beta-adrenergic blockers (median effect size = 0.09; range = 0.01–0.30 in both knees), and thyroid agents (median effect size = 0.04; range = −0.05–0.14 in both knees). Therefore, for structural changes, 12 medication classes underwent secondary screening: ACE inhibitors, alpha-adrenergic blockers, anticoagulants, anticonvulsants, SSRIs, anti-estrogen, antihistamines, antilipemic agents (excluding statins and fibric acid), antineoplastic agents, estrogen, beta-adrenergic blockers, and thyroid agents.
Secondary screening: JSW change
Box plots for the 12 medications classes that underwent additional screening are shown in Supplementary File 2. The median change of matched definite nonusers was beyond the IQR of antilipemic agents (excluding statins and fibric acid; left knee) users. Additional trends were observed for alpha-adrenergic blockers (left knees), anticoagulants (left knees), anticonvulsants (right knees), and anti-estrogen (right knees). All of the trends were detected unilaterally.
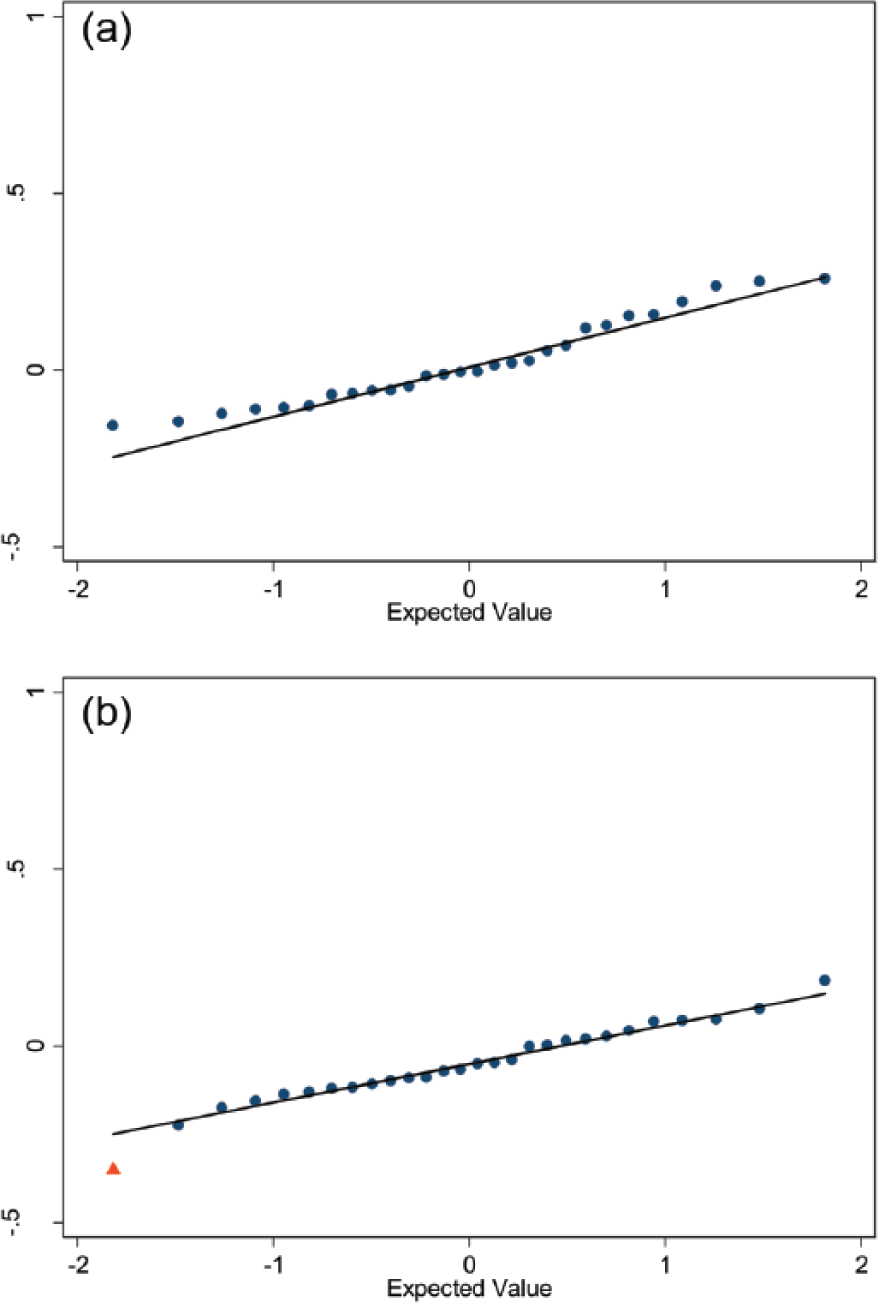
To further explore potential signals we reviewed Q-Q plots representing the 28 standardized effect sizes for JSW250 change (Figure 3a right knee; Figure 3b left knee); one for each class of medication. Among right knees, there was potential signal differences in JSW250 change among users and nonusers for antineoplastic agents, anticonvulsants, and anti-estrogen (red triangles in Figure 3a). There were potential left-knee JSW change differences between users and nonusers for antineoplastic agents, anticoagulants, and alpha-adrenergic blockers (red triangles in Figure 3b). Antineoplastic agents were the only medication class with bilateral signals based on Q-Q plots.

Q-Q plots of standardized effect sizes for joint space width at x = 0.250 (JSW250) change among users and matched nonusers. Q-Q plots of plots, (a) right and (b) left knee, of standardized effect sizes for JSW250 change among users and matched definite nonusers when restricted to only participants with JSW250 data (y-axis). The 28 medication classifications are represented by dots or triangles and the line represents expected values under no real effect due to any of the medication classes (based on the 70% of classes with the smallest absolute standardized effect sizes). The red triangles indicate potential deviations from a normal distribution. Among right knees (a) the medication classes marked are antineoplastic agents, anticonvulsants, and anti-estrogen. Among left knees (b) the medication classes indicated are antineoplastic agents, anticoagulants, alpha-adrenergic blockers, and fibric acid (right to left in the figure).
Preliminary screening: WOMAC pain change
We performed preliminary screening using several methods to identify medication classifications warranting further evaluation. Among right knee comparisons, two medication classes had median effect sizes less than −0.10 for WOMAC pain change: alpha-adrenergic blockers (median effect size = −0.17; range = −0.37 to −0.02), and thiazide diuretics (median effect size = −0.12; range = −0.24 to −0.01). Eight medication classes had median effect sizes less than −0.10 for WOMAC pain change among left knee comparisons: anticoagulants (median effect size = −0.31; range = −0.57 to −0.18), antilipemic agents (excluding statins and fibric acid) (median effect size = −0.18; range = −0.43 to −0.11), antihistamines (median effect size = −0.16; range = −0.17 to 0.12), angiotensin II receptor antagonist (median effect size = −0.15; range = −0.19 to −0.09), anxiolytics (median effect size = −0.14; range = −0.46 to −0.05), antineoplastic (median effect size = −0.11; range = −0.42 to −0.05), thiazide diuretics (median effect size = −0.11; range = −0.24 to 0.04), and progestogens (median effect size = −0.11; range = −0.50 to 0.09). One medication class was also screened because at least 14 of 16 comparisons had negative effect sizes: antilipemic agents (excluding statins and fibric acid) (median effect size = −0.13; range = −0.43 to 0.07 in both knees). Therefore, for WOMAC pain changes, nine medication classes underwent further screening: alpha-adrenergic blockers, angiotensin II receptor antagonist, anticoagulants, antihistamines, antilipemic agents (excluding statins and fibric acid), antineoplastic agents, anxiolytics, thiazide diuretics, and progestogens.
Secondary screening: WOMAC pain change
Box plots for the 10 medications classes that underwent additional screening are shown in Supplementary File 2. The median change of matched definite nonusers was beyond the IQR of alpha-adrenergic blockers (right and left knees), anxiolytics (left knees), and antilipemic agents (excluding statins and fibric acid) (left knees).
To further explore potential signals we reviewed Q-Q plots representing the 28 standardized effect sizes for WOMAC pain change (Figure 4a right knee; Figure 4b left knee); one for each class of medication. There was a potential left-knee WOMAC pain change difference between users and nonusers for antineoplastic agents. Among right knees, there were no potential signals based on Q-Q plots.
Q-Q plots of standardized effect sizes for WOMAC pain change among users and matched nonusers. Q-Q plots, (a) right and (b) left knee) of standardized effect sizes for WOMAC pain change among users and matched definite nonusers (y-axis). The 28 medication classifications are represented by dots or triangles, and the line represents expected values under no real effect due to any of the medication classes (based on the 70% of classes with the smallest absolute standardized effect sizes). Among right knees (a) none of the medication classes deviated from a normal distribution. Among left knees (b) the standardized effect size for antineoplastic agents deviated from a normal distribution (red triangle).
Discussion
This exploratory analysis in the OAI screened 28 medication classes to determine if consistent long-term medication users, compared with nonusers, had different structural and knee pain changes over 24 months. Four medication classes demonstrated a potential signal based on (a) a signal in primary and secondary screenings as well as (b) bilateral evidence of altered progression or concordance of JSW and WOMAC results within the knee (see Table 2). Users of seven medication classes had weaker signals for less disease progression based on (a) a signal in primary screening only as well as (b) bilateral evidence of altered progression or concordance of JSW and WOMAC results within the knee (see Table 2). All of the medication classes with signals had evidence that medication users experienced less JSW250 change than nonusers except for thiazide diuretics, which only had a signal for symptom changes. While confirmatory analyses could only verify a potential signal for antineoplastic agents, it is interesting that many of the medications with signals exhibited patterns of neurovascular (e.g. alpha-adrenergic blockers, beta-adrenergic blockers) or hormonal pathways (e.g. anti-estrogen, thyroid agents). These medication classifications may inspire research into novel pathways or facilitate the development of clinical trials to explore potential therapeutic targets.
Medication classifications with potential signals for modifying knee osteoarthritis progression.

Primary mechanism of action based on PDR Network LLC (www.pdr.net).
Antineoplastic agents were confirmed based on Q-Q plots (right and left knee JSW250 change, left knee WOMAC pain change).
JSW250, joint space width at x = 0.250; WOMAC, Western Ontario and McMaster Universities Arthritis Index.
Users of several neurovascular interventions experienced less joint space narrowing or improvement in knee pain over 24 months compared with nonusers. Users of alpha-adrenergic blockers (e.g. tamsulosin, doxazosin, terazosin) or beta-adrenergic blockers (e.g. atenolol, metoprolol) had potential signals for better outcomes. Both classes of adrenergic blockers act on receptors commonly found in smooth muscle (e.g. vascular structures), influence the sympathetic nervous system, and lower systemic blood pressure. Interestingly, users of thiazide diuretics (e.g. hydrochlorothiazide), which can also lower blood pressure, were found to have better changes in knee pain compared with nonusers. Users of ACE inhibitors (e.g. lisinopril), a medication which reduces blood pressure, also experienced less change in JSW250 relative to nonusers. Similarly, antihistamine users (e.g. fexofenadine, cetirizine), which are not commonly prescribed for hypertension but may influence blood pressure [Magen et al. 2006], had better structural and symptom changes than nonusers. Together, results evaluating these medications suggest a hypothesis that hypertension may be related to osteoarthritis progression.
Two other medication classifications that also influence the cardiovascular system are antineoplastic agents (e.g. finasteride) and anticoagulants (e.g. warfarin). Antineoplastic agents are particularly interesting because osteoarthritis may be characterized by neovascularization in the bone (e.g. bone marrow lesions) [Bergman et al. 1994; Saadat et al. 2008], cartilage [Suri et al. 2007; Franses et al. 2010], and synovium [Haywood et al. 2003]. While blood pressure modification may be one commonality among several of the medication classifications, there may be other relevant similarities among smaller subsets (e.g. modification of adrenergic receptors on osteoblasts or other cells).
In addition to adrenergic receptor blockers, users of SSRIs, which also influence the nervous systems, had less JSW change and better changes in pain relative to nonusers. There is increasing evidence that the central nervous system may play an important role not only in chronic pain but also in inflammation, which may influence disease progression [Borovikova et al. 2000; Elliott et al. 2008; Johnston and Webster, 2009; Rodriguez-Raecke et al. 2009; Baliki et al. 2011; Mease et al. 2011]. The potential of medications that can target the central nervous system as well as joint structure and symptoms may warrant further exploration since they may be unique in targeting central and peripheral osteoarthritis mechanisms. This provides proof of concept that duloxetine, a selective serotonin and norepinephrine reuptake inhibitor that was recently approved by the US Food and Drug Administration to treat knee osteoarthritis symptoms, may also have structure modification effects.
Hormonal pathways may be another interesting set of interventions that can influence various tissues throughout the body. In the current analyses, users of three medication classifications, which are related to hormonal regulation, demonstrated less change in JSW250 (i.e. anti-estrogen, thyroid agents, and antineoplastic agents) and better changes in knee pain (i.e. antineoplastic agents). The anti-estrogen (which was almost exclusively raloxifene) is interesting since raloxifene, which is more accurately defined as a selective estrogen-receptor modulator, is typically an estrogen antagonist except in selective tissues (e.g. bone) [Riggs and Hartmann, 2003]. Recent systematic reviews suggest that raloxifene may reduce the risk of clinical fractures in women; similar to estrogen [MacLean et al. 2008; Kanis et al. 2010]. In addition to estrogen pathways, other relevant hormones may include thyroid and testosterone/dihydrotestosterone (by certain antineoplastic agents, e.g. finasteride).
Besides neurovascular and hormonal pathways, users of antilipemic medications (primarily ezetimibe), excluding statins and fibric acid, had less change in JSW250 and better knee pain changes than nonusers. Recent animal studies suggested that high fat diets may increase the risk of osteoarthritis due to low-grade inflammation [Griffin et al. 2010; Gierman et al. 2012]. Perhaps interventions, like ezetimibe, could ameliorate the risk of osteoarthritis by inhibiting the absorption of cholesterol. With recent attention focused on the protective benefits of statins [Clockaerts et al. 2011], which did not generate a signal in these analyses, it may be worth also exploring other antilipemic interventions.
The current study detected several potential signals related to neurovascular and hormonal pathways as well as certain antilipemic medications. These analyses have several limitations including potential confounding by indication, index event bias (since participants were selectively recruited because they had or had risk for knee osteoarthritis), the lack of control for potential confounders, and no confirmation of many of these signals. These analyses represent an initial step, and future analyses may be appropriate to scrutinize the potential signals by controlling for additional confounders and performing sensitivity analyses (e.g. stratified analyses based on baseline disease severity). A total of 6 out of the 11 potential signals (i.e. alpha-adrenergic blockers, anticoagulants, antilipemic agents, ACE inhibitors, beta-adrenergic blockers, thiazide), are typically associated with cardiovascular disorders, which may be associated with osteoarthritis [Hoeven et al. 2013; Monira Hussain et al. 2014; Abourazzak et al. 2015; Li et al. 2016]. Hence, any confounding by indication may lead to underestimating the true benefit of these therapies. In spite of these limitations, this exploratory study may facilitate the generation of new hypotheses for developing novel interventions or clinical trials to assess interventions currently on the market. To date, there are no accepted disease-modifying osteoarthritis interventions and the current paradigm of exploring novel pathways for interventions and conducting clinical trials is becoming financially challenging. Exploratory analyses of medication users in large cohorts may help us identify novel pathways or interventions that are already on the market and can be assessed in future clinical trials. These analyses were intended to promote hypothesis generation but the interpretation of the data in the results and discussion reflects the hypotheses proposed by the authors. This represents a potential limitation, but the OAI data sets are publicly available for analysis and the supplementary files have been provided to enable readers to assess the data and develop their own hypotheses.
Conclusion
In conclusion, the exploratory analysis of medication users and nonusers in the OAI indicate the neurovascular, hormonal, and antilipemic interventions warrant more research to determine their potential as disease-modifying agents. Furthermore, exploratory analyses of large cohort studies with medication data may provide a valuable resource to determine potential therapeutic targets in a cost- effective method.
Footnotes
Acknowledgements
This manuscript has received the approval of the OAI Publications Committee based on a review of its scientific content and data interpretation.
Funding
This work was supported by the National Institute of Arthritis and Musculoskeletal and Skin Disease [Project number 268201000020C-1-0-1]. The OAI was supported by a public–private partnership comprising five contracts [N01-AR-2-2258, N01-AR-2-2259, N01-AR-2-2260, N01-AR-2-2261 and N01-AR-2-2262] funded by the National Institutes of Health, a branch of the Department of Health and Human Services, and conducted by the OAI Study Investigators. Private funding partners include Pfizer, Inc., Novartis Pharmaceuticals Corporation, Merck, and GlaxoSmithKline. Private sector funding for the OAI is managed by the Foundation for the National Institutes of Health.
This work was supported by the Houston Veterans Affairs Health Services Research and Development Center of Excellence [HFP90-020]. The views expressed in this article are those of the authors and do not necessarily represent the views of the Department of Veterans Affairs.
Conflict of interest statement
The authors declare that there is no conflict of interest.
References
Supplementary Material
Please find the following supplemental material available below.
For Open Access articles published under a Creative Commons License, all supplemental material carries the same license as the article it is associated with.
For non-Open Access articles published, all supplemental material carries a non-exclusive license, and permission requests for re-use of supplemental material or any part of supplemental material shall be sent directly to the copyright owner as specified in the copyright notice associated with the article.