
Abstract
Aim:
The aim of this study was to derive a pure, unbiased, reliable and accurate objective relationship between the local knee axis measurements through a short knee anteroposterior roentgenogram and the lower limb axis measurement through an orthoroentgenogram.
Patients and Methods:
Radiographs of 114 patients (114 knees) were evaluated by two independent raters for measurement of lower limb axis on an orthoroentgenogram and the local knee axis on short knee anteroposterior X-ray, which was derived by cropping the orthoroentgenogram by a blinded radiology assistant. The raters measured at two different time-points separated by an interval of 30-day period. Intra-rater and inter-rater reliabilities were calculated by intra-class correlation coefficients and three models were built to establish the relationships of X-ray anatomical axis with orthoroentgenogram anatomical axis, orthoroentgenogram anatomical axis with orthoroentgenogram mechanical axis and X-ray anatomical axis with orthoroentgenogram mechanical axis.
Results:
For three different measurements, intra-class correlation coefficients of Rater 2 were higher than 0.90 which shows perfect reliability, while that for Rater 1 was low. Furthermore, first measurements were more consistent than the second measurement. There was a strong positive correlation in all the three models except for varus cases in the last.
Conclusion:
The standardized correlation derived between the two different techniques for measuring knee alignment is fairly comparable with the studies in the past and would serve as a reliable template for future studies concerning relationships between the two, in addition to helping knee surgeons make more reliable and accurate interpretations through local knee axis measurements.
Introduction
Many disorders around knee like osteoarthritis or coronal plane deformities require surgical intervention with an aim to align the knee axis as close to normal as possible and require accurate measurement of the limb alignment for achieving the correction desired. Albeit the anteroposterior (AP) long leg radiograph is considered as the gold standard for determining axial alignment of knee, it is time consuming, expensive and involves greater radiation exposure. 1 Surgeons in their clinical practice therefore prefer to use short knee anterior–posterior weight-bearing X-rays to evaluate the alignment as the angle between the axes of femur and tibia.2,3 Less radiation exposure, economical and common availability of this radiograph make it popular but technically not reliable and accurate enough.
The correlation between the local knee anatomical axis measurement through a short knee AP radiograph and the mechanical lower limb axis measurement through a full-leg orthoroentgenogram has been well studied in the recent up-to-date lower limb alignment literature. Also, studies in the past have concluded that short knee radiographic images cannot substitute whole leg views for accurate assessment of knee alignment and may cause inaccuracy, undesirable for patients undergoing corrective surgeries around knee.2,3 However, no study has focused on a prospective and standardized approach to investigating the pure, unbiased relationship between the two measurement techniques.
We therefore aimed to objectively and quantitatively investigate the relationship between two different knee alignment measurement techniques and check the reliability of that described in the literature so far, with a new and completely standardized method. Furthermore, we also aimed to the objectively standardize and validate the correlation between the two different measurement techniques in order to be able to perform a more reliable, standardized and validated local knee axis measurement.
Thus, knee surgeons would be able to make more reliable and accurate interpretations through local knee axis measurements and the correlation so derived could serve as a reference for all further studies.
Using short AP knee X-rays cropped from full-leg orthoroentgenograms, we aim to eliminate all the biases associated with usual ways of obtaining the same and provide an accurate correlation coefficient between the two measurement techniques and set standards for taking short AP knee X-ray so as to make it as much accurate as possible.
Methods
Retrospective review of database of 150 (number of) normal/osteoarthritis (OA) patients with 150 (number of) knees radiographs were done between 1 September 2016 to 12 December 2016 with equal number of males and female subjects. Thirty-six of 150 radiographs were excluded because of inappropriate positioning of patients. These patients orthoroentgenograms were performed in rotation. After exclusion, 114 patients were available to be included in the study. We had 150 long leg views in our radiology archive. Analysis was performed to detect the sample size. A total of 111 long leg views were needed with a confidence level of 95% and precision range of 0.05. We measured 114 long leg views and they were enough to make a comparison. Each patient underwent a standard AP full-length weight-bearing orthoroentgenogram (Diamond, DRGEM, Korea). Full-limb radiographs were obtained using 35 cm × 43 cm flat panel. The X-ray beam was centered at the knee at a distance of 100 cm. The beam was parallel to the floor and the machine’s settings were 4.2 mA s and 63 kV. The subjects were asked to stand without footwear, with tibial tubercles facing forward, and both limbs were radiographed together.
The mechanical knee axis angle was measured as the angle between the femoral mechanical axis (the line from the center of the femoral head to the apex of the femoral intercondylar notch) and the tibial mechanical axis (the line from center of tibial plafond/talus to the center of the tibial spine) (Figure 1). Short AP knee X-ray was obtained by cropping the knee from the full-leg radiograph from which the mechanical axis angle was measured, by a blinded radiology assistant. The cutting levels of femur and tibia were detected from standard short leg views of knee. The femur and tibia were cut apart from 20 cm from knee joint line.
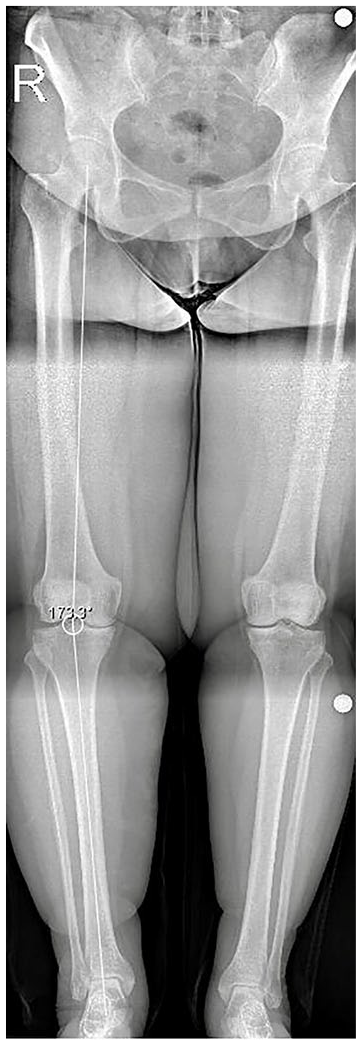
Mechanical axis measurement technique in orthoroentgenogram.
Anatomical axis angle was defined as the angle between the femoral and tibial anatomical axes formed by the lines joining the center of tibial spines to a point 10 cm above and below the tibial spines, midway between the lateral and medial cortices of femur and tibia, respectively (Figure 2).

Anatomical axis measurement technique in short knee radiography.
Varus and valgus cases were defined as varus and valgus positions of first mechanical axis measurements of Rater 2. If the mechanical axis passes from lateral to zero point defined as valgus deformity and from medial to zero point defined as varus deformity.
The anatomical axis was also calculated on the full-leg radiograph from which the mechanical axis angle was measured, using the same femoral and tibial shaft lengths (10 cm above and below the tibial spines) as used for calculating anatomical axis from the short AP X-ray.
Measurements of the anatomical axis on both the radiographs and mechanical axis on the full-leg radiographs were performed by two raters separated in time at an interval of 30 days for each. All measurements were performed by a computer software system (ENLIL PACS, Turkey).
The study protocol was approved by the Medical Ethics Committee of the Suleyman Demirel University (Date: 21 December 2016; Decision No: 171). Informed consent has been obtained from patients who participated in clinical investigations.
Statistical analysis
Intra-observer and inter-observer reliabilities were evaluated by intra-class correlation coefficients (ICCs). Pearson correlation coefficients were calculated to detect linear relationship between numerical variables. Beta coefficients were estimated by univariate linear regression analysis. All analyses were performed using SPSS for windows version 24.0. The p value of <0.05 was considered as statistically significant. Each film was evaluated by two raters and at two different times. ICCs were calculated to evaluate between and within raters reliabilities. Because of high intra-rater ICCs of Rater 2, mean of the two different measurements of Rater 2 was used for regression modeling part.
The first model was built to evaluate prediction performance of X-ray anatomical axis to orthoroentgenogram anatomical axis. In the second model, orthoroentgenogram anatomical axis was used as a predictor to estimate orthoroentgenogram mechanical axis. In the third model, relationship between X-ray anatomical axis and orthoroentgenogram mechanical axis was evaluated. Regression analysis was also performed separately for varus and valgus cases in the last two models.
Results
ICCs were calculated to evaluate reliabilities between (inter-rater) and within (intra-rater) raters and are listed in Tables 1 and 2.
ICCs and 95% CIs for within two different evaluations of raters.

ICC: intra-class correlation coefficients; CI: confidence interval.
ICCs and 95% CIs for within raters reliabilities.
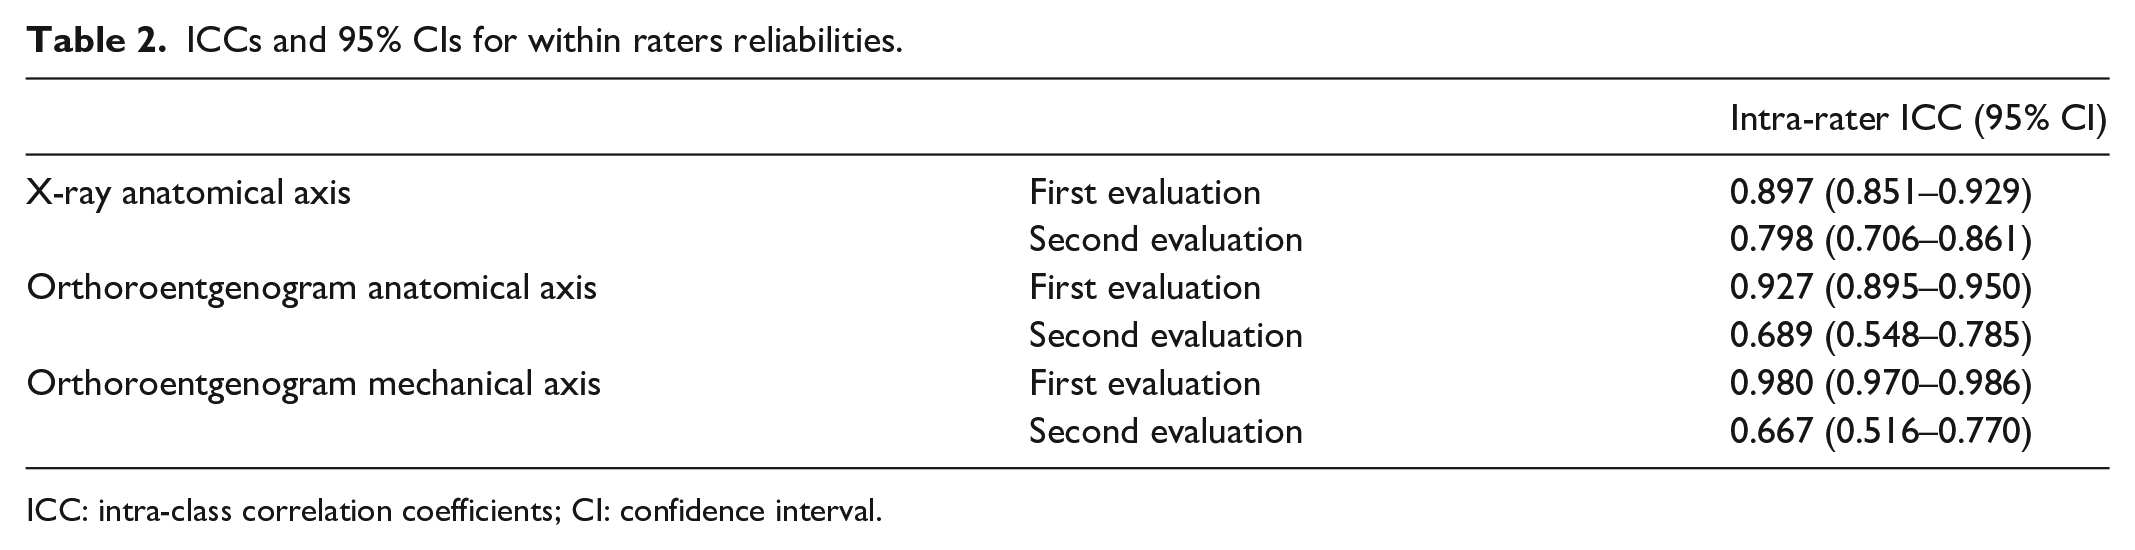
ICC: intra-class correlation coefficients; CI: confidence interval.
For three different measurements, ICCs of Rater 2 were higher than 0.90 which shows perfect reliability; however, intra-rater ICCs were low for Rater 1 (Table 1). Furthermore, intra-rater evaluations showed that the first measurements were more consistent than the second measurements (Table 2).
Results of the first model built to evaluate prediction performance of X-ray anatomical axis to orthoroentgenogram anatomical axis are given in Table 3.
Result of univariate linear regression analysis for the first model.

Dependent variable: orthoroentgenogram anatomical axis.
Significant at 0.05 level.
There was a very strong positive correlation between X-ray anatomical axis and orthoroentgenogram anatomical axis (r = 0.836, p = 0.001). According to univariate linear regression analysis, 69.8% of variation in orthoroentgenogram anatomical axis was explained by X-ray anatomical axis (Table 3). A 1° increase in X-ray anatomical axis resulted in 0.852° increase in orthoroentgenogram anatomical axes. This relationship is shown in Figure 3. Regression model was


Regression line to estimate orthoroentgenogram anatomical axes by X-ray anatomical axis.
Results of the second model with orthoroentgenogram anatomical axis used as a predictor to estimate orthoroentgenogram mechanical axis are given in Table 4.
Result of univariate linear regression analysis for the second model.

Dependent variable: orthoroentgenogram mechanical axis.
Significant at 0.05 level.
There was a very strong positive correlation between orthoroentgenogram anatomical axis and mechanical axis (r = 0.879. p = 0.001). According to univariate linear regression analysis, 77.3% of variation in orthoroentgenogram mechanical axis was explained by orthoroentgenogram anatomical axis (Table 4). A 1° increase in orthoroentgenogram anatomical axis resulted in 0.869° increase in orthoroentgenogram mechanical axis. Regression model was

When regression analysis was performed for varus cases, there was a strong positive correlation between orthoroentgenogram anatomical axis and orthoroentgenogram mechanical axis (r = 0.674, p = 0.001). According to univariate linear regression analysis, 45.5% of variation in orthoroentgenogram mechanical axis was explained by orthoroentgenogram anatomical axis (Table 4). A 1° increase in orthoroentgenogram anatomical axis resulted in 0.952° increase in orthoroentgenogram mechanical axis. Regression model was

We also performed the regression analysis for valgus cases. There was a very strong positive correlation between orthoroentgenogram anatomical axis and orthoroentgenogram mechanical axis (r = 0.967, p = 0.001). According to univariate linear regression analysis, 93.4% of variation in orthoroentgenogram mechanical axis was explained by orthoroentgenogram anatomical axis (Table 4). A 1° increase in orthoroentgenogram anatomical axis resulted in 0.985° increase in orthoroentgenogram mechanical axis. Regression model was
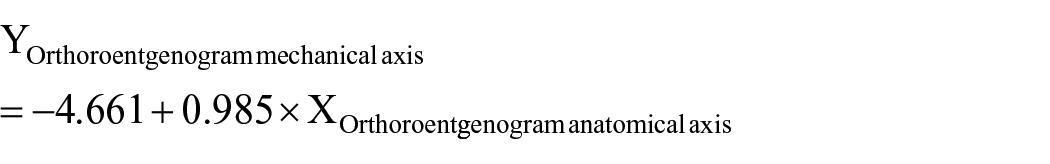
Figure 4 shows the regression between two variables for varus and valgus groups separately.
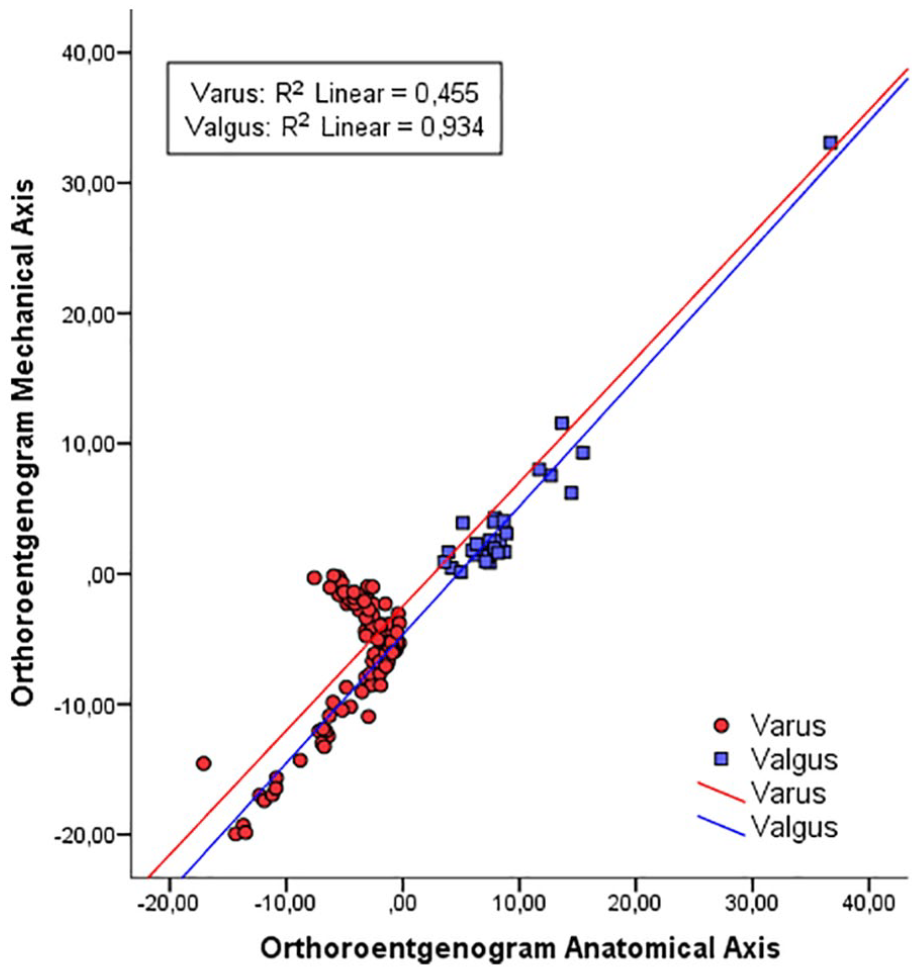
Regression line to estimate orthoroentgenogram mechanical axis by orthoroentgenogram anatomical axis for varus and valgus groups.
In the third model, results of relationships between X-ray anatomical axis and orthoroentgenogram mechanical axis obtained are given in Table 5.
Result of univariate linear regression analysis for the third model.

Dependent variable: orthoroentgenogram mechanical axis.
Significant at 0.05 level.
There was a strong positive correlation between measurements (r = 0.685, p = 0.001). According to univariate linear regression analysis, 47.0% of variation in orthoroentgenogram mechanical axis was explained by X-ray anatomical axis (Table 5). A 1° increase in X-ray anatomical axis resulted in 0.69° increase in orthoroentgenogram mechanical axis. Regression model was

Subgroup analysis for varus and valgus cases was performed. For varus cases, there was no significant correlation between X-ray anatomical axis and orthoroentgenogram mechanical axis (r = –0.048. p = 0.664). So regression coefficient was not statistically significant (Table 5). Unless varus cases, there was a strong positive correlation between X-ray anatomical axis and orthoroentgenogram mechanical axis (r = 0.702. p = 0.001) in valgus group. According to univariate linear regression analysis, 47.0% of variation in orthoroentgenogram mechanical axis was explained by X-ray anatomical axis (Table 5). A 1° increase in X-ray anatomical axis resulted in 1.108° increase in orthoroentgenogram mechanical axis. Figure 5 represents the regression of variables for varus and valgus cases separately. Regression model was


Regression line to estimate orthoroentgenogram mechanical axis by X-ray anatomical axis for varus and valgus groups.
Discussion
Full weight-bearing X-ray of lower limb is considered as gold standards for determining the mechanical axis alignment of the lower limb and short knee AP X-ray fails to be used as a substitute for the same.2–4 However, the disadvantages associated with obtaining the long leg radiograph has promoted routine use of short knee AP X-rays to determine knee alignment for usual purposes. But the usual short knee X-rays provide poor, less reliable, biased correlation due to inability to standardized positioning of patient, radiation streaming angle and so on.
This has ignited a lot of research in the field in an attempt to establish an alternative or substitute clinical method to the full-leg radiograph for determining knee joint alignment5–7 or to derive a definite relationship between anatomical axis of knee measured on usual short Knee AP X-rays and the mechanical axis measured on long leg radiographs. Major studies establishing this relationship can be summarized in Tables 6 and 7.
Summary of correlation coefficients (r) of local anatomical axis of the knee measured on short knee radiograph relative to mechanical axis of lower limb in recent major studies.
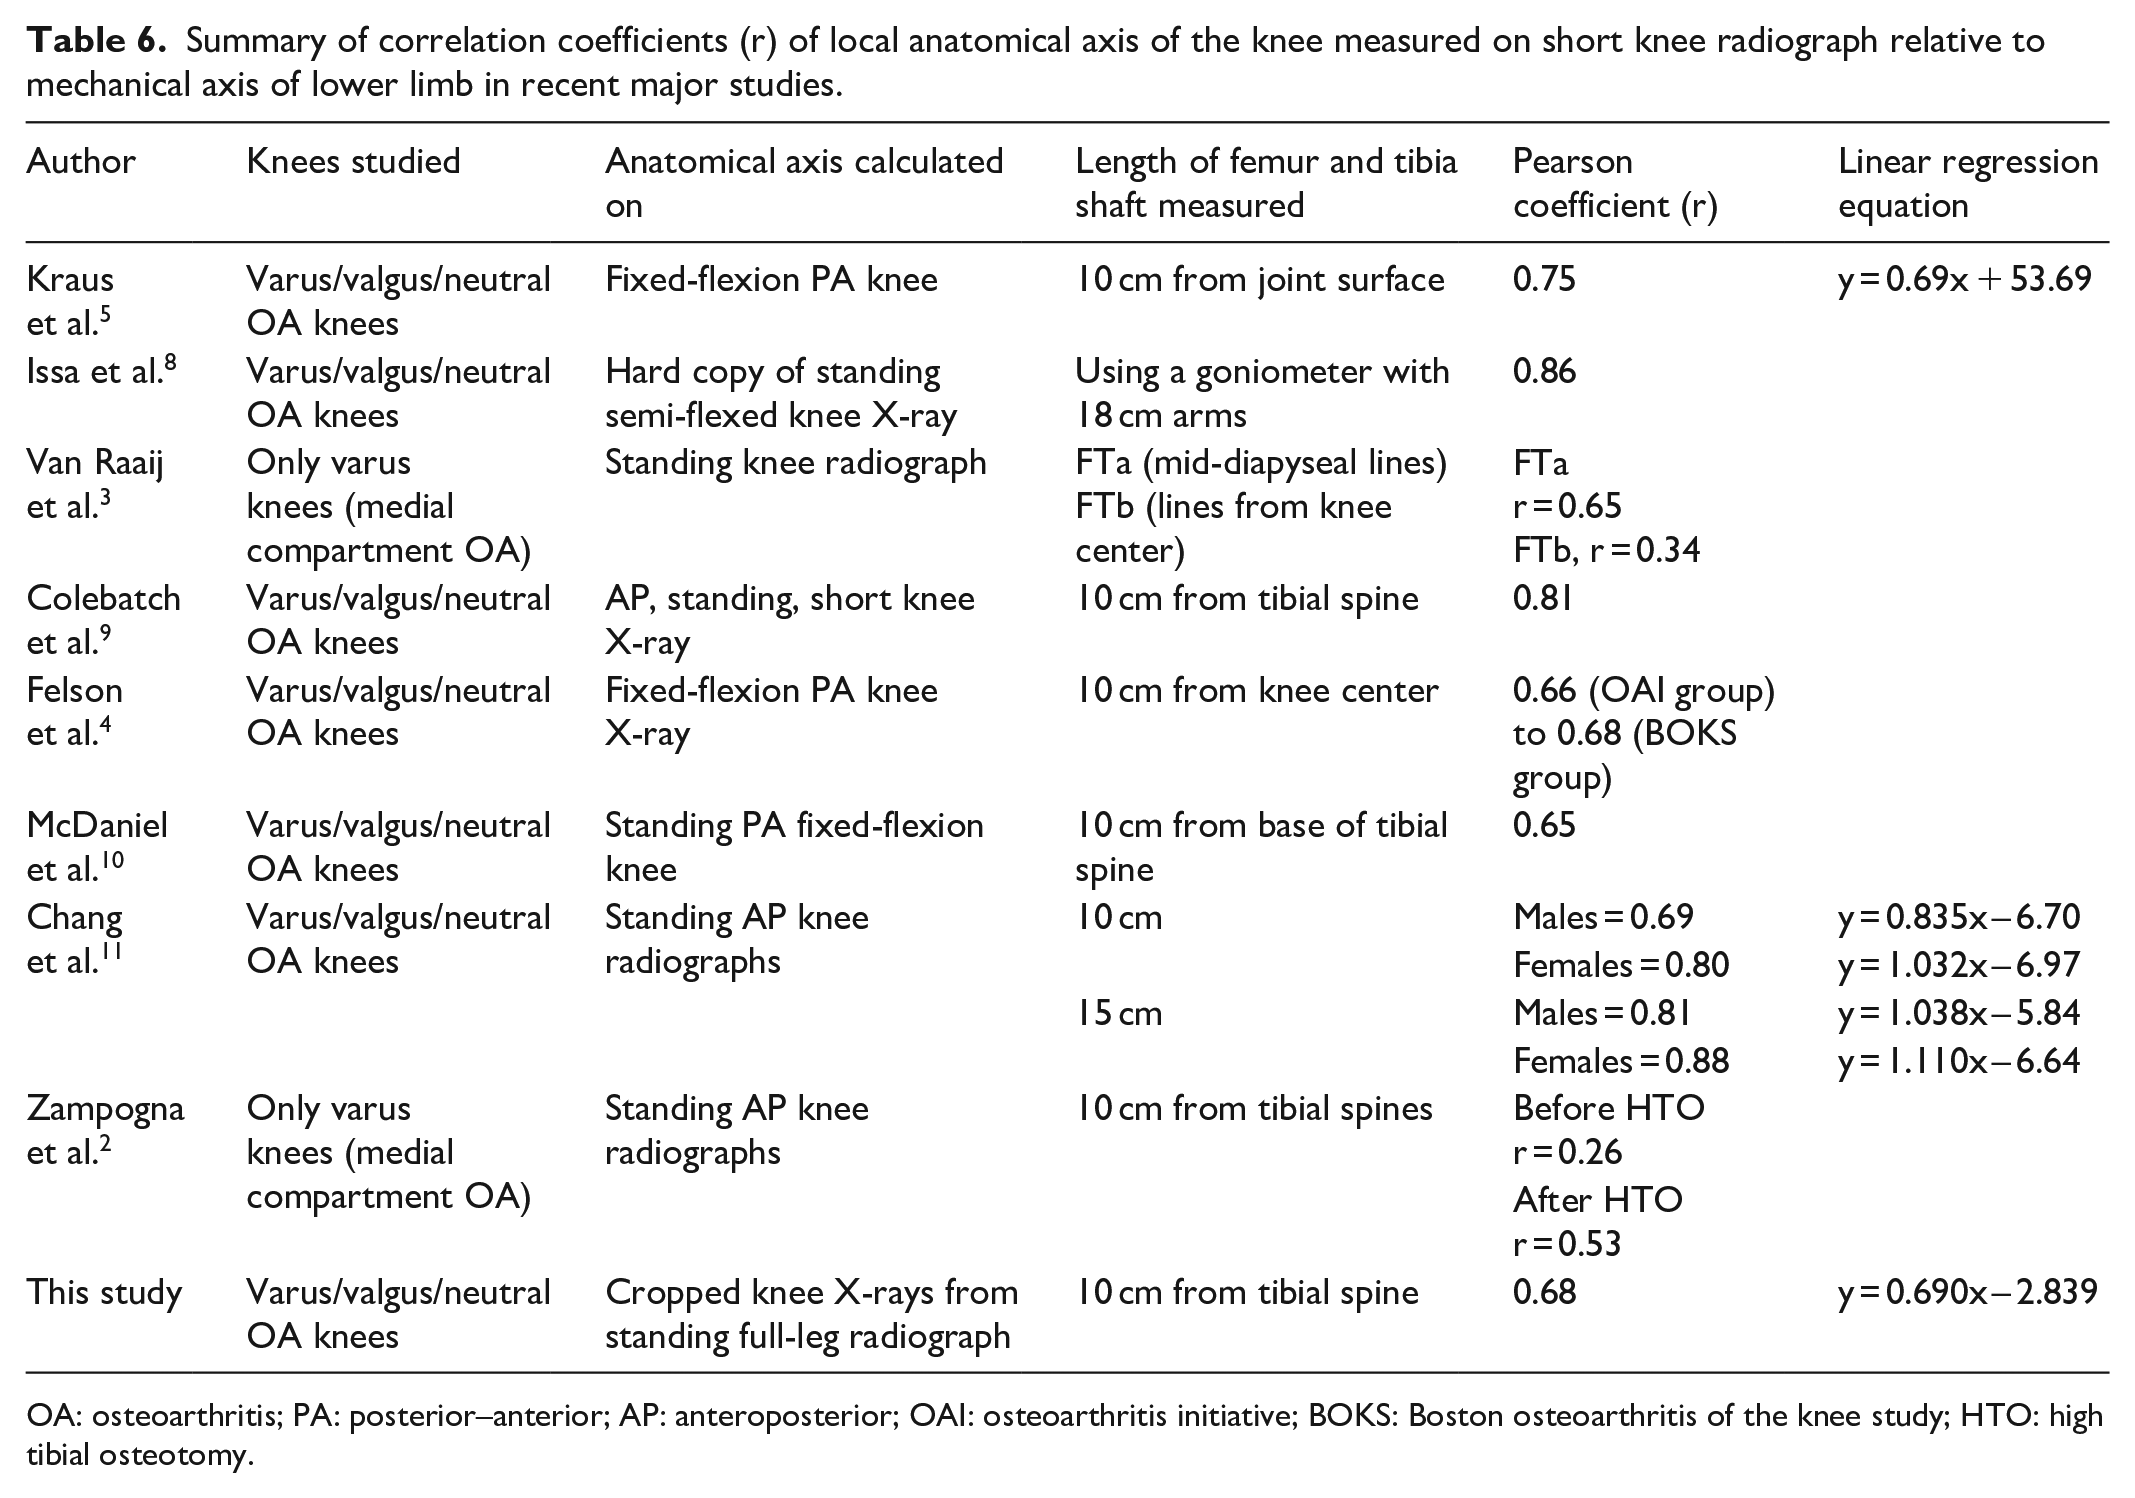
OA: osteoarthritis; PA: posterior–anterior; AP: anteroposterior; OAI: osteoarthritis initiative; BOKS: Boston osteoarthritis of the knee study; HTO: high tibial osteotomy.
Summary of correlation coefficients (r) of local anatomical axis of the knee measured on the full-leg radiographs relative to mechanical axis of lower limb in recent major studies.

OA: osteoarthritis.
As we see from the above tables, the correlation coefficient ranges from 0.26 to 1.0 depending upon the measurements performed on the full-leg radiograph, short knee radiograph, length of shafts measured, reference points considered for drawing anatomical axes, standing or fixed flexion, direction of deformity, and so on. Therefore, in an attempt to estimate the most accurate and standardized relationship eliminating the above biases and to check the reliability of available correlation in the literature, we cropped the standing full-leg radiographs used for mechanical axis measurement to measure the local anatomical axis of the knee. This eliminates the above biases and provides a standard short knee X-ray to correlate the two measurements. The correlation so derived is free of all the differences so far in the literature and provides a crystal clear, definite and objective relationship between the two.
Our findings fairly match with those in the literature, when the anatomical axis was measured on the short knee X-ray for the same shaft lengths (Table 4). The higher correlation derived in the studies measuring the same shaft lengths on full-leg X-rays6,7,12 could be accounted to the fact that the available shafts on the radiographs helped in aligning the measuring arms in a better way.
Sheehy et al. 12 in 2011 were the first to state that the relationship between the two differs depending on the direction and degree of deformity of the lower limb and the lengths of femur and tibia shafts used for measurement. The variation with respect to shaft lengths measured is obvious from the above tables. However, in contrast to Sheehy’s finding of variations with respect to direction of deformity, our results for varus knees are fairly different as shown in Table 8.
Comparison of this study with that of Sheehy et al.

The only difference between the above two measurements being that the anatomical axis was measured by Sheehy on the full-leg radiograph and we measured on short AP X-ray. We did not find any correlation between the two axes for varus knees. Findings for valgus knees were comparable with that of Sheehy.
Anatomical axis angle calculated on the full-leg radiographs has never been compared with that calculated on short knee radiograph 12 with only Kraus 5 mentioning a good correlation between the anatomical axis angle calculated on semi-flexed knee radiographs (PA) and that measured from full-length radiographs (AP). In accordance with the same, we too found a very strong positive correlation between X-ray anatomical axis and orthoroentgenogram anatomical axis. The findings of the two studies can be summarized as follows (Table 9).
Summary of correlation coefficients (r) of anatomical axis of the knee measured on the full-leg radiographs with that calculated on short knee radiograph in recent major studies.

PA: posterior–anterior; AP: anteroposterior.
There was lower correlation found as increased varus and valgus conditions. It was thought, there was no problem in reference points in long leg views but increased reference point variability in short leg views. Therefore, in varus and valgus knees, long leg views may be the only way to detect the exact mechanical and anatomical angle.
We believe that the correlation derived in this study is the highest of its standards and a reliable template for future studies concerning relationships between short knee anatomical axis and the gold standard mechanical axis. Also, for the setups not having facilities to obtain orthoroentgenogram, or patients refusing to undergo the high dose radiation exposure associated with the same, we advise to obtain the short knee X-ray in an orthoroentgenogram fashion, following which our equation can be used to derive the most possible accurate mechanical axis estimation.
The limitations of the study are that we did not calculate the variability of relationship between the two axes with respect to sex. Also, the study was performed in a retrospective setting. Further studies are required for prospective trials to investigate the validity of this relationship.
Conclusion
The standardized correlation derived between the two different techniques for measuring knee alignment is fairly comparable with the studies in past and would serve as a reliable template for future studies concerning relationships between the two, in addition to helping knee surgeons make more reliable and accurate interpretations through local knee axis measurements. Long leg views are still essential to evaluate the mechanical axis of knee.
Footnotes
Authors’ note
The study protocol was approved by the Medical Ethics Committee of the Suleyman Demirel University (Date: 21 December 2016; Decision No: 171) in Isparta, Turkey. The authors certify that they have no affiliations with or financial involvement in any organization or entity with a direct financial interest in the subject matter or materials discussed in the article.
Declaration of conflicting interests
The author(s) declared no potential conflicts of interest with respect to the research, authorship, and/or publication of this article.
Ethical approval
Ethical approval for this study was obtained from *Suleyman Demirel University, Faculty of Medicine Ethics Committee and Institutional Review Board (21.12.2016/171).
Funding
The author(s) received no financial support for the research, authorship, and/or publication of this article.
Informed consent
Written informed consent was obtained from all subjects before the study.