
Abstract
The search for lupus biomarkers to diagnose, monitor, stratify, and predict individual response to therapy is currently more intense than ever before. This effort is essential for several reasons. First, epidemic overdiagnosis and underdiagnosis of lupus, even by certified rheumatologists, leads to errors in therapy with concomitant side effects which may be more serious than the disease itself. Second, identification of lupus flares remains as much an art as it is a science. Third, the capacity to stratify patients so as to predict those who will develop specific patterns of organ involvement is not currently possible but would potentially lead to preventive therapeutic strategies. Fourth, only one new drug for the treatment of lupus has been approved by the US Food and Drug Administration in over 50 years. A major obstacle in this pipeline is the dearth of biomarkers available to prove a patient has responded to an experimental therapeutic intervention. This review will summarize the challenges faced in the discovery and validation of lupus biomarkers, the most promising lupus biomarkers identified to date, and the promise of future directions.
Introduction
Systemic lupus erythematosus (SLE) is arguably the most serologically and clinically diverse autoimmune disease, with immunopathogenic abnormalities continuously being uncovered and clinical manifestations widely varying in individual patients. Immune dysregulation leads to excess production of autoantibodies and immune complexes, excess complement activation, and insidious tissue inflammation in patients with SLE, which together cause a clinical syndrome with multi-organ involvement and hard-to-predict courses [Crispin et al. 2010b; Rahman and Isenberg, 2008; Tsokos, 2011]. Owing to its complex nature, SLE remains one of the greatest challenges to both investigators and physicians.
Over the past several decades, tremendous enthusiasm and efforts have been devoted to tackling the numerous challenges ranging from understanding the etiopathogenesis of SLE, through the development of diagnostic tests and biomarkers, to improved care for patients with SLE. Although significant progress has been made, there are still many unmet needs in lupus research and patient care. Fundamental to the unmet needs is the lack of reliable lupus biomarkers for diagnosis, monitoring, stratification, and prediction of response to therapy.
Based on scientific and clinical rationale, a biomarker is defined as a measurement, including but not limited to a genetic, biological, biochemical, molecular, or imaging event whose alterations correlate with the pathogenesis and/or manifestations of a disease and can be evaluated qualitatively and/or quantitatively in laboratories [Illei et al. 2004a, 2004b]. Given the rapid advance in the understanding of SLE pathogenesis and development of new technologies, an impressive spectrum of SLE biomarkers has been accrued during the past few years. A comprehensive review of these biomarkers will be beyond the scope of this article; readers can reference several recently published reviews [Ahearn et al. 2012; Herbst et al. 2012]. Instead, this report will focus on select groups of potential biomarkers that have been developed based on or in response to: (1) recent understanding of SLE pathogenesis (e.g. epigenetics, cytokines) or cutting-edge technologies (e.g. proteomics); (2) clinical importance in SLE management (e.g. lupus nephritis); and (3) emerging appreciation of the need of composite panels, rather than individual lupus biomarkers. Finally, we will discuss the current limitations and future directions for discovery and validation of lupus biomarkers.
Biomarkers originated from better understanding of SLE pathogenesis
The pathogenesis of SLE is multifactorial and multistaged, with various genetic, epigenetic, environmental, gender, and immunoregulatory factors contributing to the susceptibility, onset, progress, and prognosis of the clinical disease in a given patient [Crispin et al. 2010b; Manderson et al. 2004; Mok and Lau, 2003; Moser et al. 2009; Sarzi-Puttini et al. 2005]. Genetic factors clearly confer susceptibility of an individual to the development of SLE. In rare cases, the development of SLE is due to the deficiency of a single gene product (e.g. complement C1q) [Pickering et al. 2000]. Much more commonly, variations (single nucleotide polymorphisms, gene copy numbers, etc.) at multiple genetic loci are believed to increase the risk of SLE in a hierarchical interactive manner [Moser et al. 2009; Nath et al. 2004]. Although extensive studies have associated many common genetic variants with SLE [Deng and Tsao, 2010; Flesher et al. 2010], the cumulative effect size of the loci identified so far accounts for only 15–20% of the heritability of SLE [Manolio et al. 2009]. The variations potentially underlying the remaining 75–80% of the heritability appear to be missing.
Epigenetics-related biomarkers
The ‘missing heritability’ has led to a renewed appreciation of epigenetic factors. Because SLE affects predominantly women of child-bearing age, it is widely accepted that female hormones contribute to the development of SLE through mechanisms that are not fully elucidated [Weckerle and Niewold, 2011]. However, epigenetically dysregulated expression of genes located on chromosome X, e.g., the CD40 Ligand (CD40L) gene, may also contribute to the female prevalence of SLE [Lu et al. 2007].
Epigenetics refers to heritable modifications that regulate gene expression without alterations in DNA sequence [Bird, 2007]. Epigenetic effects, which are heritable (but specific to different cells), stable (but reversible), and subject to environmental influences, may account for several perplexing observations such as the incomplete concordance of SLE in monozygotic twins [Hughes and Sawalha, 2011; Javierre et al. 2010; Jeffries and Sawalha, 2011; Shen et al. 2012]. Common epigenetic mechanisms, including DNA methylation, histone modifications, and microRNA-mediated regulation, play important roles in modulating gene expression over the cell cycle, lineage commitment, and cellular function throughout the body [Fraga et al. 2005; Laurent et al. 2010]. The immune system, naturally, is also under tight control at the epigenetic level [Allan et al. 2012; Dai and Ahmed, 2011; Fields et al. 2002; Hughes et al. 2010; Rauch et al. 2009; Renaudineau and Youinou, 2011]. Therefore, aberrant epigenetic regulation may contribute to the complex array of immune abnormalities and influence the disease manifestations in lupus patients (Table 1).
Epigenetic alterations and potential epigenetic biomarkers identified in SLE.

IFN, interferon; KIR, killer immunoglobulin-like receptor; KLF, Kruppel-like factor; MMP, matrix metalloproteinase PBMC, peripheral blood mononuclear cell; RANTES, regulated on activation normal T cell expression and secreted; RUNX, runt-related transcription factor; SLE, systemic lupus erythematosus
DNA methylation
The expression of a gene is initiated by the access of transcription factors to the specific DNA region. Methylation of the promoter and cytosine-P-guanosine (CpG)-rich regions (CpG islands) of genomic DNA by DNA methyl transferases (DNMTs) prevents the binding of transcription factors and is an important negative regulator of gene expression. Decreased methylation (hypomethylation) of DNA will lead to aberrant gene expression. Global DNA hypomethylation in CD4 T cells has long been observed in SLE, initially in drug-induced SLE and later in idiopathic SLE [Cornacchia et al. 1988; Hughes et al. 2010; Richardson et al. 1990]. It is now known that hydralazine and procainamide inhibit DNA methylation and thus may induce SLE in some individuals [Cornacchia et al. 1988]. Hypomethylation of the regulatory regions of several genes known to be involved in the pathogenesis of SLE, such as CD70 (a costimulatory molecule), CD40L (CD154; also a costimulatory molecule), ITGAL [CD11a; a subunit of lymphocyte function-associated antigen 1 (LFA-1)], perforin (a cytolytic protein), killer immunoglobulin-like receptors (KIRs), interleukin (IL)-10, and IL-13 have been reported [Basu et al. 2009; Kaplan et al. 2004; Liu et al. 2009; Lu et al. 2002, 2005, 2007; Oelke et al. 2004; Zhao et al. 2010a]. Consequently, DNA hypomethylation may cause increased cytokine production and hyperactivity of CD4 T cells and increased immunoglobulin production by B cells. The degree of reduced DNA methylation and overexpression of proteins encoded by the hypomethylated genes in SLE T cells have been reported to correlate with disease activity [Lu et al. 2002].
It has been a puzzle that monozygotic twins are at increased risk to develop SLE but the concordance rate has never reached 100% [Deapen et al. 1992]. A recent genome-wide DNA methylation study showed significant epigenetic variation in leukocytes derived from disease-discordant monozygotic twins; specifically differential methylation of 49 autoimmunity-relevant genes in the white blood cell population between the affected twins and their healthy monozygotic siblings were identified [Javierre et al. 2010]. This study lends support to the possibility that variations in epigenetic modifications may drive the difference in SLE development during the life course of monozygotic twins. Jeffries and colleagues recently conducted a case-control study utilizing high-throughput methylation arrays to scan 27,578 CpG sites in the promoter region of 14,495 genes [Jeffries et al. 2011]. They identified 236 hypomethylated sites (representing 232 genes) and 105 hypermethylated sites (representing 104 genes) in CD4 T cells of SLE patients. A more recent genome-wide study reported that the methylation status of the IL-10 and IL-1R2 genes was significantly reduced in SLE patient samples compared to healthy control samples. Moreover, the SLE patients with hypomethylated IL-10 and IL-1R2 genes appeared to have higher disease activity [Lin et al. 2012]. These studies, taken together, suggest that genome-wide DNA methylation studies may aid in identifying potential biomarkers that may correlate with the pathogenic process and/or disease activity of SLE.
Histone modifications
Histone proteins are the major component of nucleosomes (the basic subunit of chromatin) and help determine which part of the chromatin is accessible for active transcription [Luger et al. 2012; Williamson and Pinto, 2012]. Covalent modification of histone proteins may alter chromatin structure (but not the DNA sequence) and, hence, regulate gene expression at the epigenetic level. For example, acetylation and methylation of a specific lysine residue (lysine 9) on histone 3 (H3K9) have been shown to enhance or repress gene transcription, respectively [Roh et al. 2005; Snowden et al. 2002; Wilson et al. 2009]. Reduced global levels of methylated H3K9 and H3 acetylation have been reported in CD4 T cells of SLE patients [Hu et al. 2008]. In addition, hyperacetylation of histone 4 (H4) and overexpression of several genes have been reported in monocytes of SLE patients [Zhang et al. 2010]. These findings point to widespread variations in histone modifications in immune cells of SLE patients and such changes may serve as potential biomarkers for elucidating the pathogenesis of SLE.
MicroRNAs
MicroRNAs (miRNAs or miR) are recently discovered, short (20–24 base pairs in length), noncoding ribonucleic acids (RNAs) that play important roles in the regulation of gene expression post-transcriptionally [Bartel, 2004; Carthew and Sontheimer, 2009; Fabian et al. 2010]. miRNAs bind to homologous sequences present in messenger RNA (mRNA) transcripts, and regulate gene expression by directly cleaving the target mRNA or effectively blocking the subsequent translation of the target mRNA. The miRNA-mediated regulatory network is extremely complex: a single miRNA may regulate hundreds to over thousands of mRNAs, and a single mRNA may be targeted by multiple miRNA. The production of miRNAs themselves is also under tight genetic as well as epigenetic regulations.
During the last several years, accumulating evidence has indicated that miRNAs are critical not only for the development of the immune system, but also for regulation of adaptive and innate immune responses [Baltimore et al. 2008; Xiao and Rajewsky, 2009]. Therefore, not surprisingly, abnormalities in the expression and functioning of miRNAs have been identified as part of the pathogenesis of autoimmune diseases including SLE [Dai and Ahmed, 2011; Shen et al. 2012] . Dai and colleagues first reported the identification of six miRNAs whose expression was altered in the peripheral blood mononuclear cells (PBMCs) prepared from patients with SLE, but not patients with idiopathic thrombocytopenic purpura [Dai et al. 2007]. Since then, several investigators have conducted and reported studies aimed at detecting and profiling miRNA expression in blood cells (PBMCs, T cells, etc), body fluid (serum, plasma, urine, etc.), and tissues taken from patients with SLE [Dai et al. 2009a; Pan et al. 2010; Tang et al. 2009; Te et al. 2010; Zhao et al. 2010b, 2011].
miR-146a, a miRNA targeting signaling proteins and thus negatively regulating innate immune responses, has been reported to be underexpressed in CD4 T cells of patients with SLE [Tang et al. 2009]. In that study, it was shown that reduced miR-146a expression led to activation of the type 1 interferon (IFN) pathway and that miR-146a levels correlated inversely with SLE disease activity. Another miRNA, miR-125, was also reported to be underexpressed in CD4 T cells of patients with SLE [Zhao et al. 2010b]. Decreased levels of miR-125a appeared to lead to increased production of an inflammatory chemokine RANTES. Pan and colleagues reported that miR-21 and miR-148a were upregulated in CD4 T cells prepared from both patients with SLE and MRL-lpr mice [Pan et al. 2010]. These investigators subsequently showed that miR-148a directly and miR-21 indirectly target DNA methyltransferases 1 (DNMT1), suggesting their role in regulating DNA methylation in SLE CD4 T cells [Pan et al. 2010]. Indeed, overexpression of miR-148a and miR-21 in CD4 T cells resulted in DNA hypomethylation and increased expressed of CD70 and LFA-1. The possibility of intricate cross-regulations of miRNA and DNA methylation has subsequently been confirmed in a study by Zhao and colleagues. They reported that miR-126 was overexpressed in SLE CD4 T cells [Zhao et al. 2011]. It was further shown that miR-126 targets DNMT1 mRNA and reduced DNMT1 protein expression. Similarly, overexpression of miR-126 in CD4 T cells from healthy individuals led to hypomethylation and consequently overexpression of CD11a (a subunit of LFA-1) and CD70 [Zhao et al. 2011].
Recently, systematic, microarray-based studies of miRNA expression have been initiated. Te and colleagues performed a study that investigated the expression profile of miRNA in PBMCs and Epstein–Barr virus-transformed B-cell lines derived from SLE patients with nephritis or without nephritis [Te et al. 2010]. They found that 29 and 50, out of 850 tested, miRNAs were differentially expressed in SLE patients with nephritis of African-American ancestry and of European-American ancestry, respectively. Among these miRNAs, 18 miRNAs were differentially expressed in patients of both racial groups. Another recent study, comparing miRNA expression profiles in PBMCs of SLE patients and healthy controls, showed differential expression of 27 miRNAs out of 365 analyzed [Stagakis et al. 2011]. It was further shown that the levels of miR-21, miR-25, miR-106b, and miR-148b correlated positively with SLE disease activity, whereas the levels of miR-196a and miR-379 negatively correlated with SLE disease activity. This latter finding suggests a potential role for miRNA profiling as disease activity biomarkers for SLE.
In addition to investigation of miRNAs in blood cells, some investigators also attempted to detect cell-free miRNAs in serum and urine samples from patients with SLE [Wang et al. 2011, 2012]. Wang and colleagues reported reduced levels of cell-free miR-146a and miR-155 circulating in the serum of patients with SLE and elevated levels of miR-146a in the urine of patients with SLE, compared to healthy controls. Furthermore, serum miR-146a levels correlated inversely with SLE disease activity and the degree of proteinuria, whereas serum miR-146a and miR-155 levels correlated positively with glomerular filtration rate [Wang et al. 2011]. The same group subsequently conducted a profiling study of circulating miRNAs in patients with SLE, patients with rheumatoid arthritis, and healthy controls. They found that miR-126 was specifically elevated in the blood of patients with SLE, whereas miR-125a-3p, miR-155, and miR-146a were significantly reduced in patients with SLE [Wang et al. 2012]. Several other miRNAs (miR-16, miR-223, miR-451, miR-21) were found to be upregulated in both patients with SLE and patients with rheumatoid arthritis. The bioinformatics exploratory analysis implied that most dysregulated circulating miRNAs may be involved in regulating intracellular signal transduction. Taken together, these results suggest that cell-free miRNAs in body fluids may serve as potential biomarkers for SLE.
Recent studies have identified numerous miRNAs that are dysregulated in human patients with SLE and lupus-prone mice. However, it should be cautioned that the results from different studies are not always consistent or reproducible. These discrepancies may originate from the nature of the studies (cross-sectional, small sample size, etc.) and differences in the patient populations (ethnicity, disease severity, duration, manifestations, cohort size, etc.) and the detection methods used. Nevertheless, miRNAs represent a promising group of novel biomarkers for SLE and warrant further investigation.
Cytokine and chemokine biomarkers
With increasing numbers of cytokines and chemokines identified and understanding of cytokine biology improved, these molecules have emerged as important players in the pathogenesis of SLE or as indirect markers reflecting dysregulated immune responses in SLE [Adhya et al. 2011; Apostolidis et al. 2011; Davis et al. 2011] (Table 2). This emerging role of cytokines and chemokines has in turn sparked growing attention on their potential as biomarkers and therapeutic targets in SLE.
Cytokine and chemokine abnormalities associated with SLE.
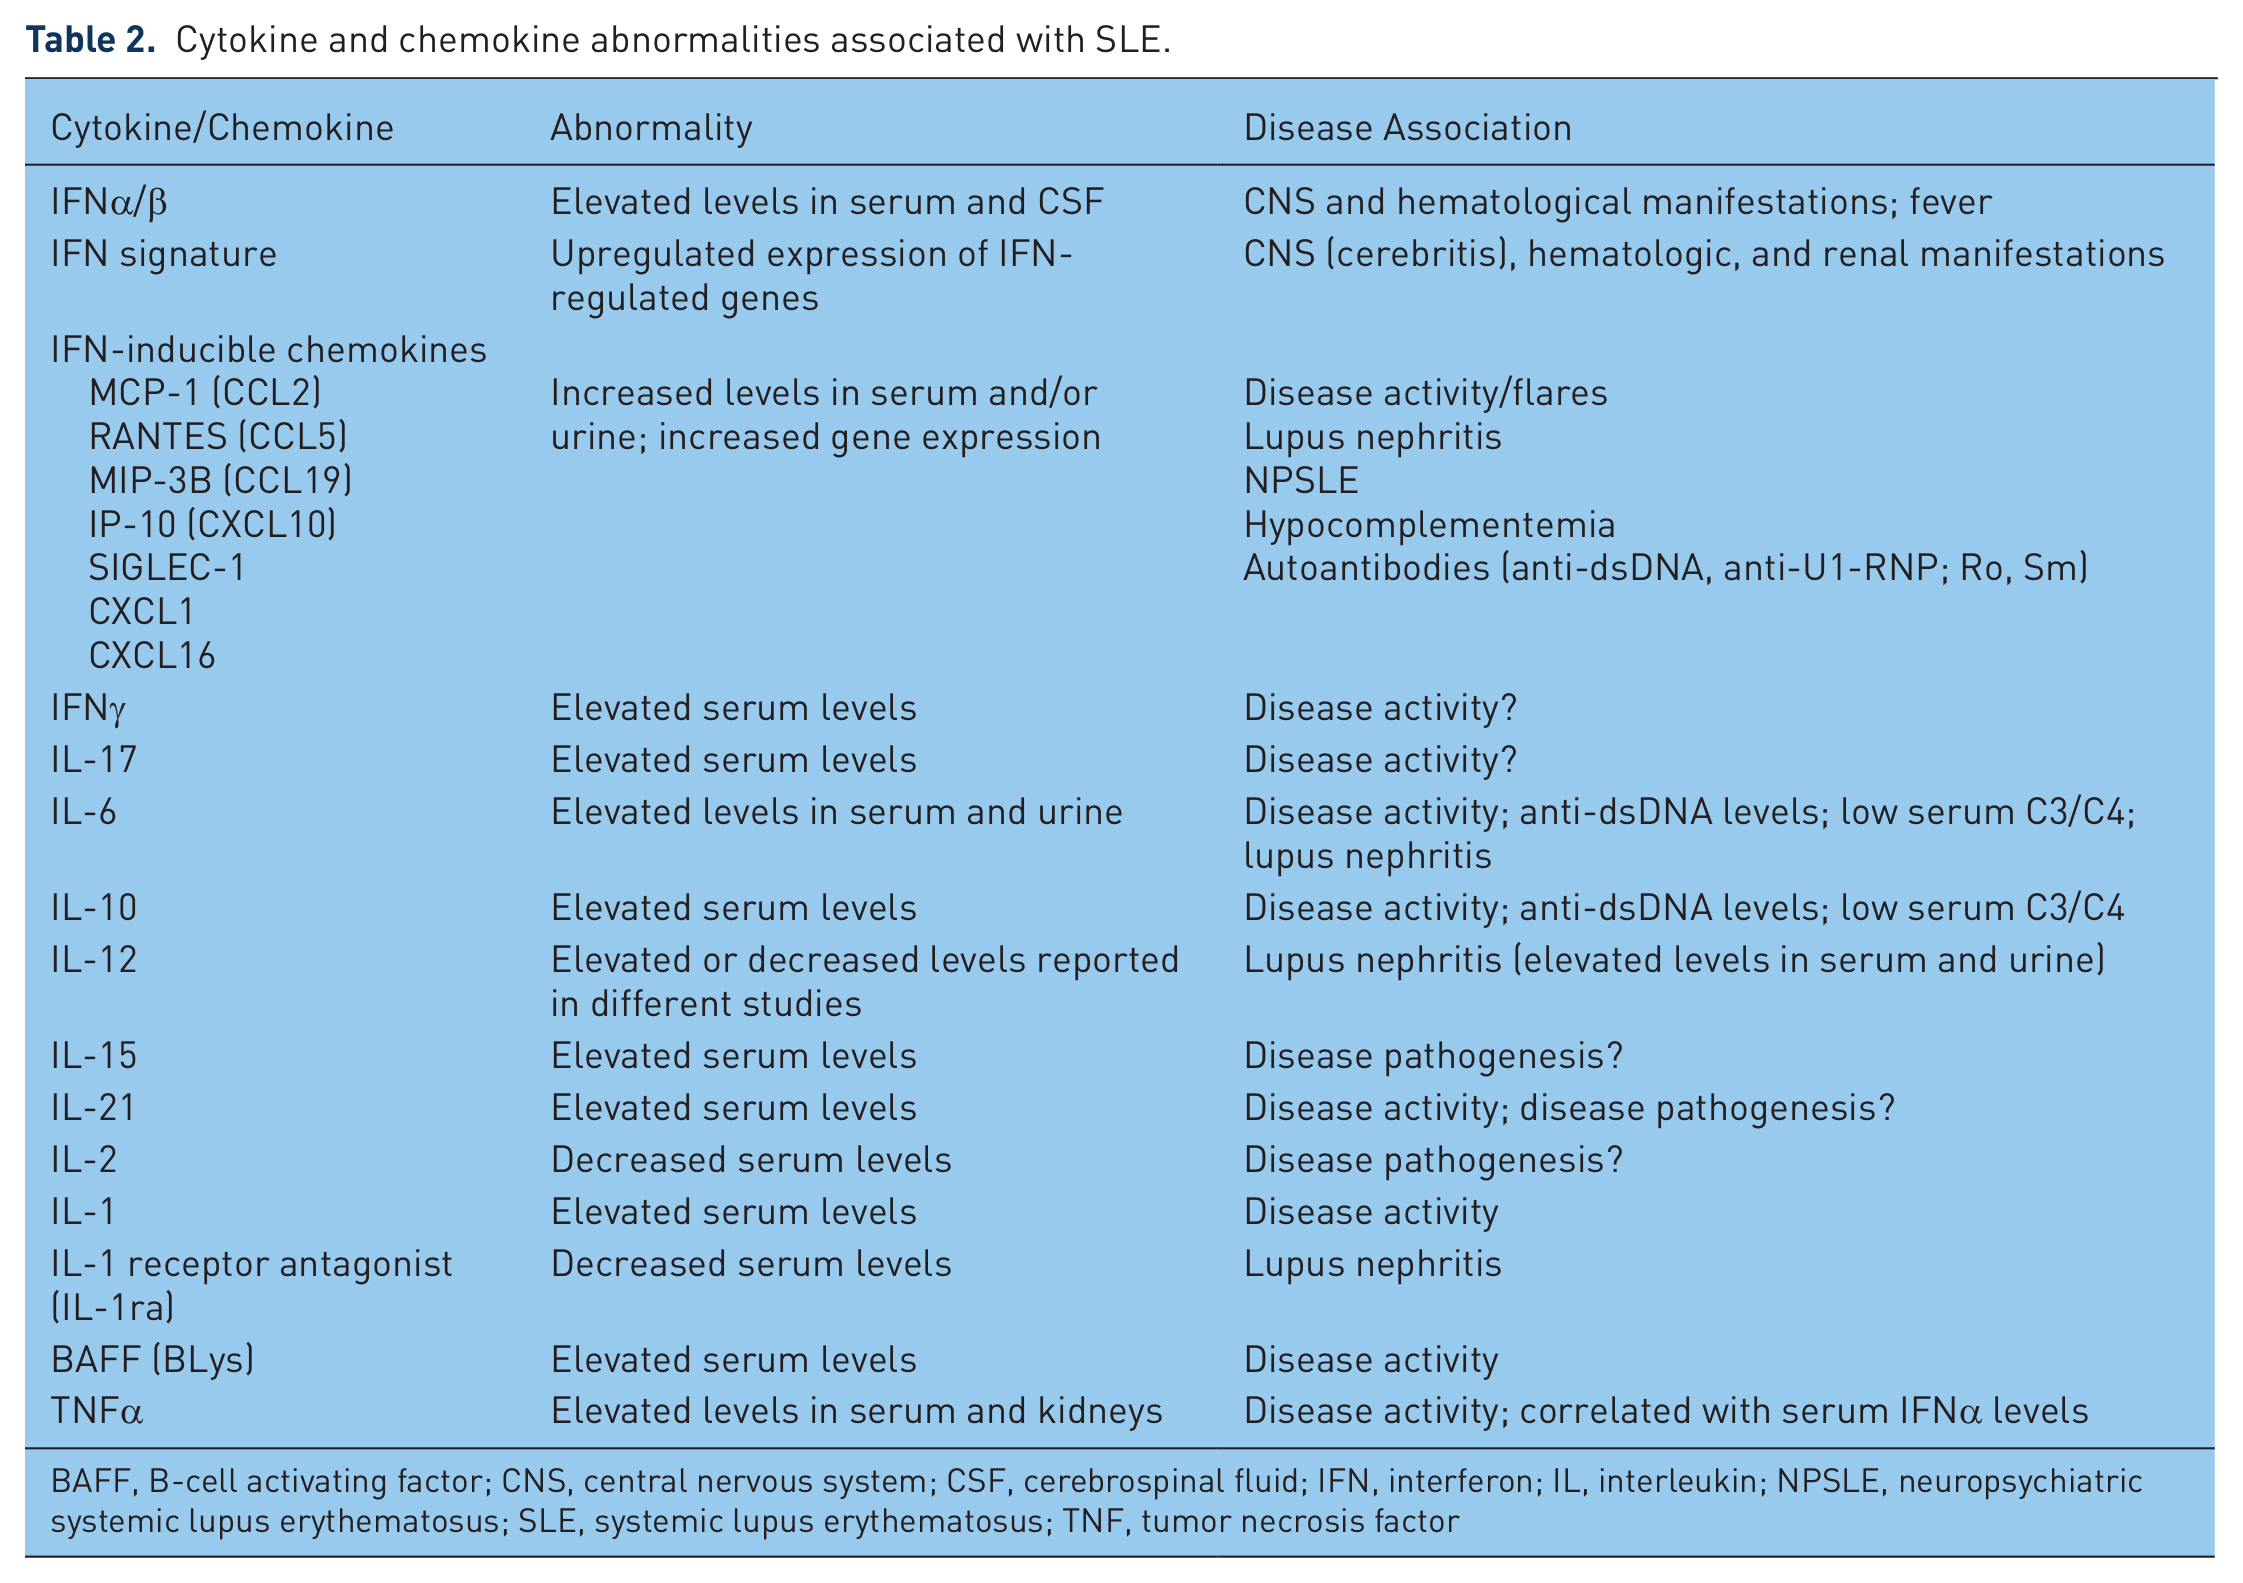
BAFF, B-cell activating factor; CNS, central nervous system; CSF, cerebrospinal fluid; IFN, interferon; IL, interleukin; NPSLE, neuropsychiatric systemic lupus erythematosus; SLE, systemic lupus erythematosus; TNF, tumor necrosis factor
Type I IFNs and IFN-inducible genes and chemokines
Numerous studies, both cross-sectional and longitudinal, have identified various cytokines and chemokines that are associated with SLE disease activity and clinical manifestations. Prominent among these candidate biomarkers is the type 1 IFN system (e.g. IFNα and IFNα-inducible genes and proteins) [Crow, 2007; Elkon and Wiedeman, 2012; Obermoser and Pascual, 2010]. As early as in 1970s, IFNα levels were shown to be elevated in the serum of SLE [Hooks et al. 1979; Ytterberg and Schnitzer, 1982]. The role of IFNα, however, was left underappreciated until the recent decade when gene expression profiling techniques and multiplexed serologic tests advanced considerably. Baechler and colleagues pioneered the use of DNA microarray techniques to study gene expression profiles in PBMCs of SLE patients and found a striking pattern of upregulated IFN-inducible genes (termed the ‘IFN signature’) in a subset of SLE patients [Baechler et al. 2003]. They further observed that the IFN signature correlated with more severe disease, such as cerebritis, nephritis, and hematological involvement, in those patients. Other investigators have subsequently reported similar findings, including significant associations of enhanced expression of IFN-inducible genes and/or serum levels of IFN-inducible chemokines with increased disease activity, organ involvement, hypocomplementemia, and the presence of autoantibodies specific for dsDNA and RNA-binding proteins (Ro, U1-RNP, and Sm), in both adult and pediatric SLE patients [Bauer et al. 2006; Bennett et al. 2003; Feng et al. 2006; Kirou et al. 2005; Nikpour et al. 2008; Vila et al. 2007]. Two independent studies utilizing transcriptome analysis and traditional techniques [enzyme-linked immunosorbent assay (ELISA) and flow cytometry] demonstrated that IP-10 and sialic acid-binding Ig-like lectin 1 (SIGLEC-1) were among the most prominent type 1 IFN-regulated genes/proteins [Biesen et al. 2008; Rose et al. 2012]. Increased serum levels of IP-10 and SIGLEC-1 were detected in 50% and 86%, respectively, of patients with active SLE [Rose et al. 2012]. The serum IP-10 and SIGLEC-1 levels correlated positively with disease activity and anti-dsDNA antibody levels, but inversely with serum complement levels [Biesen et al. 2008]. A pathologic role for IFNα in neuropsychiatric SLE (NPSLE) has recently been postulated [Karageorgas et al. 2011]. This postulation is based on an early study in which elevated IFNα levels in the cerebrospinal fluid (CSF) were detected in some patients with NPSLE [Winfield et al. 1983] and a recent study reporting that CSF from patients with NPSLE was capable of inducing higher IFNα production in vitro compared with other disease controls [Santer et al. 2009].
The above-mentioned cross-sectional studies have recently been followed by longitudinal studies. Bauer and colleagues measured IFN-regulated chemokine levels in 267 patients with SLE followed for 1 year (1166 total visits) [Bauer et al. 2009]. Serum levels of CXCL10 (IP-10), CCL2 (MCP-1), and CCL19 (MIP-3B) were found to correlate strongly with lupus activity, rising at flare and decreasing with remission, and to perform better than currently available laboratory tests. To further determine whether changes in the IFN signature expression correlate with clinical outcomes such as disease flares, a Canadian research group investigated the expression levels of selected IFNα-inducible genes, serological variables, and clinical disease activity [as measured by the Systemic Lupus Erythematosus Disease Activity Index (SLEDAI)] in 94 SLE patients over a period of 3–12 months [Landolt-Marticorena et al. 2009]. When analyzed cross-sectionally at a single timepoint, expression levels of IFNα-inducible genes were found to be significantly elevated and associated with high SLEDAI scores, active renal disease, decreased C3 levels, and positive anti-dsDNA and anti-RNA-binding protein autoantibodies. However, when followed over time, no significant correlation between changes in IFNα-inducible gene expression and changes in disease activity, C3 levels, or autoantibody levels was observed. Similarly, Petri and colleagues conducted a study combining both cross-sectional and longitudinal analysis of INFα-regulated gene expression in peripheral blood cells of patients with SLE [Petri et al. 2009]. A cross-sectional analysis of 66 patients with SLE showed that higher IFN-response (IFNr) scores (calculated based on the expression of three INFα-regulated genes) were associated with greater disease activity. However, the IFNr scores did not significantly differ in 15 patients who were studied before and during flares. An extended longitudinal follow up of 11 patients also showed little change in IFNr scores over time, even with dynamic disease activity changes. These results demonstrate that although IFNr scores appear to be associated with SLE disease activity overall, the IFNr scores of individual patients do not correlate with changes in disease activity.
Taken together, the candidacy of the IFN gene signature/IFN-inducible proteins as biomarkers for monitoring and/or predicting SLE disease activity needs to be further investigated with large-scale multicenter trials.
Interleukin-17
A growing list of cytokines and soluble forms of cytokine receptors have been identified as potential biomarkers of SLE disease activity in many cross-sectional studies with limited cohort sizes. Among them, cytokines of the IL-17 family have received recent attention [Crispin and Tsokos, 2010a]. The IL-17 family consists of IL-17A, IL-17-B, IL-17C, IL-17D, and IL-17F, with IL-17A being the most prominent and well characterized member of the family [Ouyang et al. 2008]. Elevated serum levels of IL-17A and increased numbers of IL-17-producing cells have been reported in patients with SLE [Crispin et al. 2008; Doreau et al. 2009; Shah et al. 2010; Wong et al. 2000; Yang et al. 2009]. IL-17A is mainly produced by CD4+ T helper 17 (TH17) cells [Korn et al. 2009], γδ T cells [O’Brien et al. 2009], and CD4-CD8- [double negative (DN)] T cells [Crispin et al. 2008; Crispin and Tsokos, 2010b]. In SLE, TH17 cells and particularly the DN T cells can infiltrate tissues (e.g. the kidneys) and stimulate stromal cells and other immune cells to produce additional cytokines (e.g. IL-6, granulocyte colony stimulating factor, and granulocyte monocyte colony stimulating factor), thereby promoting tissue inflammation and injury [Crispin et al. 2008; Ouyang et al. 2008; Zhang et al. 2009]. Although elevated serum IL-17 levels have been reported in patients with SLE, the association between elevated IL-17 levels and SLE disease activity is unclear. The potential of IL-17 as an SLE biomarker, therefore, awaits further investigation.
B-cell activating factor
B-cell activating factor [BAFF; also known as B lymphocyte stimulating factor (BLys), TALL-1, or TNFSF13B] is expressed as a transmembrane protein on monocytes, macrophages, and monocyte-derived dendritic cells [Mackay and Schneider, 2009; Moore et al. 1999]. A soluble form of BAFF, cleaved from the cell surface, is biologically active and critical for B-cell growth and survival [Nardelli et al. 2001]. Several cross-sectional studies showed that approximately 30% of SLE patients had significantly elevated circulating levels of BAFF/BLys [Cheema et al. 2001; Zhang et al. 2001]. Elevated BAFF/BLys levels appeared to correlate with increased total IgG and autoantibody (particularly anti-dsDNA) levels [Cheema et al. 2001; Pers et al. 2005], and, in some studies, with increased disease activity (as measured by SLEDAI) [Becker-Merok et al. 2006]. A recent study has shown that excessive productions of IFNγ by activated T cells may be responsible for the induction of BAFF/BLyS production by monocytes and macrophages in lupus patients [Harigai et al. 2008].
To delineate the role of BAFF/BLyS in the long-term immune dysregulation in SLE, Stohl and colleagues conducted a longitudinal observational study in which 68 SLE patients were followed regularly for disease activity (measured using SLEDAI) and serum BAFF/BLyS levels over a period of 147–420 days (median 369 days) [Stohl et al. 2003]. They found that SLE patients exhibited considerable variability in serum BAFF/BLyS levels with 50% of patients having persistently or intermittently elevated serum BAFF/BLyS levels over the follow-up period. However, changes in serum BAFF/BLyS levels did not correlate with changes in disease activity and/or specific organ involvement in individual patients. In another study, Becker-Merok and colleagues studied clinical disease activity, serological variables, and serum BAFF/BLyS levels in 60 patients with RA and 42 patients with SLE, 19 of whom were followed prospectively over a period of approximately 16 months [Becker-Merok et al. 2006]. These investigators found that considerably more SLE patients had significantly higher serum BAFF/BLyS levels than did RA patients. They found that serum BAFF/BLyS levels generally correlated with SLEDAI scores in SLE patients in cross-sectional comparison, but did not correlate with changes in disease activity over time.
Since BAFF/BLyS is not known to have direct or immediate proinflammatory activities, changes in serum BAFF/BLyS levels are unlikely to trigger acute inflammatory reactions and disease manifestations. Therefore, the reported lack of correlations between changes in BAFF/BLyS levels and changes in disease activity in SLE patients might not be surprising. However, it is possible that an increase in disease activity may lag behind increases in circulating BLyS levels due to indirect or ‘delayed’ effects of BAFF/BLyS in the systemic immune-inflammatory reactions of SLE. Petri and other investigators have recently conducted a prospective multicenter study that evaluated 254 SLE patients every 3–6 months over a 2-year period [Petri et al. 2008]. The results showed that plasma BAFF/BLyS levels were associated with anti-dsDNA levels and disease activity [measured using Safety of Estrogens in Lupus Erythematosus National Assessment (SELENA)-SLEDAI]. Interestingly, multivariate analyses showed that a greater increase in the SELENA-SLEDAI score in the current visit was significantly associated with higher BAFF/BLyS levels at the previous visit. Similarly, a greater increase in the BAFF/BLyS level from the previous visit was associated with a greater SELENA-SLEDAI score in the subsequent follow-up visit. These results suggest a ‘delayed’ relationship between circulating BAFF/BLyS levels and SLE disease activity. Most recently, James and colleagues reported that BAFF/BLyS levels were associated with increased lupus disease activity in White but not in African-American patients who had higher BAFF/BLyS levels regardless of disease activity [Ritterhouse et al. 2011].
Other cytokines
Other cytokines, such as IL-6, IL-10, IL-12, IL-15, and IL-21, have also been implicated in the pathogenesis of SLE and proposed as potential biomarkers for SLE disease activity. A study by Chun and colleagues reported that patients with SLE had higher serum levels of IL-1, IL-10, IL-12, and IFNγ, but lower level of IL-2, than healthy controls [Chun et al. 2007]. Moreover, serum IL-6 and IL-10 levels correlated positively with SLEDAI scores and anti-dsDNA titers but negatively with serum C3 and C4 levels. IL-12 is capable of stimulating the differentiation of T cells into TH1 cells that produce IFNγ. Therefore, IL-12 may be involved in the pathogenesis of SLE indirectly via its effects on cells expressing IL-12 receptors (IL-12R). A recent study reported that patients with SLE have a higher copy number of the IL-12RB gene as compared with healthy controls [Yu et al. 2011]. A higher copy number of the IL-12RB gene may confer increased sensitivity to IL-12 and hence increased IFNγ production by immune cells. IL-27, a new member of the IL-12 cytokine family, can synergize with IL-12 to induce IFNγ production [Awasthi et al. 2007]. It has been reported that serum IL-27 levels were lower in SLE patients than in healthy individuals [Li et al. 2010]. IL-15 and IL-21 are members of the IL-2 cytokine family. IL-15 is involved in the expansion and homeostasis of T cells and also capable of promoting immunoglobulin isotype switching in B cells [Gabay and McInnes, 2009]. Increased serum levels of IL-15 have been reported in SLE patients [Aringer et al. 2001]. Different from IL-15, IL-21 is also involved in B-cell activation and activation-induced death of B cells [Ettinger et al. 2008]. Decreased IL-21R expression on B cells has been associated with high autoantibody production and nephritis in SLE patients [Mitoma et al. 2005].
T-cell-related biomarkers
T cells play crucial effector and regulatory roles in virtually any immune-inflammatory response. T cells of patients with SLE display numerous phenotypic and functional abnormalities, thereby contributing to SLE pathogenesis and serving potentially as a rich source of SLE biomarkers [Hoffman, 2004; Moulton and Tsokos, 2011] (Table 3).
Novel T-cell-related SLE biomarkers.

IL, interleukin; KIR, killer immunoglobulin-like receptor; SLE, systemic lupus erythematosus; SLEDAI, Systemic Lupus Erythematosus Disease Activity Index
Unique T-cell subsets
A heightened capacity of T cells to adhere and migrate into inflamed tissue may lead to organ damage in patients with SLE. A recent study has shown that surface expression of CD44 (an adhesion molecule) and its variant isoforms CD44v3 and CD44v6 were elevated on T cells of patients with SLE [Crispin et al. 2010a]. Significantly, T-cell surface levels of CD44v3 and CD44v6 were found to be correlated with the SLEDAI score, positivity of anti-dsDNA, and the presence of lupus nephritis. These results suggest that expression levels of CD44v3 and CD44v6 on T cells may serve as biomarkers for SLE disease activity [Crispin et al. 2010a]. Recently, it has also been reported that killer cell-Ig like receptors (KIR), surface molecules originally identified on natural killer (NK) cells, were aberrantly expressed by T cells of patients with SLE and that the expression of T-cell surface KIR was proportional to the SLEDAI score [Basu et al. 2009]. These studies implicate the potential of frequencies of KIR-expressing T cells and T-cell expression levels as disease activity biomarkers for SLE. Another potential T-cell-relevant disease activity biomarker was suggested by a recent study that reported increased expansion of a subpopulation of CD4+ T cells that express the NKG2D receptor and display suppressive/regulatory activity in patients with juvenile-onset SLE; the frequencies of such ‘suppressive/regulatory’ NKG2D+CD4+ T cells were correlated inversely with disease activity [Dai et al. 2009b].
DN T cells, which lack surface expression of CD4 and CD8, constitute a small population (<5% of T cells) in healthy individuals, but are significantly expanded in patients with SLE [Crispin et al. 2008]. A recent study showed that these cells can secrete cytokines such as IL-17 and IL-1β, induce anti-dsDNA antibody production by autoreactive B cells, and infiltrate the kidneys of patients with lupus nephritis [Crispin et al. 2008]. Thus, the frequency of DN T cells in the peripheral blood might serve as a surrogate biomarker of lupus nephritis.
Other potential T-cell-based biomarkers
Previous studies have demonstrated multiple abnormalities at different levels of the T-cell receptor (TCR) signaling cascade and downstream in T cells derived from patients with SLE [Moulton and Tsokos, 2011]. It has been shown that the fundamental defect may be linked to alterations in the structure and dynamics of lipid rafts within the plasma membrane of lupus T cells [Jury et al. 2007; Kabouridis and Jury, 2008]. Lipid rafts are cholesterol- and glycosphingolipid-rich membrane microdomains that facilitate and orchestrate close interactions between molecules that are critical in signal transduction [Harder, 2004]. Several investigators have shown that, as compared to T cells derived from control mice or healthy individuals, T cells derived from lupus-prone mice or patients with SLE express increased levels of glycosphingolipid GM1 and possess higher amounts of clustered lipid rafts that are associated with unusual components such as FcRγ activated Syk kinase, and CD45 [Dong et al. 2010; Jury et al. 2004; Krishnan et al. 2004]. Furthermore, it was recently shown that injection of lupus-prone mice with Cholera Toxin B, a component of Vibrio cholerae capable of binding to GM1, induced aggregation of lipid rafts in T cells and consequently accelerated lupus development in those mice [Deng and Tsokos, 2008]. Conversely, statins (inhibitors of HMG-CoA reductase), which decrease cholesterol synthesis and thus can modify lipid raft components, have been shown to restore signaling defects characteristic of SLE T cells [Jury et al. 2006]. Taken together, these studies support a pivotal role for altered lipid rafts in dysregulated T cell signaling in SLE and imply potential utility of levels of T-cell-associated altered lipid rafts as surrogate biomarkers for SLE disease activity.
Biomarkers for lupus nephritis
SLE can affect virtually any tissue or organ. However, not all organs will be affected simultaneously, and the involvement of a specific organ will not necessarily be manifested in the same manner in different patients. The manifestations of specific organ involvement of a given patient may also vary over time. This clinical heterogeneity of SLE poses a great demand for biomarkers that can differentiate, determine, monitor, stratify and/or predict organ-specific involvement in patients with SLE.
Of the myriad manifestations of SLE, renal involvement is one of the most common and it continues to cause significant morbidity and mortality. Lupus nephritis occurs in 25–50% of adult patients with SLE [Cameron, 1999] and 80% of pediatric patients with SLE [Watson and Beresford, 2012]. Among those patients, 25% and 40% of adult and pediatric patients, respectively, may progress to end-stage renal disease. Improved methods for detecting lupus nephritis would allow earlier treatment, which may prevent irreversible kidney damage and thwart declines in renal function.
In lieu of invasive and impractical serial renal biopsies, creatinine clearance, urine protein level, urine sediment, serum C3 and C4 levels, serum creatinine level, and anti-dsDNA titers have for decades been used to follow the onset, course, and severity of lupus nephritis, yet it is generally recognized that these measurements are inadequate. Current efforts are focused on identification of more sensitive and specific biomarkers to diagnose and monitor renal disease in both adult and pediatric patients with SLE, with the hope to optimize synchronization of treatment with active disease, distinguish active inflammation from irreversible damage, and to facilitate development of new therapeutics through clinical trials [Adhya et al. 2011; Mok, 2010; Rovin and Zhang, 2009] (Table 4).
Summary of biomarkers for lupus nephritis.

Antinucleosome antibodies
The use of autoantibodies other than anti-dsDNA in monitoring and preferably predicting renal disease in patients with SLE has been explored extensively during the past several decades. Among those autoantibodies, antichromatin/antinucleosome antibodies [Bruns et al. 2000; Gomez-Puerta et al. 2008; Koutouzov et al. 2004], along with anti-C1q antibodies [Pickering and Botto, 2010; Potlukova and Kralikova, 2008] (see the next section), have shown some promise as biomarkers of renal involvement. Chromatin, the DNA-histone complex found in the nucleus of eukaryotic cells, is organized into a repeating series of nucleosomes. Previous studies have demonstrated that the nucleosome is a major autoantigen targeted by T and B cells in SLE [Bruns et al. 2000; Mohan et al. 1993]. Antinucleosome antibodies are reportedly present in 70–100% of patients with SLE, and are fairly sensitive (48–100%) and highly specific (90–99%) for SLE [Cervera et al. 2003; Chabre et al. 1995; Gomez-Puerta et al. 2008]. Among SLE patients, antinucleosome antibodies are more likely to be detected in patients with nephritis and may serve as a useful biomarker in the diagnosis of active lupus nephritis [Cervera et al. 2003; Grootscholten et al. 2007; Gutierrez-Adrianzen et al. 2006].
Moreover, some investigators reported that antinucleosome antibodies could be found in patients who consistently tested negative for anti-dsDNA antibodies and that a significant fraction of those patients indeed had renal disease [Min et al. 2002], suggesting that antinucleosome antibodies may serve as a sensitive marker for renal involvement in the absence of anti-dsDNA. A prospective controlled study was recently conducted with 52 patients with active proliferative lupus nephritis [Grootscholten et al. 2007]. It was found that patients with high titers of antinucleosome antibodies had significantly higher disease activity; the levels of antinucleosome antibodies rapidly declined after treatment. Similarly, another study followed a group of SLE patients with new-onset lupus nephritis for up to 2 years [Manson et al. 2009]. Those investigators showed that antinucleosome levels associated positively with decreasing renal function (measured by urine protein/creatinine ratio and serum albumin level), and the levels of antinucleosome antibodies significantly decreased during remission of lupus nephritis.
Although many studies including those discussed here have reported the promise of antinucleosome antibodies, it should be cautioned that another study showed that antinucleosome antibodies are highly prevalent in both SLE patients with (89%) or without (80%) active proliferative nephritis and have limited value in distinguishing these two subgroups of patients [Bigler et al. 2008]. Nevertheless, these studies collectively provide substantial, but not definitive, evidence that antinucleosome antibodies may be more sensitive and have greater diagnostic efficacy than anti-dsDNA for active disease, especially nephritis, in SLE patients.
Anti-C1q antibodies
Anti-C1q antibodies are mostly of the IgG subtype that react with epitopes present within the collagen-like tail of C1q. Although anti-C1q antibodies can be detected in a small proportion of healthy individuals (3-5%), they are more common in patients with autoimmune disorders such as hypocomplementemic urticarial vasculitis (100%) and SLE (17-63%) [Sinico et al. 2009]. A significant correlation between the presence of anti-C1q antibodies and renal disease in SLE has been reported [Horak et al. 2006; Horvath et al. 2001; Marto et al. 2005; Moroni et al. 2001], with positive predictive value and negative predictive to be 58% and 100%, respectively [Moroni et al. 2001]. Therefore, the absence of anti-C1q antibodies has been suggested as an indicator for excluding a diagnosis of lupus nephritis [Trendelenburg et al. 1999, 2006]. Significant correlations between anti-C1q titers and active lupus nephritis have also been reported [Akhter et al. 2011; Moroni et al. 2001; Trendelenburg et al. 2006], with a sensitivity of 44-100% and a specificity of 70-92% reported by Moroni and colleagues [Moroni et al. 2001]. Another study reported the detection of anti-C1q antibodies in SLE patients who did not have a history of renal disease but eventually developed lupus nephritis [Marto et al. 2005]. The detection of anti-C1q and an increase in anti-C1q antibodies have been suggested to predict renal flares [Meyer et al. 2009; Moroni et al. 2001, 2009]. For example, Moroni and colleagues followed 228 patients with lupus nephritis for 6 years and found that elevation of anti-C1q levels predicted renal flares in patients with proliferative lupus nephritis, with a sensitivity of 81% and a specificity of 71% [Moroni et al. 2009]. Some investigators suggested that the prediction value would be further enhanced when both anti-C1q and anti-dsDNA were measured [Matrat et al. 2011]. Moreover, it has been reported that levels of anti-C1q antibodies decreased after successful treatment of lupus nephritis [Trendelenburg et al. 2006].
Taken together, these recent studies demonstrate a strong correlation between the presence of anti-C1q antibodies and lupus nephritis, and suggest that anti-C1q determination may serve as a noninvasive biomarker (versus the invasive renal biopsy) to monitor renal involvement and/or predict renal flares [Pickering and Botto, 2010; Sinico et al. 2009].
Complement C4d
An expanding literature has demonstrated the utility of histologic identification of complement C4d as an informative biomarker of transplant allograft rejection. Similarly, investigators from the Netherlands have demonstrated a strong relationship between the intensity of glomerular C4d staining and the presence of microthrombi in patients with lupus nephritis (present in seven of eight patients) [Cohen et al. 2008]. Most recently, a prospective assessment was performed to determine the potential value of cell-bound C4d as biomarkers of lupus nephritis [Batal et al. 2012]. Histologic identification of C4d on renal biopsies was compared with the results of a cell-bound complement activation product (CB-CAP) assay panel in 15 patients with lupus nephritis, 239 lupus patients without nephritis and 13 patients with nonlupus nephritis. Patients with lupus nephritis had higher glomerular C4d scores, and also had significantly higher levels of erythrocyte-bound C4s and reticulocyte-bound C4d than the two control groups. SLE patients with lupus nephritis were also more likely to have C4d bound on platelets, as compared with SLE patients without lupus nephritis. Erythrocyte-bound C4d levels correlated with the National Institutes of Health (NIH) activity index. These findings suggest a potential role of circulating cell-bound C4d as a noninvasive biomarker for lupus nephritis.
Urinary chemokine/cytokine biomarkers
Serum and plasma are easy to prepare from patients and have been widely used in developing novel biomarkers for lupus nephritis. However, biological changes in the serum or plasma may not reflect fully and timely the local situation within a specific organ such as the kidneys. Urine, in contrast, may serve as a window looking into the pathological changes in inflamed kidneys in real-time. Significant progress has been made in the discovery of novel urinary biomarkers for lupus nephritis.
Monocyte chemoattractant protein-1
Monocyte chemoattractant protein-1 (MCP-1) participates in the pathogenesis of lupus nephritis. A number of earlier studies showed that urinary MCP-1 (uMCP-1) levels were elevated in patients with active nephritis and declined after immunosuppressive treatment [Noris et al. 1995; Rovin et al. 1996; Wada et al. 1996]. Several more recent studies, both cross-sectional and longitudinal, have confirmed those findings [Kiani et al. 2009; Rovin et al. 2005; Tian et al. 2007; Tucci et al. 2004]. For example, in a study conducted by Rovin and colleagues [Rovin et al. 2005], it was shown that uMCP-1 level was a sensitive indicator for renal flare, with 73% of the uMCP-1 levels measured at renal flares higher than the 95th percentile of the disease controls. uMCP-1 levels did not correlate with extrarenal disease activity. Moreover, uMCP-1 levels increased as early as 2–4 months before renal flares, suggesting that uMCP-1 may serve as a biomarker for predicting impending renal flares. Similarly, uMCP-1 levels have been shown to elevate in pediatric patients with lupus nephritis and to be able to differentiate patients with active or inactive renal disease [Watson et al. 2012]. These results, collectively, indicate that urinary levels of MCP-1 protein and urinary MCP-1 mRNA levels are promising biomarker candidates due to specificity for renal activity, sensitivity in predicting renal flares and the capacity to reflect both the severity of flares, and the proliferative nature of the histology [Chan et al. 2006; Kiani et al. 2009; Rovin et al. 2005].
Neutrophil gelatinase-associated lipocalin
Neutrophil gelatinase-associated lipocalin (NGAL; lipocalin-2) is a small glycoprotein that functions as a carrier for cellular iron transport, apoptosis, and tissue differentiation. NGAL is constitutively produced at low levels in the kidneys, but is upregulated following inflammation, ischemia, and infection [Bolignano et al. 2008; Mishra et al. 2003; Schwartz et al. 2007; Trachtman et al. 2006]. Associations of rising serum and urinary NGAL levels (uNGAL) with acute renal injury have been shown in both adult and pediatric patients [Bolignano et al. 2008; Mishra et al. 2003; Schwartz et al. 2007; Trachtman et al. 2006]. In lupus nephritis, it was postulated that injured tubular cells, infiltrating neutrophils, or inflamed vasculature are the sources of uNGAL [Brunner et al. 2006]. Cross-sectional as well as longitudinal studies have demonstrated the promise of uNAGL as a biomarker of lupus nephritis in both pediatric and adult patients with SLE [Brunner et al. 2006; Hinze et al. 2009; Pitashny et al. 2007; Rubinstein et al. 2010; Suzuki et al. 2008; Yang et al. 2012]. In a cross-sectional study of pediatric patients by Brunner and colleagues, uNGAL levels were significantly elevated in patients with lupus nephritis; increased uNGAL levels were associated with renal SLE disease activity scores and not with global damage or extrarenal disease activity [Brunner et al. 2006]. A cross-sectional study of adult patients with lupus nephritis generated similar findings [Pitashny et al. 2007]. However, it should be pointed out that conflicting reports regarding the association of uNGAL with lupus nephritis in adult patients have been published recently [Kiani et al. 2012; Yang et al. 2012]. Nevertheless, the potential of both serum and urinary NGAL as biomarkers for lupus nephritis is best reflected by longitudinal studies demonstrating the capacity to predict exacerbation of renal disease and flares [Rubinstein et al. 2010; Suzuki et al. 2008].
Tumor necrosis factor-like weak inducer of apoptosis
Tumor necrosis factor like weak inducer of apoptosis (TWEAK) is a multifunctional cytokine that belongs to the tumor necrosis factor (TNF) superfamily. The expression of TWEAK has been shown to increase dramatically during inflammation and injury [Winkles, 2008]. In lupus nephritis, it is possible that TWEAK may induce the production of other proinflammatory cytokines and chemokines and thus propagate tissue inflammatory injury [Gao et al. 2009; Sanz et al. 2008]. Urinary TWEAK (uTWEAK) levels were shown by Schwartz and colleagues in a cross-sectional study to be significantly higher in SLE patients with active nephritis as compared with those with inactive or no nephritis [Schwartz et al. 2006]. In addition, uTWEAK levels correlated with anti-dsDNA, serum C3 and C4, uMCP-1 and renal disease activity scores. A subsequent multicenter longitudinal study by this same group further demonstrated the potential value of uTWEAK which was superior to the current standards anti-dsDNA and serum complement levels in differentiating lupus nephritis from nonrenal lupus activity [Schwartz et al. 2009].
Biomarkers predicting histopathologic features of lupus nephritis
Kidney biopsy is currently the gold standard for diagnosing, classifying, and guiding the treatment of lupus nephritis. It standardizes histological classification of lupus nephritis, enables direct assessment of the presence and severity of acute changes due to active lupus nephritis, and provides information of the chronicity of lupus nephritis. However, the invasive nature of kidney biopsy limits its frequent use in monitoring the disease progression and treatment response. Therefore, noninvasive and sensitive biomarkers that might reveal specific histopathologic features of lupus nephritis are in great need.
The associations of serum antinucleosome and anti-C1q levels with renal histopathologic features have recently been reported [Chen et al. 2012; Hung et al. 2011]. Hung and colleagues conducted a cross-sectional study with 36 SLE patients with biopsy-proven proliferative lupus nephritis and 14 patients with non-renal SLE [Hung et al. 2011]. These investigators found that serum levels of antinucleosome antibodies were significantly elevated in patients with lupus nephritis and correlated with SLE disease activity measured by the British Isles Lupus Assessment Group (BILAG) index. The serum antinucleosome antibody levels correlated positively with the histological activity index of lupus nephritis (r(s) = 0.368, p < 0.05), but not with the chronicity index. In another cross-sectional study involving 52 patients who had biopsy-proven lupus nephritis, serum anti-C1q levels were found to correlate positively with the scores of the SLEDAI, anti-dsDNA antibody, and antinucleosome antibody [Chen et al. 2012]. The prevalence of anti-C1q was found to be higher in patients with proliferative lupus nephritis [World Health Organization (WHO) class III and class IV] than those with mesangial lupus nephritis (class II), although the difference did not reach statistical significance. The serum anti-C1q levels were highest in patients with class IV lupus nephritis. Furthermore, the anti-C1q levels correlated positively with renal activity indices but negatively with chronicity indices. These findings suggest that serum anti-C1q antibody may be a valuable noninvasive biomarker for prediction of histopathologic characteristics of lupus nephritis.
Following the identification of several promising urinary biomarkers for diagnosing and differentiating active versus inactive lupus nephritis, investigators examined the relationship between those urinary biomarkers and histological features of lupus nephritis. In a recent study, Brunner and colleagues assayed several established markers (anti-dsDNA, serum C3, C4, creatinine, urinary protein:creatinine ratio, etc.) and urinary biomarkers [MCP-1, NGAL, lipocalin-type prostaglandin D-synthetase (L-PGDS), α1-acid-blycoprotein (AAG/AGP), transferrin (TF), and ceruloplasmin (CP)] in urine samples from 76 SLE patients collected within 2 months of kidney biopsy [Brunner et al. 2012]. These urinary biomarkers were compared with histopathologic features of the kidney biopsy (mesangial expansion, capillary proliferation, crescent formation, wire loops, fibrosis, etc.). Statistical analyses included nonparametric analysis and area under the receiver operating characteristic curve (AUC) calculation. The results revealed that differential increases in levels of urinary biomarkers in patients with active lupus nephritis appeared to reflect specific histologic features in the kidneys. Specifically, the combination of urinary MCP-1, AAG, and CP levels and protein:creatinine ratio performed well in predicting lupus nephritis activity (AUC = 0.85). On the other hand, NGAL together with MCP-1 and creatinine clearance appeared to be a valuable indicator of lupus nephritis chronicity (AUC = 0.83). The combined panel of MCP-1, AAG, TF, creatinine clearance, and serum C4 was shown to be a potential biomarker for membranous nephritis (AUC = 0.75).
Collectively, these studies suggest that panels of serum and urinary assays hold promise as potential noninvasive biomarkers for monitoring the activity, chronicity, and type of lupus nephritis.
SLE biomarker panels
Undoubtedly, no single biomarker will be sufficient ultimately to diagnose, monitor and stratify all patients with SLE. Thus, investigations have recently evolved toward discovery and validation of lupus biomarker ‘panels’. One approach in this regard has been technology-driven with the use of microarrays or proteomics for identifying novel gene or protein ‘biosignatures’ of SLE such as that discussed above for lupus nephritis [Brunner et al. 2012]. Additional ongoing developments on this front are discussed briefly here.
Biomarker panels for diagnosis and disease activity monitoring of SLE
Recognizing the importance of aberrant T-cell function in SLE, a gene expression array consisting of 30 genes thought to contribute to the pathogenesis of SLE has recently been developed. To examine the utility of this T cell gene expression array, an initial study was conducted with 10 patients with SLE, 6 patients with rheumatoid arthritis, and 19 healthy individuals [Juang et al. 2011]. The results showed that the gene expression array could faithfully represent the expression levels of different genes. Moreover, principal component analysis (PCA) was used to evaluate the contribution of the arrayed genes to diagnosis and stratification. PCA of gene expression levels showed that SLE samples were distinguished from samples of RA and healthy individual. Notably, individual principal components appeared to define specific disease parameters such as arthritis and proteinuria. These results suggest potential for this T-cell gene expression as lupus biomarkers for diagnosis and stratification. Further validation, using larger cohorts of patients with lupus compared with patients with other lupus-like diseases is warranted.
Another gene expression-based search for biomarkers of autoimmune disease involved profiling the transcriptomes of purified CD8 T cells [McKinney et al. 2010]. McKinney and colleagues identified a subset of genes associated with a poor prognosis in patients with SLE. This subset of genes is enriched for genes involved in TCR signaling, IL-7 receptor signaling, and memory T-cell phenotype. They further showed that these subgroups of genes can be identified by measuring the expression of only three representative genes. These findings suggest the prospect of a streamlined version of gene expression-based biomarkers that might be used for identifying patients with poor prognosis and thus for personalized treatment of those patients.
A more recent study investigated the value of a biomarker panel consisting of traditional markers (e.g. ANA and anti-dsDNA) and the newly developed CB-CAP biomarkers [Liu et al. 2010]. In this multicenter, cross-sectional study, a total of 593 subjects (210 SLE patients, 178 patients with other rheumatic diseases, and 205 healthy individuals) were enrolled [Kalunian et al. 2012]. Erythrocyte-bound C4d (E-C4d), B-cell-bound C4d (B-C4d), ANA, and anti-mutated citrullinated vimentin antibody (anti-MCV) were measured and an index score system corresponding to the weighted sum of these four markers was developed. It was reported that a positive index score correctively categorized 72% of SLE patients. Furthermore, the sensitivity and specificity of the combination of anti-dsDNA and index score positivity in differentiating SLE from other rheumatic disease was 80% and 87%, respectively. These results support the use a biomarker panel combining anti-dsDNA, ANA, anti-MCV, E-C4d, and B-C4d for the diagnosis of SLE. This is the only biomarker panel validated to date for lupus diagnosis.
Composite urinary biomarkers for lupus nephritis
The proteomics approach has recently been taken to identify protein markers/profiles that can differentiate SLE with or without nephritis or differentiate active lupus nephritis from inactive lupus [Mosley et al. 2006; Suzuki et al. 2007]. In one of the first urinary proteomics studies, Mosley and colleagues utilized the surface enhanced laser desorption/ionization time-of-flight mass spectrometry (SLEDI-TOF MS) technology and identified proteins with masses of 3340 and 3980 that best distinguished active from inactive lupus nephritis [Mosley et al. 2006]. Further analysis with serial urine samples of six patients with biopsy-confirmed lupus nephritis showed that these proteins could predict renal flares and remission earlier than conventional markers for nephritis. Subsequently, Suzuki and colleagues used a similar technique to investigate the urinary protein profile (‘signature’) in pediatric patients with lupus nephritis [Suzuki et al. 2007]. They identified 8 candidate peptides/proteins with molecular masses from 2700 to 133,000, including TF, AGP, CP, and L-PGDS. The peak intensities of these proteins were significantly stronger in patients with nephritis than in patients without nephritis and healthy controls. Moreover, these proteins significantly correlated with renal disease activity.
In a subsequent validation study, these investigators measured the concentrations of urinary TF, AGP, CP, and L-PGDS in serial samples from 98 pediatric SLE patients and 30 patients with juvenile idiopathic arthritis [Suzuki et al. 2009]. All four urinary proteins were present at significantly higher concentrations in SLE patients with active nephritis, compared to those with inactive nephritis or juvenile idiopathic arthritis. By analyzing the AUC, these urinary proteins performed better than traditional renal markers in identifying the presence of active nephritis. Furthermore, prospective analysis showed that significant increases of urinary TF, L-PGDS, and AGP, occurred as early as 3 months before clinical worsening of lupus nephritis. This latter result suggests that these urinary proteins, particularly TF, are sensitive biomarkers for changes in renal disease activity.
Most recently, Zhang and colleagues demonstrated the potential of a composite biomarker panel for lupus nephritis in adult SLE patients [Zhang et al. 2012]. In a study that included evaluation of 64 renal biopsies and simultaneous (or close-in-time) urine samples from 61 patients with lupus nephritis, they identified a composite panel including MCP-1 and serum creatinine that had sensitivity, specificity, positive predictive value, and negative predictive value of 100%, 81%, 67%, and 100%, respectively with only 14% of biopsies being misclassified.
Future prospects
Although many SLE biomarker reports have been published during the past decade, the majority of these have studied small numbers of patients and/or have been limited to cross-sectional observations. Owing to the heterogeneous nature of SLE with mounting evidence of the influence of geoepidemiology and epigenetics, it is perhaps not surprising that some of the biomarkers have yielded conflicting results in different studies or have failed to fulfill the early promising potential. The few longitudinal investigations that have been published have followed promising initial cross-sectional studies and more such long term prospective analyses are ongoing. Ultimately, validation of lupus biomarkers will require multicenter studies.
Until recently, the development of SLE biomarkers has primarily been focused on biomarkers that may assist in making a precise diagnosis or monitoring disease activity. Attempts have begun toward discovering biomarkers that might aid in predicting the onset of SLE in susceptible individuals and/or development of flares (systemic or organ-specific) in patients with established SLE, predicting disease outcome, and assessing the effectiveness of therapeutic interventions. These ‘next-generation’ SLE biomarkers will be particularly important because more sensitive and specific markers for the onset or flare of SLE disease activity may allow proactive institution of therapeutic and even preventive strategies so that the therapeutic efficacy can be enhanced while treatment-related side effects can be minimized. In the burgeoning era of biologic therapeutics, some of which have resulted from recent biomarker studies, a new class of pharmacodynamic biomarkers is needed to aid identification of patients who might respond favorably to a particular biologic, selection of the type and dose of biologics used, and evaluation of therapeutic efficacy. An illustrative example is sifalimumab and rontalizumab, anti-IFNα monoclonal antibodies under evaluation for the treatment of SLE, which were developed based on the seminal discovery of the IFN signature and related biomarkers. Specific and dose-dependent inhibition of type 1 IFN-inducible gene expression and improvement of skin lesions has been observed in the blood of treated SLE patients [Merrill et al. 2011]. It has been shown that, using a scoring or a metric system based on the expression of type 1 IFN-inducible genes, SLE patients could be divided into two distinct subpopulations [Yao et al. 2010]. This latter finding supports the possibility of using the IFN signature metric as predictive biomarkers to identify SLE patients who might respond more favorably to these biologics and as monitoring biomarkers to stratify patients’ responses.
Owing to the extreme complexity of the disease in its diagnosis, course and organ-specific manifestations as described above, we will most likely depend upon a panel of SLE biomarkers that will be used by physicians, scientists and industry for patient care, research, and drug discovery. This potentially daunting task will require collaborative efforts and novel approaches moving forward.
Footnotes
Funding
The authors’ studies mentioned in this article were supported by grants from the National Institutes of Health (RO1 HL074335 and RO1 AI077591), the Lupus Research Institute, and the Department of Defense.
Conflict of interest statement
The authors are co-inventors of patents related to the CB-CAP biomarkers that were mentioned in this article. Dr Ahearn and Dr Manzi are consultants of the Exagen Diagnostics, Vista, CA.