
Abstract
Assessment of coastal erosion is of high significance given the fact that the coastal communities are densely populated areas and have an influence on the food cycle directly and indirectly. Continuous monitoring is essential part of the work for any intervention to be carried out owing to the seasonal and inter-annual variability. The article discusses the measurement criteria and stages in an operational plan for a monitoring exercise, preparation and execution. Erosion can be due to a variety of natural and anthropogenic causes in general. The topic draws attention of both researchers and coastal communities equally. This article explains the need for operational strategies for an optimal monitoring of coastal erosion. Demonstration of such methodology was presented with a case study at a micro-tidal sandy beach located in Tamil Nadu. A generic set up for a plan boundary to measure met-ocean parameters over a time and spatial extent covering the beach and near-shore sediment regime, shore face and surf zone hydrodynamics is discussed. For a detailed understanding, numerical models are set up against the measurements to have a feel of the spatial variability. Validation was taken up extensively and the predictions were used to enhance the measurements in spatial and temporal scales, advantages with such setup.
Keywords
Introduction
The coastal areas are subject to an increased pressure by regional alterations and global changes. The drivers can be many, of which climate change and source sink alternation are major. Among coastal issues, near-shore erosion has become a major threat worldwide. Sediment erosion and accretion being natural processes, any anthropogenic influence exacerbates the environmental condition of the coast. The population density and the developmental activities along the coastal belt accelerate the semi to permanent modification in an irreversible way. Every country has reported erosion and accretion, whereas emphasis is being laid on coastal zone management and proper budgeting. Around 45.5% of Indian coastline is undergoing coastal erosion, while about 19.8% of coastline is found to be stable and 35.7% of coast shows signs of accretion (Rajawat et al., 2015).
Monitoring coastal erosion is undeniable due to its wide range of impacts to the livelihood. For a sustainable coastal management, it is necessary to understand the interrelationship between the physical processes and the forcing factors, and their effects on the coastal system. Coast can be studied in terms of shoreline dynamics (Boak and Turner, 2005) or in terms of near-shore morphological changes. Understanding the processes involved in coastal erosion requires awareness on the interactions between onshore and offshore environmental processes that includes wave energy and propagation direction, episodic weather events and trends in climate change, the materials on the coast and the supply or extraction of sediments. In addition, the influence of man-made structures can greatly alter the natural regime (Archetti and Zanuttigh, 2010; Granja and Pinho, 2012). The monitoring methods should be as comprehensive as possible to obtain important information on regional bathymetry along with natural features and materials (Holland et al., 2009). Coastal morphology and its dynamics have to be quantified over time and erosion risks have to be evaluated considering present and potential future scenarios.
Several methods from traditional beach surveying to remote sensing are in practice for coastal morphodynamic monitoring. Static measurements are employed to conduct profile surveys and slope of the beach. Although remotely sensed data have also been successfully used for coastal monitoring, the results were accurate to the order of the resolution and validation undertaken. Satellite radar, particularly Synthetic Aperture Radar (SAR), were used to get the shoreline information (Niedermeier et al., 2000) and aerial digital photography used to obtain three-dimensional (3D) information through photogrammetric analysis (Cowart et al., 2010; Fletcher et al., 2003). Alternatively fixed video imagery (Archetti and Zanuttigh, 2010; Davidson et al., 2007) are also used which provide continuous data, which can have an optimal temporal resolution, but to limited stretches.
Laser surveys can deliver similar or slightly better (10–15 cm) accuracy in the vertical component and can be an alternative to aerial photography techniques. The portability of the equipment has facilitated rapid use, but the data handling and processing are anchors in its advancement. A recent approach to topographic surveys is videogramatic mobile mapping, where 3D coordinates are extracted from stereo video images and are used to monitor the shoreline changes periodically.
The generalisation of GPS (Global Positioning System) methods, particularly those using Real-Time Kinematic corrections, has facilitated analysis of spatial variability allowing accurate 3D data to be collected both rapidly and at high spatial resolution (Barnard and Warrick, 2010). This has been the technology deployed and is still widely in use for such assessments.
Operational strategy
A broad view on the composite nature of the coastal processes is essential for anticipated monitoring. The coastal zone management schemes pertinent to the area of interest, both technical and socio economic, should be the basis of the planning in general. The present methodology needs adaptive methods to be developed in grabbing comprehensive understanding of the system with existing state-of-the-art facilities and minimising cost and uncertainties. The strategic objectives for all inclusive plan elements have an important role in up keeping the safety against hazards and formulate a ‘Frame of Reference’. It also aids in regulating the short-term and long-term management practices.
There are extensive management and monitoring strategies conceived worldwide particularly for coastal erosion issues. CONSCIENCE is one such project launched in 2007 to enhance the implementation of scientific, sustainable coastal erosion management in Europe (Marchand, 2010). National integrated coastline management strategy is formulated and implemented by France since 2011 with priorities to develop coastline monitoring, to prepare strategies that can be shared by public and private stakeholders and to move towards a policy for land planning by finding methods for financial intervention. The National Coastal Zone Management Program, the US programme, instituted by NOAA through the US Coastal Zone Management Act of 1972 developed to protect, restore and responsibly develop its nation’s diverse coastal communities and resources. Many coastal countries have its policy and action plans to manage its coastal resources.
In the Indian context, the action plan for integrated coastal management became more important due to rapid developmental activities that degrade coastal resources in the past three decades. The data for research and planning were very scarce. Recognising the importance of data for coastal and oceanographic research, National Institute of Ocean Technology (NIOT), Chennai, instituted many operational monitoring programmes for data acquisition around the Indian coast. Monitoring programmes that are successfully initiated by the institute includes (a) Coastal Monitoring System that sets up measurements for tide, waves, currents and met-ocean parameters, (b) installation and monitoring of HF Radar that measure waves and surface currents to a maximum radius of 200 km from the coast and (c) Ocean Observation Systems that widely deploy instruments in the open ocean to measure all oceanographic and meteorological parameters. The data sets obtained through these programmes are extensively used for many management plan and actions. A separate programme, Sustainable Shoreline Management (SSM) project, is organised by the institute for stabilisation of coast by adapting different erosion control measures along the erosion-prone coastal stretches in India.
According to the Concepts and Science for Coastal Erosion Management (Marchand, 2010), a Commission of the European Communities (EC)-funded project describes the decision-making technique for operational beach management in a four-stage processes such as the following: (a) quantitative state concept defines the present state of the coast and its natural behaviour, (b) benchmarking process specifies whether any actions are required, (c) intervention procedure provides a detailed definition of what action is required when the benchmark values are exceeded and finally (d) evaluation procedure, through feedbacks the effectiveness of the management actions will be assessed.
For the first two stages wherever secondary data are available with prerequisite accuracy, detailed measurements are not required. Otherwise, a strategic plan of measurements has to be carried out to understand the localised physical and environmental conditions that regulate the natural behaviour of the coast. The presence of database for a remote site/coastal village is difficult to establish, unless a base line study has been carried out. This article is built on such occasion and the details of setting up an operational plan for measuring the parameters that influence the sediment transport of the coast. The plan is optimised by numerical modelling from which areas of increased sensitivity to specific processes at the site are identified and field measurements are modified to suite the data need to be collected.
Criteria in developing operational strategy for erosion monitoring
Management plans are site-specific and hence monitoring should adhere to the programme in addition to collection of standardised data set. Primary data play a substantial role in every project management, and a specific field operational strategy for measurements is, therefore, critical. The operational strategies are mainly developed for primary data acquisition to implement an effective field campaigning plan. Suitable control measures are proposed based on the data quality and numerical model results.
The initial programme planning will be based on how to address the problem and the need for the coast (immediate and long time), with stakeholder’s consultation if any. A thorough search for secondary data follows with a preliminary large-scale modelling effort to understand the local circulations if any. Although the secondary sources provide an insight on the regional circulation, an introspective view of the system has to be evaluated whether it addresses the primary problem, otherwise unconvinced; a proper data collection strategy is envisaged. In the case of insufficient data, a detailed operational field programme can be planned and applied.
As there exist several ways of estimating the loss/erosion, both analytical and numerical, a general view has to be taken without any bias. A simple numerical model should be built with sensitivity analysis of different calibration parameters for the problem understudy. Then a control boundary has to be chosen and measurements for validating the concept should be planned. It follows by choice/availability of instruments, time and spatial scales of measurement to be listed. A detailed financial implication has to be prepared and should undergo external assessment for funding, after which deployments have to be undertaken on the approved time scales.
NIOT has undertaken such deployments for research, for more than two decades. Over time, different systems were tried and a systematic operational strategy, as shown in Figure 1, was developed for undertaking beach morphology and erosion cases.
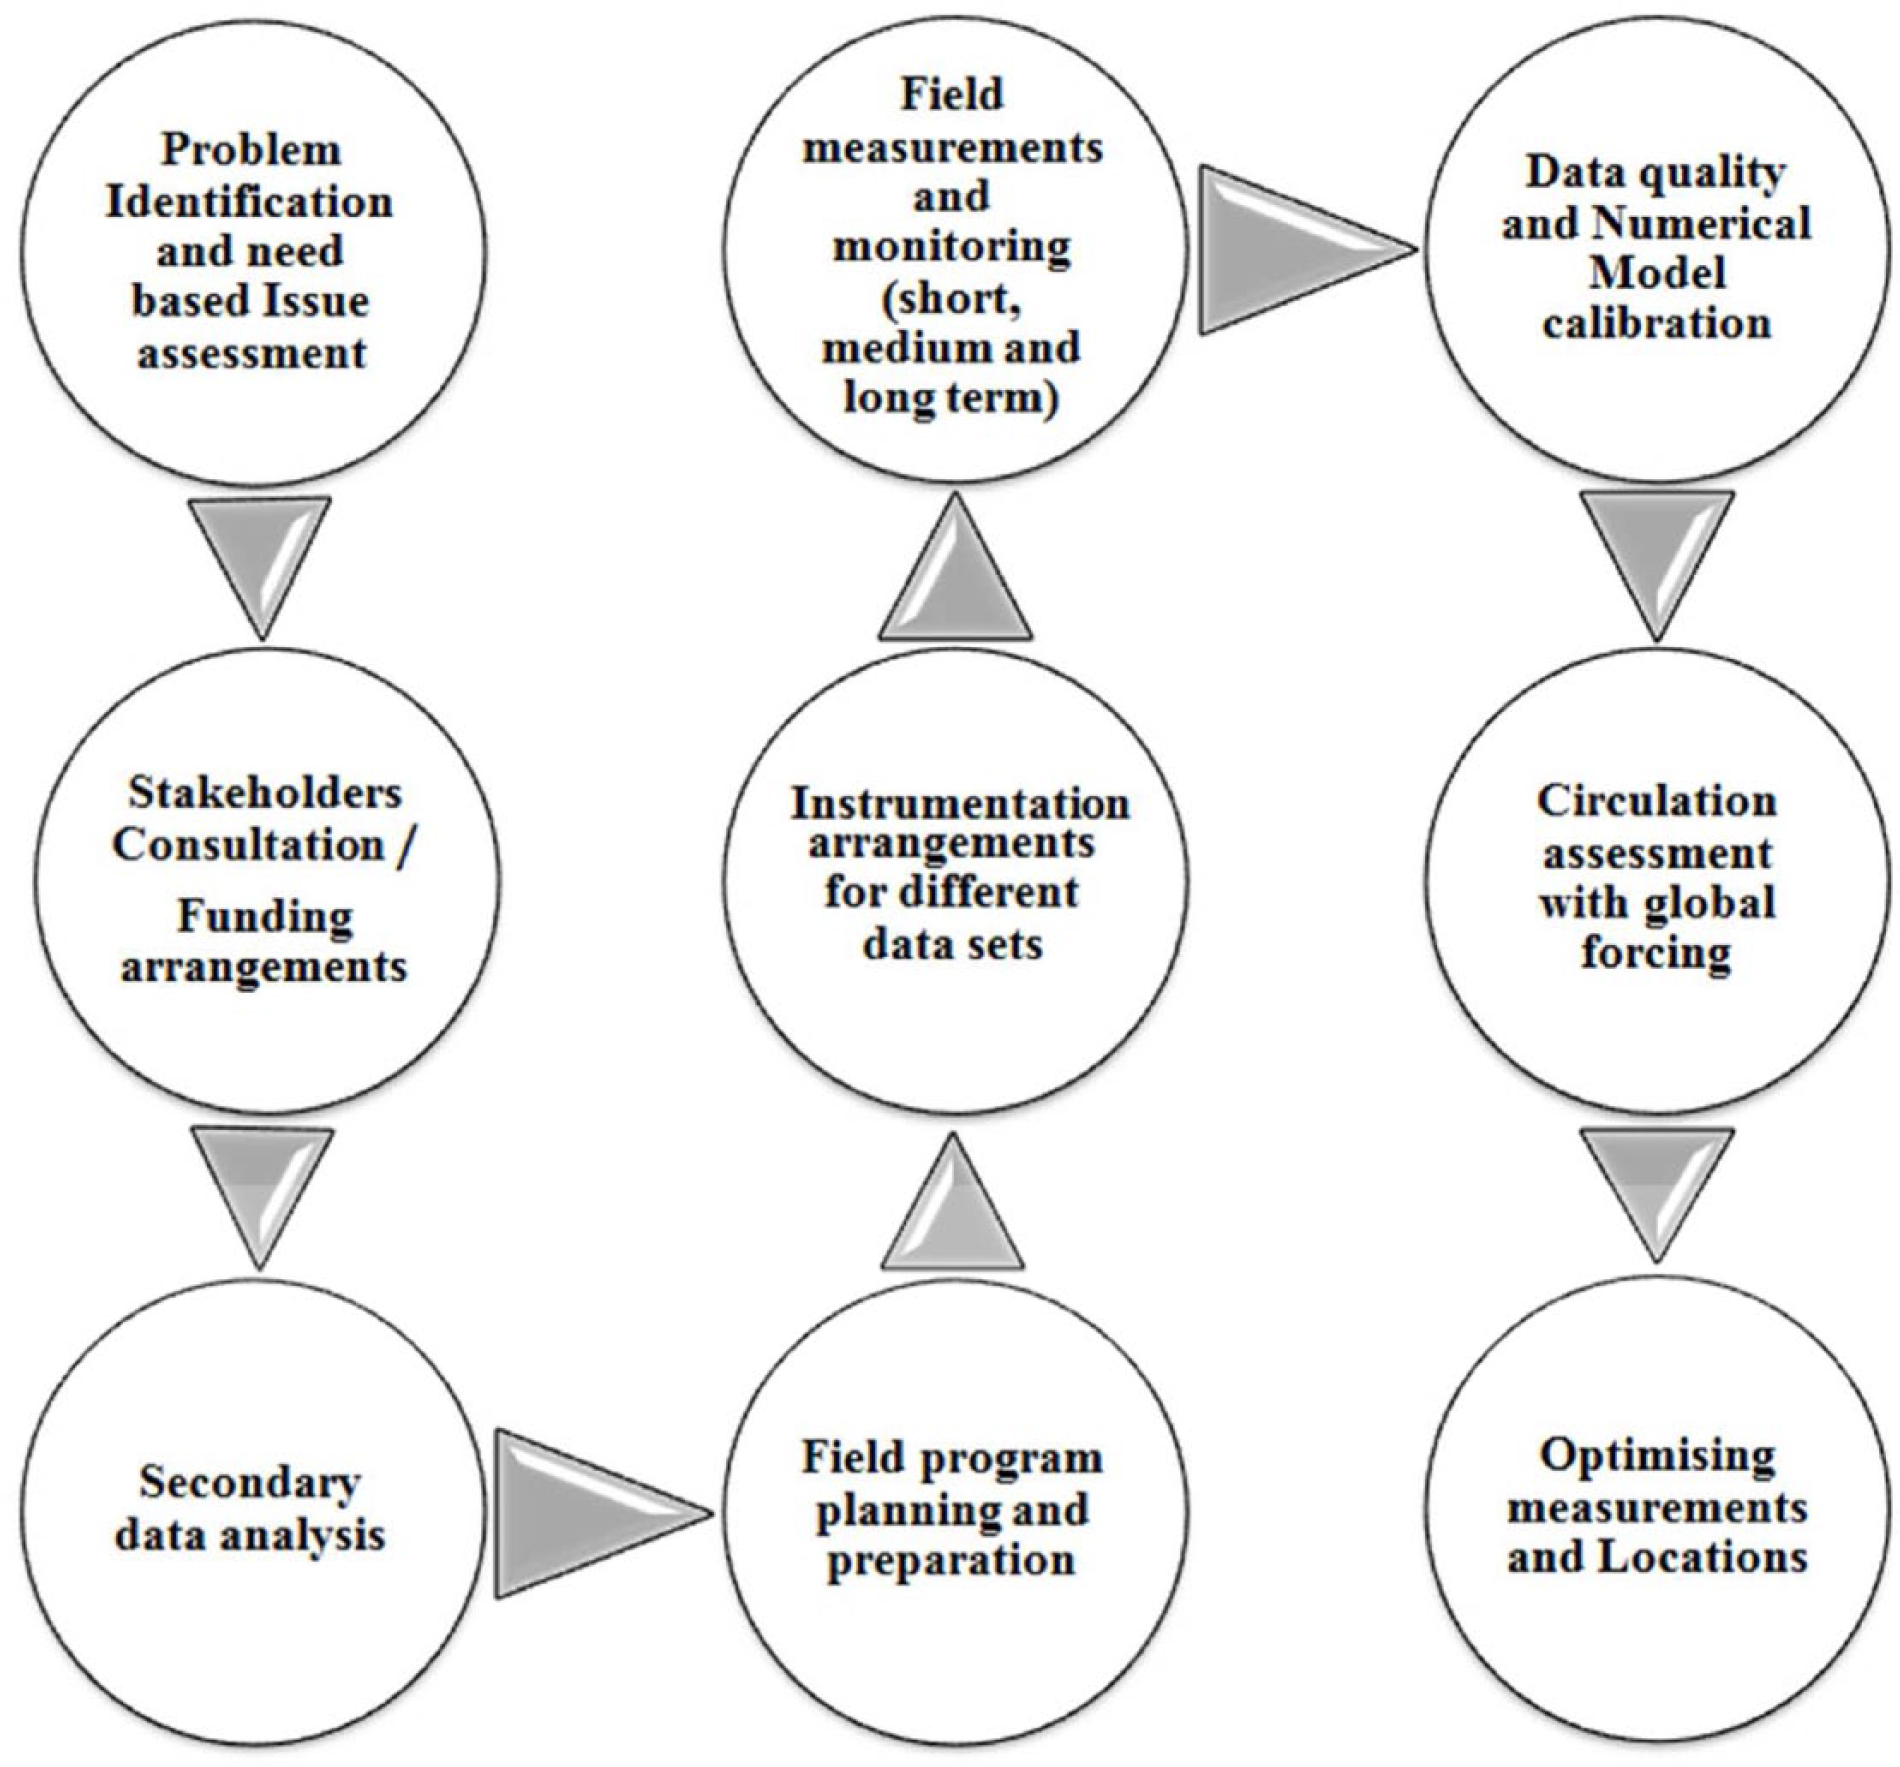
Stages in development of a field operational plan.
Sivakholundu et al. (2014) have given a brief overview on the problem. This study is formulated based on it. The area falling in a micro-tidal region with minimal water level gradients, greater emphasis was laid on other parameters. This includes met-ocean elements, observed independently against requirement.
Site description
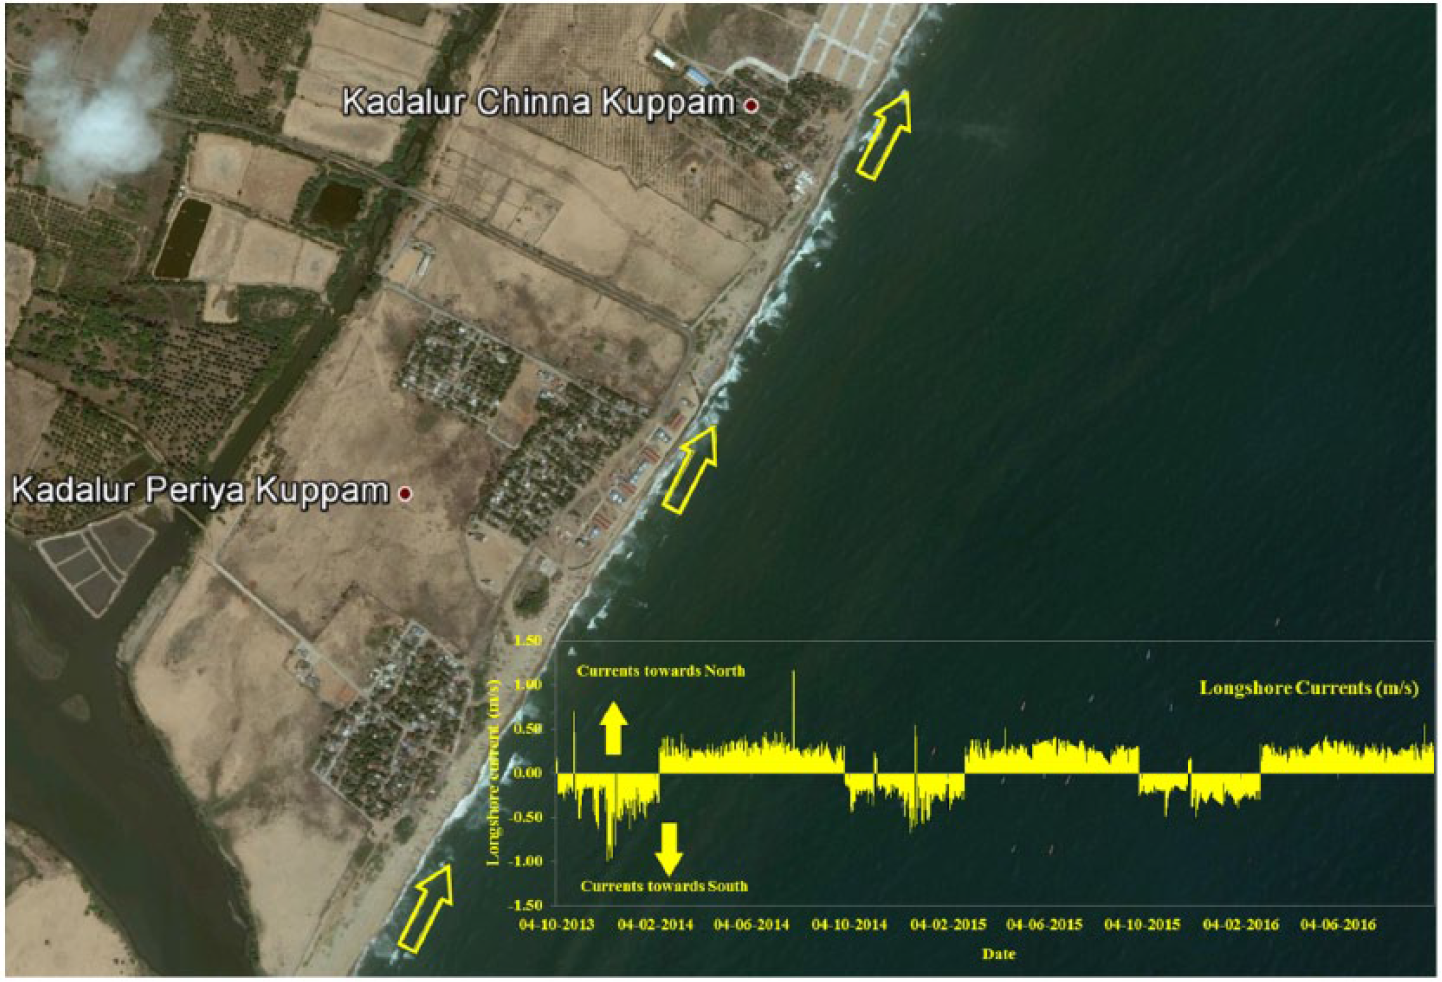
The said site falls on the south of Chennai, India. Kadalore Chinnakuppam, Kadalore Periyakuppam (KPK) and Aalikuppam are three villages located closely within a distance of 0.5 km to the south of palar estuary (Figure 2). This region has undergone severe erosion since 2011, owing to tropical cyclones in the Bay of Bengal, namely, Thane in December 2011, Nilam in October 2012 and Madi in December 2013, which created a permanent drift in coastline kinetics. The beach has not recovered naturally over subsequent years. This resulted in exposure of coastal buildings to direct wave battering (Figure 3). Generally, east coast is understood to have a net northward drift with seasonal inversion. The discharges through the river are largely uncertain owing to upstream dams and non-perennial nature.
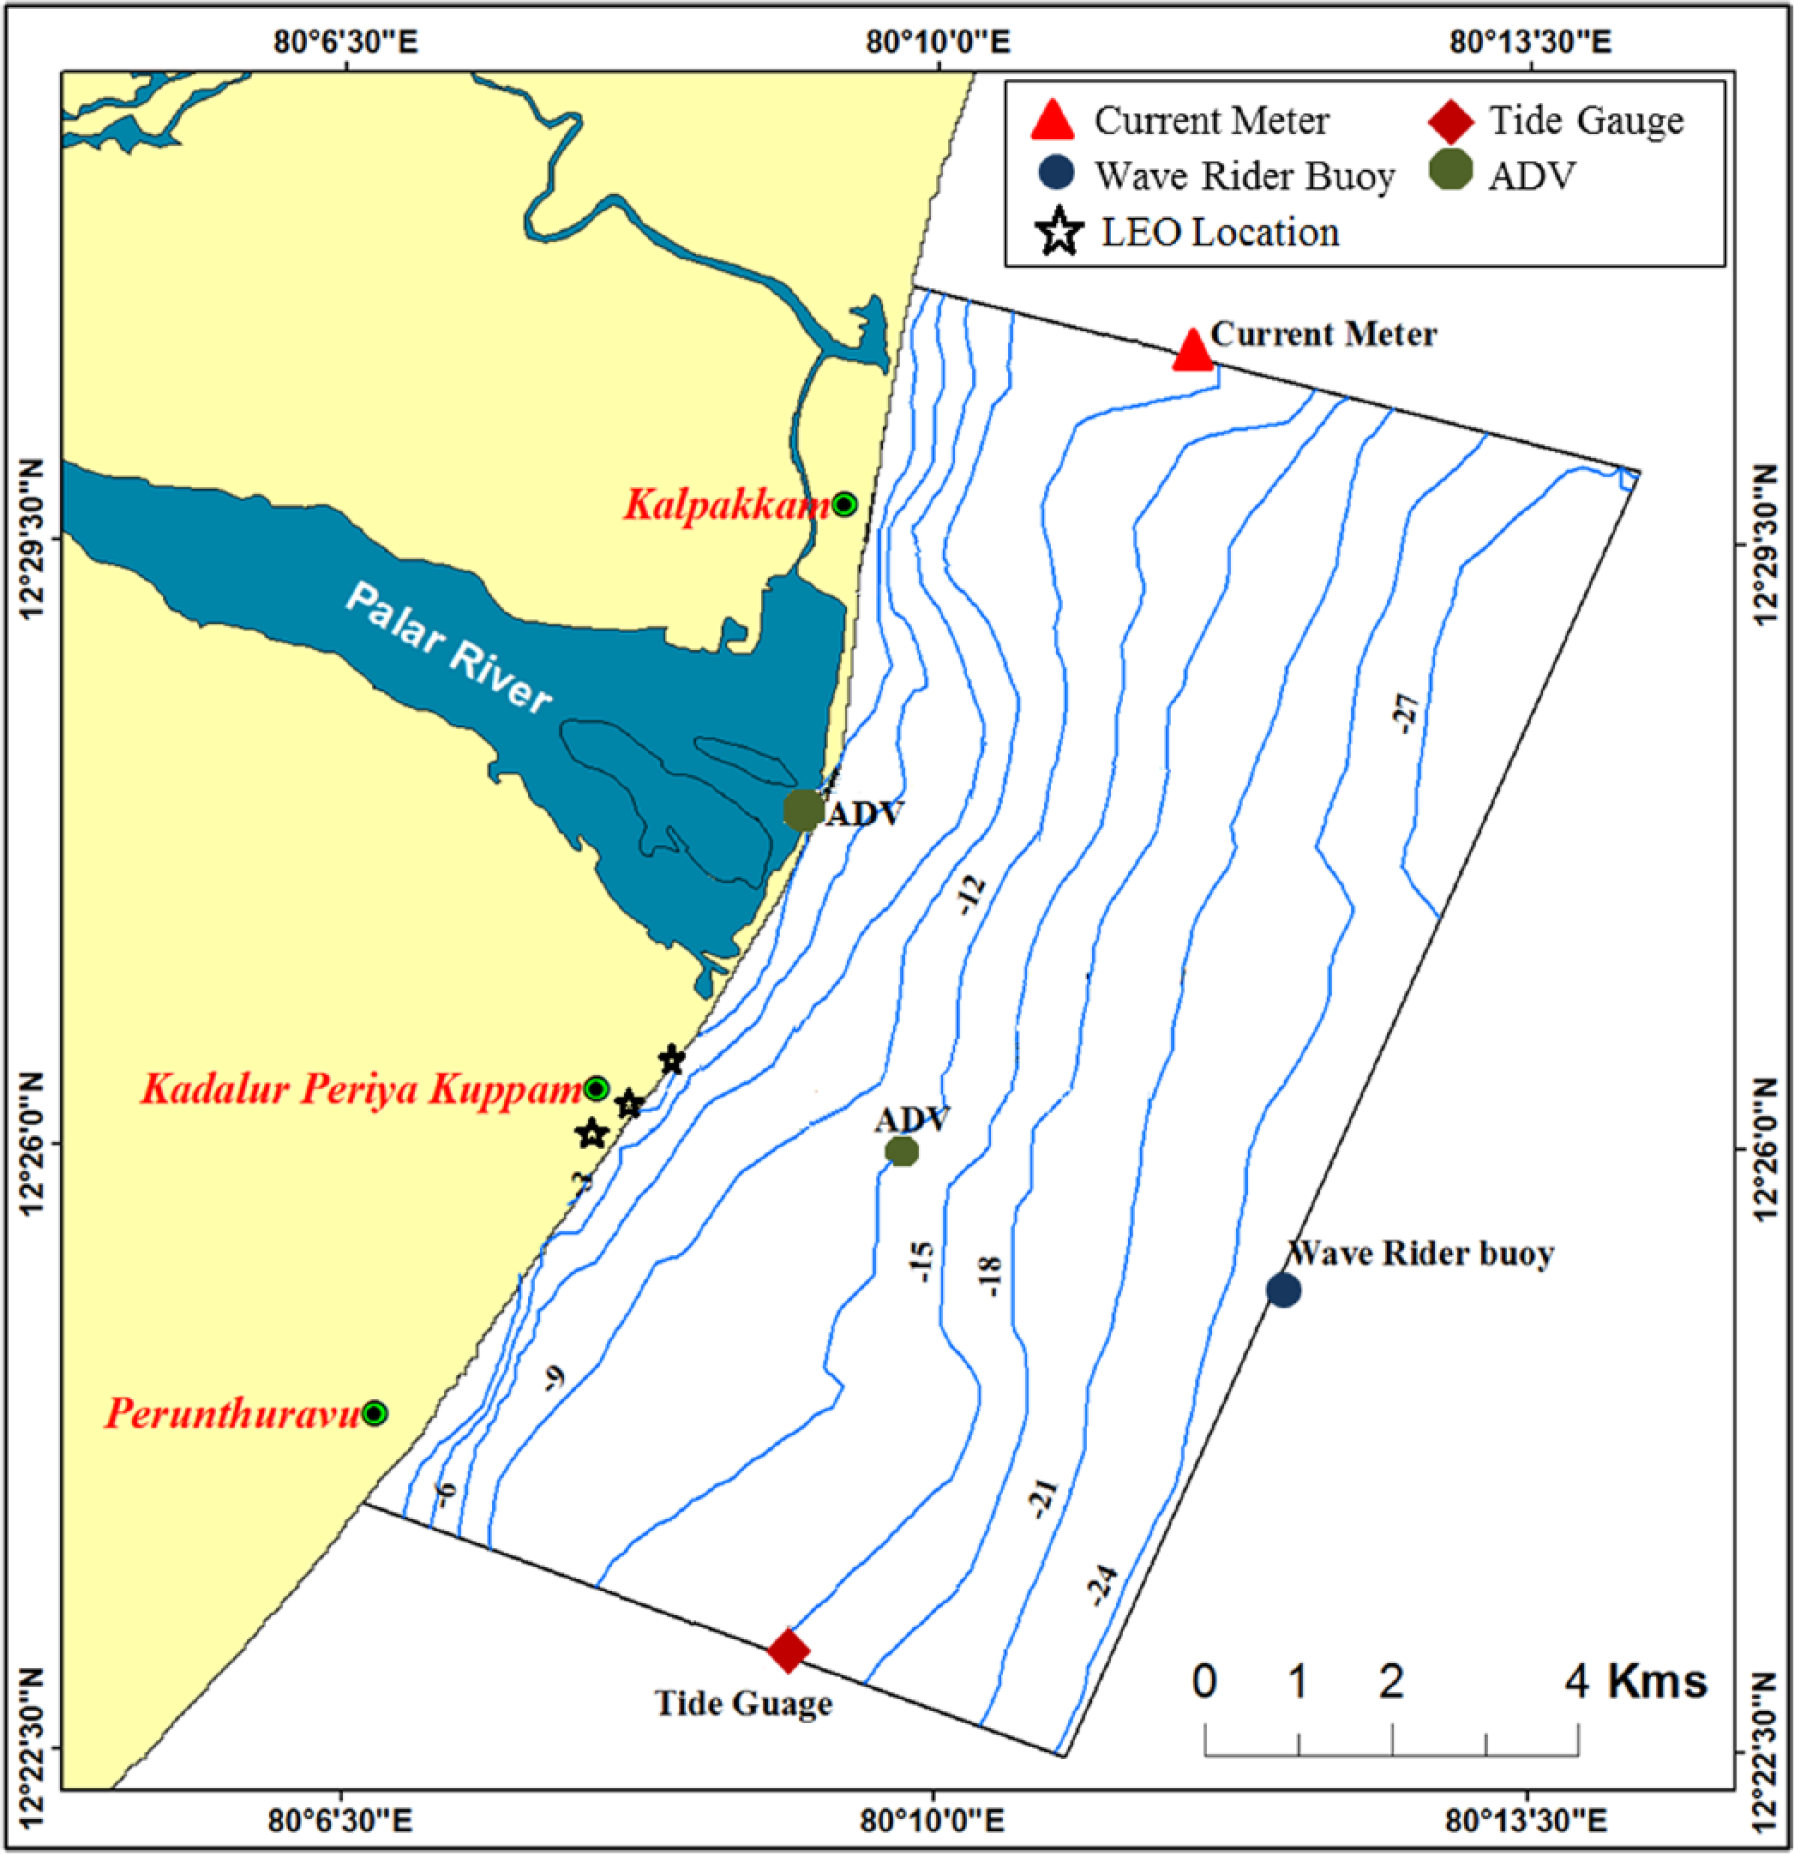
Location of Kadalur Periyakuppam.
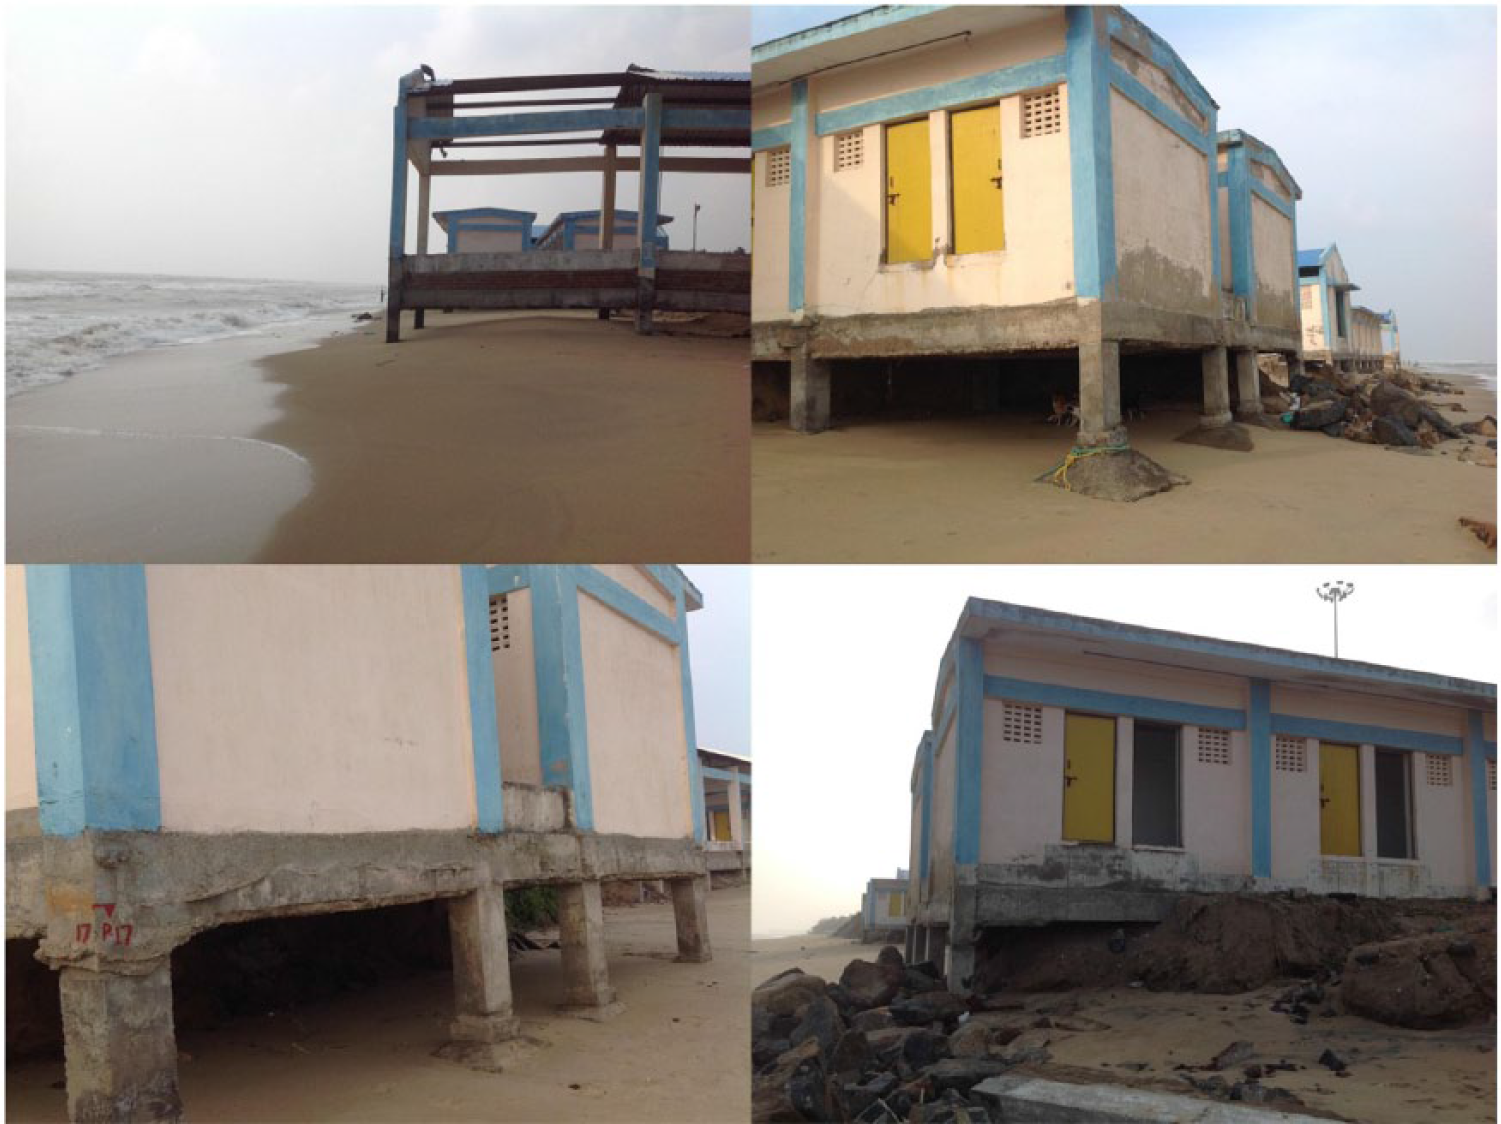
Exposure of building foundation due to waves.
Field observation plan
At first, a field monitoring plan has been prepared to quantify variation in the beach volume over a period. Real-Time Kinematic (RTK) GPS surveys were employed to establish beach profiles. Surveys were conducted every month at spring low tides. The unit width volumes along with gridded data sets on very fine site data were calculated across the entire stretch. Littoral Environmental Observation (LEO) was carried out to have a manual feel on the breaking characteristics and estimate long-shore current (Figure 4) by using simple methods proposed by Schneider (1981).
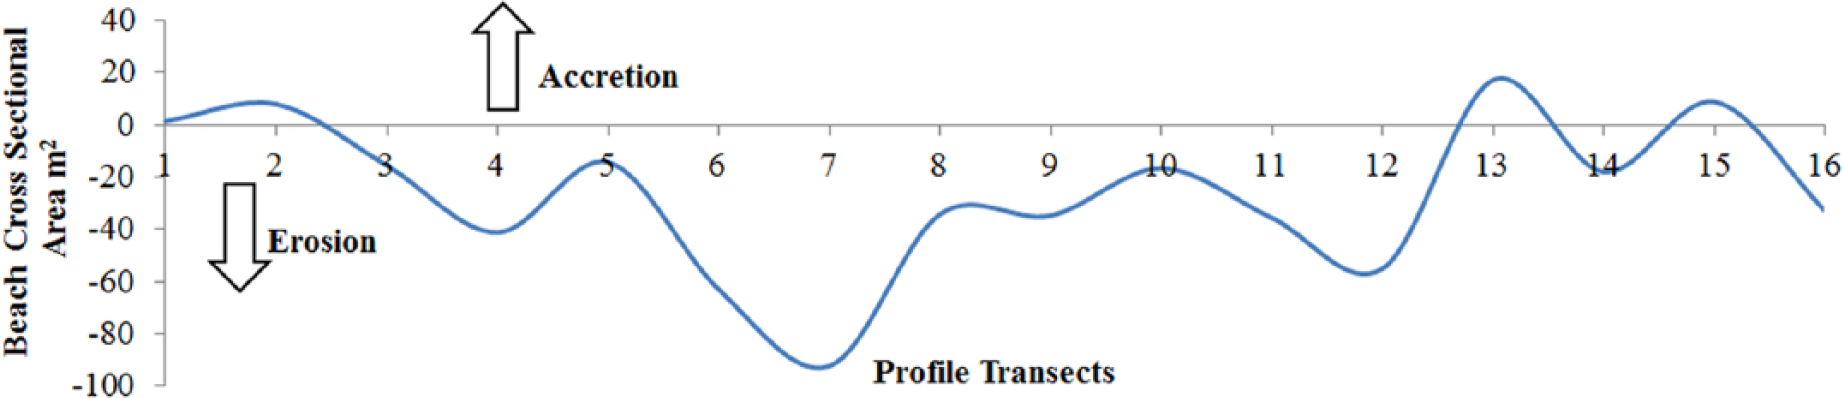
Total beach area changes from October 2012 to September 2016.
Annual changes in the beach area above water level (Figure 5) were carried out in Shoreline and Nearshore Data System (SANDS) package and net erosion has been observed. The net annual average long-shore sediment transport rate calculated using Central Electricity Regulatory Commission (CERC) formula (Coastal Engineering Manual, 2002) is 0.33 × 10⁶ m3 (Table 1). The magnitude is in acceptable limits with existing literature (Jena et al., 2001). With a brief understanding of the net changes, a process-based model is planned for further assessment. This includes wave transformation and two-way coupled flow hydrodynamics. Coupled wave and hydrodynamic model has been used by Bhaskaran et al. (2014), Murty et al. (2014), Gayathri et al. (2016) and Murty et al. (2016) to study cyclonic impacts on coast inundation in a regional level. The present model domain is constructed such that it reflects all the above-mentioned shallow water processes. This requires a calibration of flow model to properly represent the wave refraction by the current, circulation cells if any. An initial validation against measurements is essential as the sensitivity of littoral transport to friction is expected to be high.
Long-shore currents measured using LEO plates.
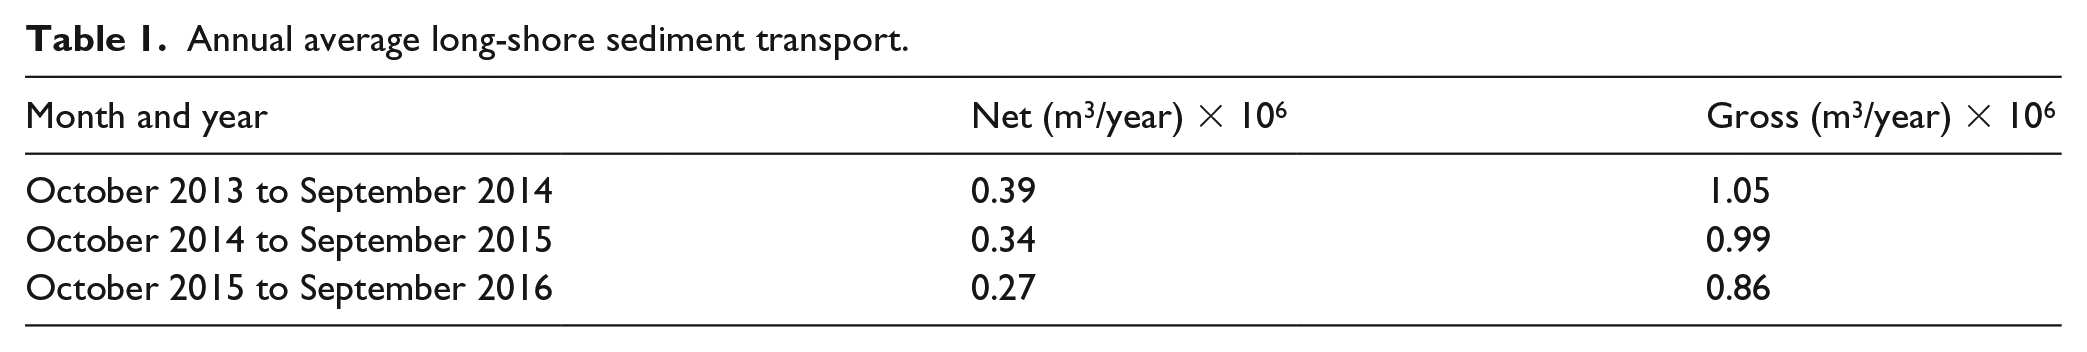
Annual average long-shore sediment transport.
Keeping above aspects, a deployment plan has been prepared (Figure 2). After a thorough sensitivity assessment, feasibility for deploying instruments was extensively deliberated and measurement depths are arrived. The collection strategy includes continuous and rapid measurement sessions. The measurement scheme planned includes a current meter in the northern section, a tide in southern portion and waves offshore. An integrated measurement inside the control boundary at two locations was planned for the validation. LEO observations were carried out on a daily basis for a long-term assessment.
Instruments used
Bathymetry was obtained from field surveys using echo sounder and DGPS, logged on the Hypack software. Measurements such as wave, current and water levels have been carried out for 16 days between 29 January 2016 and 13 February 2016.
Wave measurement was carried out at three locations by instruments of different make. Datawell make GPS-based directional wave rider buoy, deployed at 24 m of water depth, around 7 km offshore from Kadalur Periyakuppam. Acoustic Doppler Velocimeter (ADV) is deployed at 12 m, 4 m water depths in line with the first location. The advantages of this deployment include collection of wave, current and tide information simultaneously.
The Wave and Tide Recorder (WTR) measures tide and RCM 9 captures the current data. LEO plates were used and GPS floats were deployed for the calibration. Trained personnel were deployed for carrying out the surf zone characteristics including LEO.
Numerical model
The numerical model was setup on Delft3D suite. The model domain was aligned with the control boundary, with incremental resolution curvilinear grids (Figure 4). A coupled wave and flow model was simulated to calibrate with the data measured off KPK at 12 m depth. Measured wave, tide and current data sets are used as model boundaries to assess the calibration of underlying variables. Bursts in data are avoided as current generation numerical models become computationally expensive for such assessments. A comprehensive validation has been undertaken against measurements.
Although the measurements are verified and quality controlled, certain stretches remain flagged and authenticity cannot be established. Such data sets were kept in suspension. Although the beach erosion can be largely attributed to the wave and calibration of the model has been undertaken extensively, the third-generation model still has limitations in very shallow water. Sensitivity to different formulations is not undertaken at the moment and standard cases are expected to be representative. Wind-induced circulations in shallow water is another major factor, which can alter the tidal flow direction.
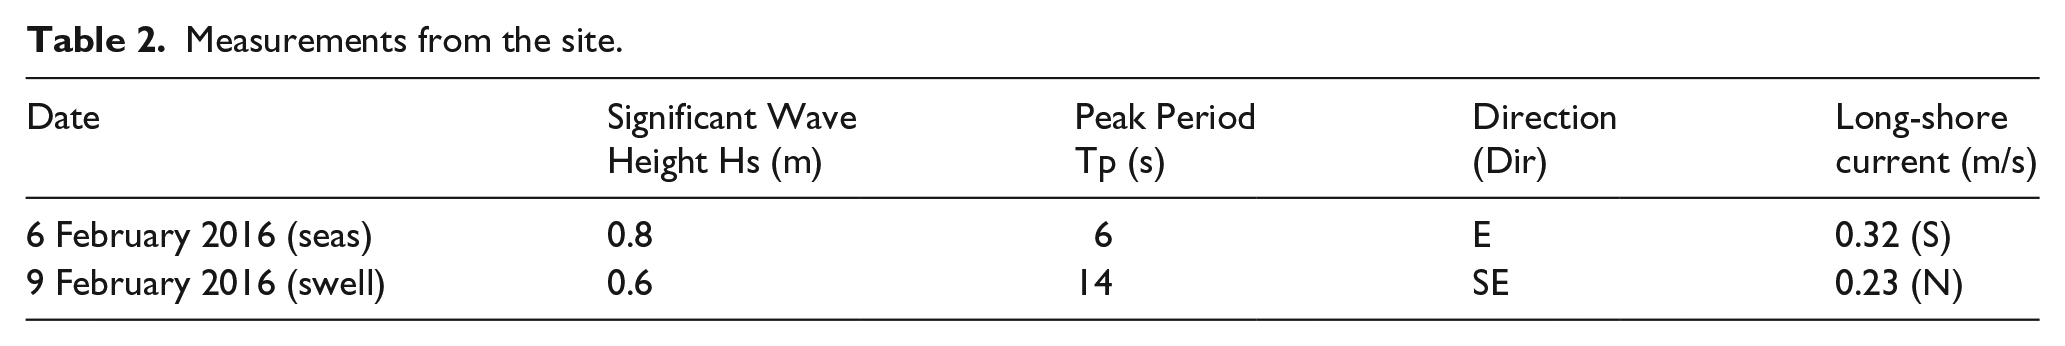
The above model has been input with boundaries derived from the global models on a time-to-time basis, and the surf zone width and long-shore current were estimated. The sediment transport model of Van Rijn (2007) was used to estimate the drift. The advantage of the two-dimensional (2D) model was taken to assess the formation of bars. The model-derived depth-averaged velocity for sea and swell conditions (Figures 6 and 7) along the coast clearly captures the pattern of near-shore currents due to breaking waves from which the point of measurement is further planned to observe more intensively. The results are validated against LEO measurements, as presented in Table 2. With these generated information, the observation locations were altered spatially to capture the required along-shore current characteristics both spatially and temporally, the bathymetry surveys on the bar migrations. With above-said strategy, LEO data set for over 3 years was collected so far.
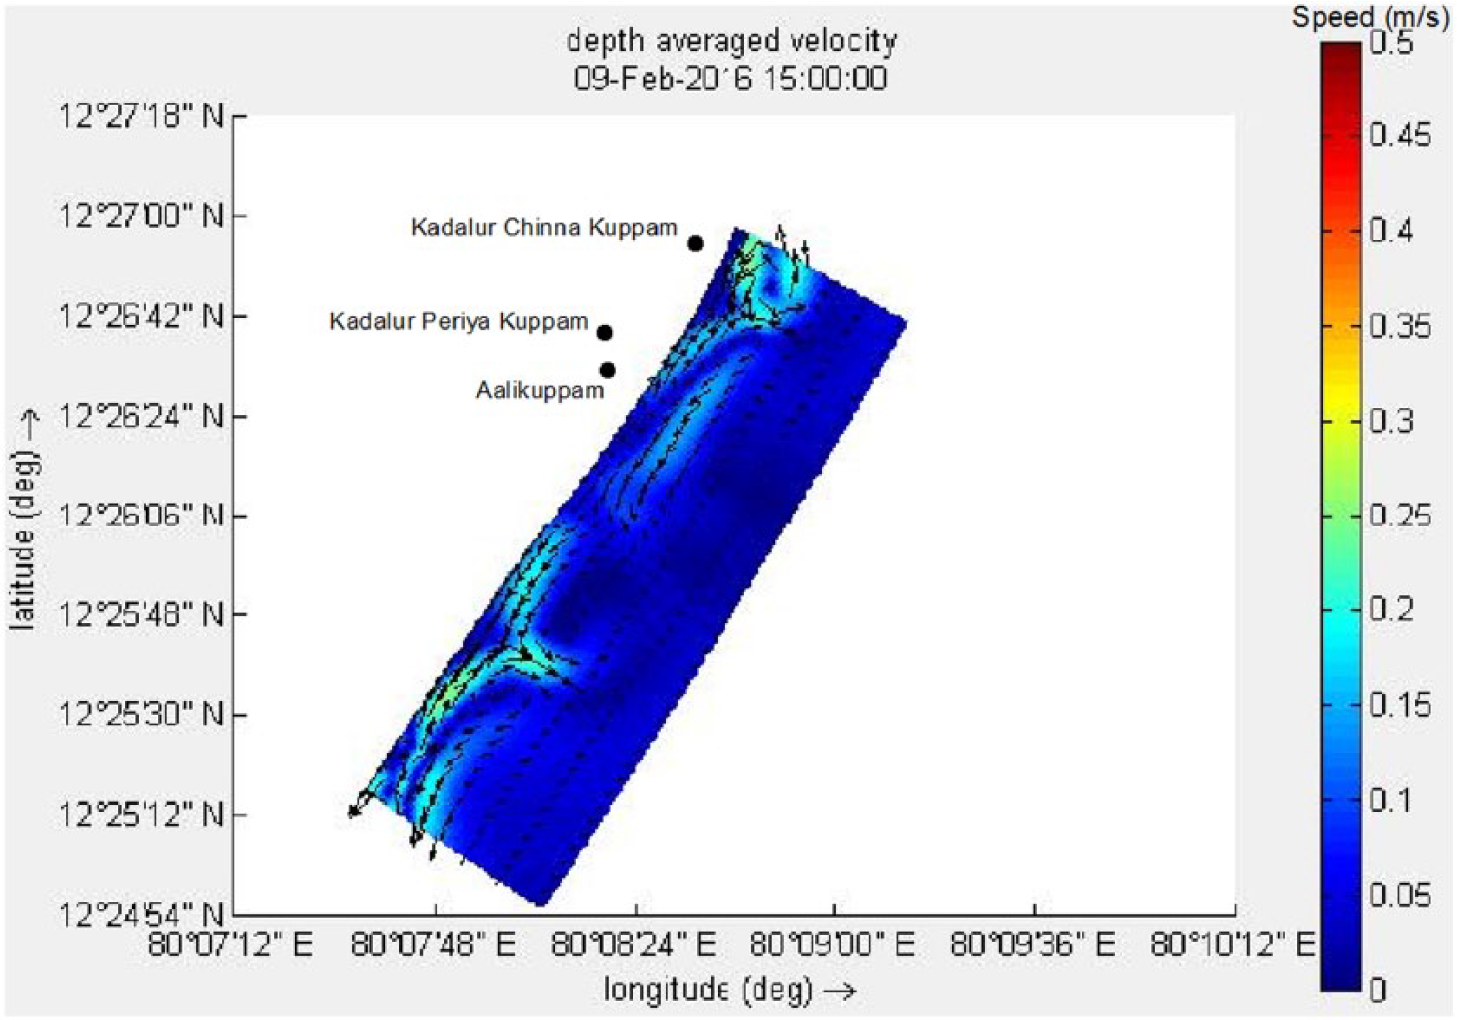
Depth-averaged near-shore currents during swell.
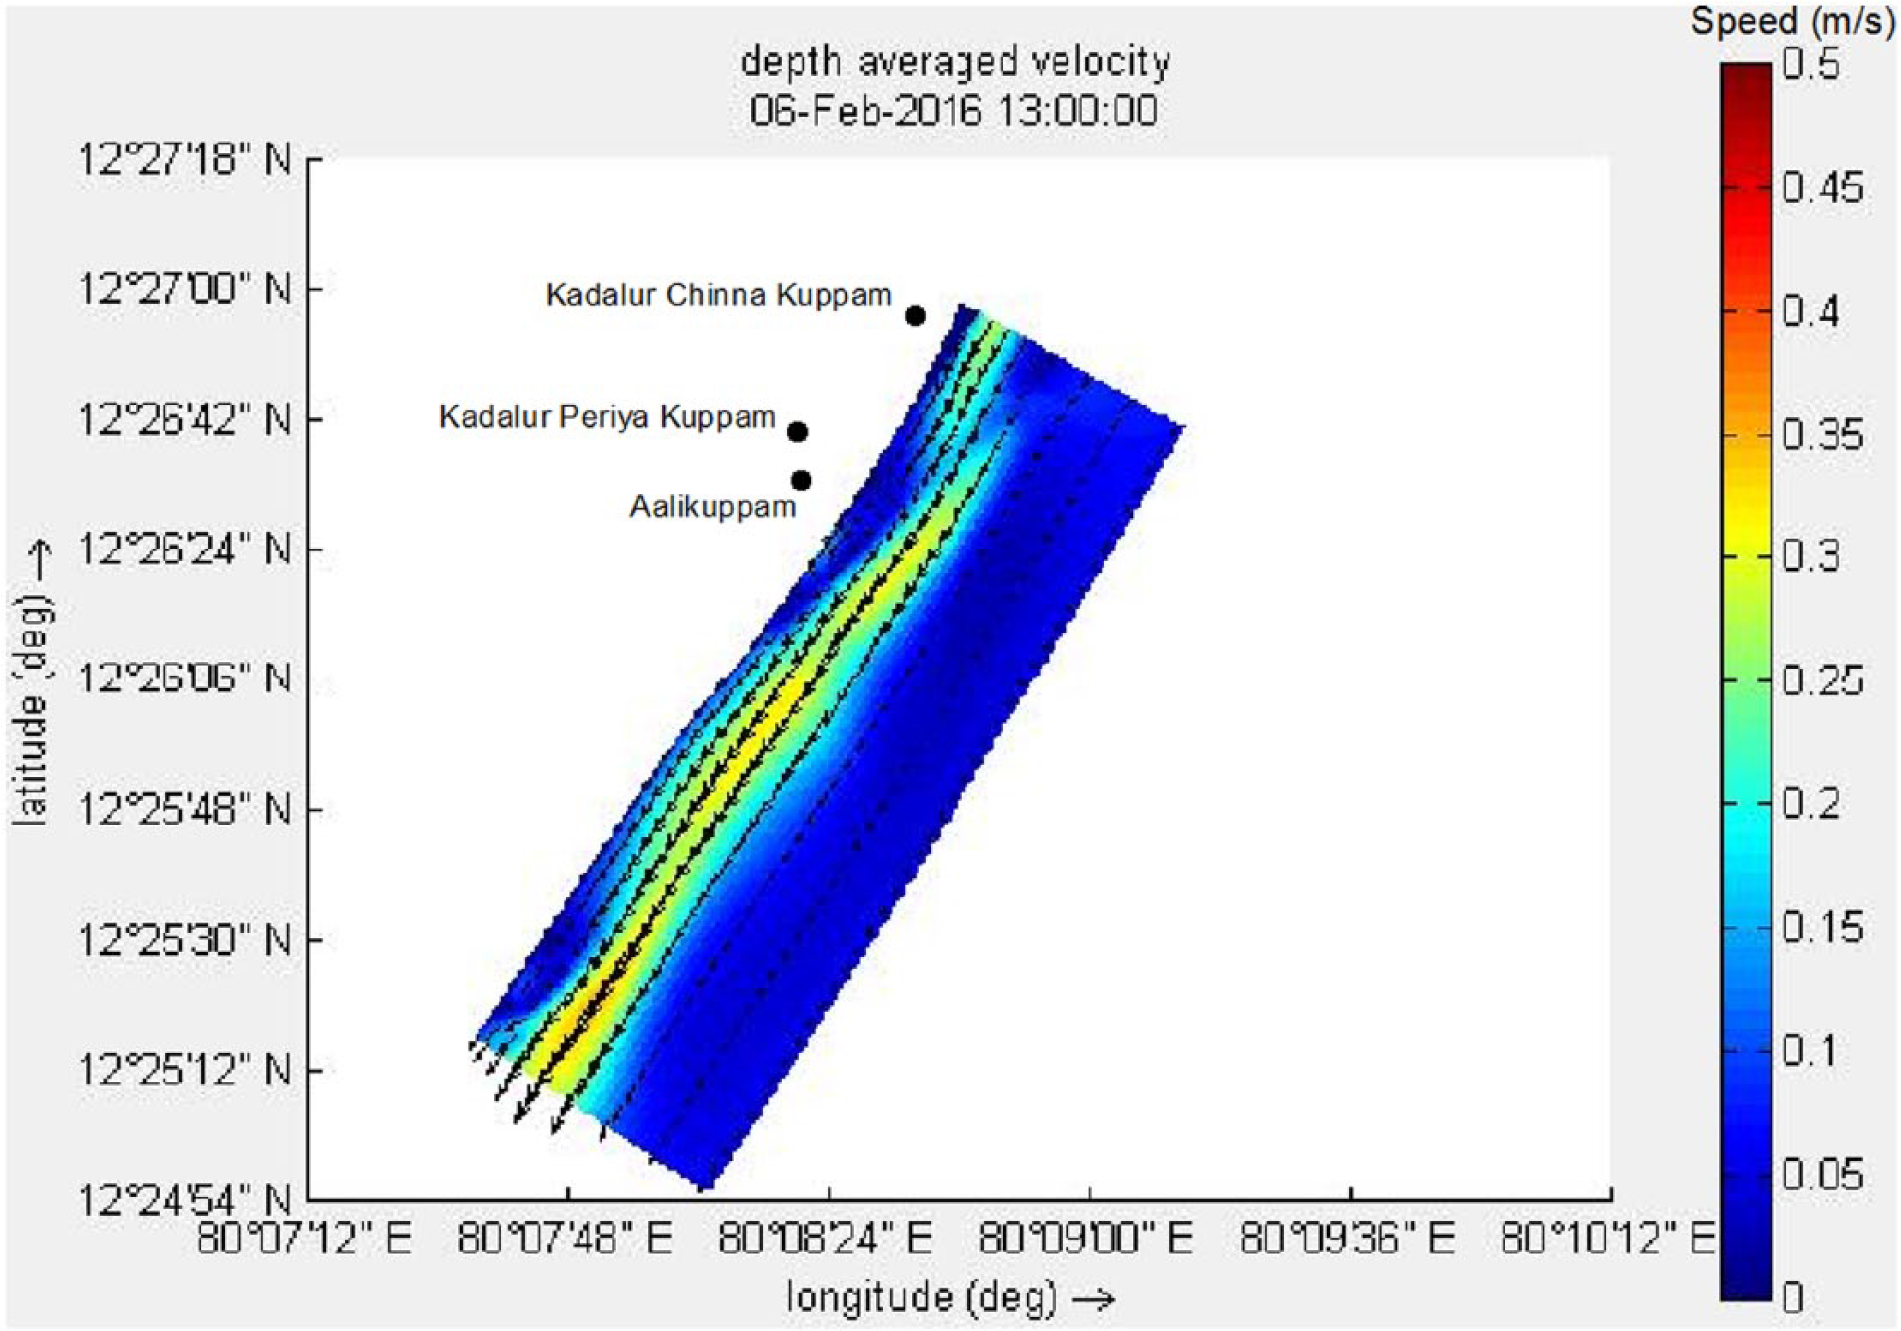
Depth-averaged near-shore currents during seas.
Measurements from the site.
Conclusion
The present coast is observed to be influenced by tropical climate system and that of Bay of Bengal, having two monsoon spells with seasonal winds and driven circulation. Additionally, storm waves batter the coast at least once in a year, which sets different erosional rates on the coast within the season. So a systematic deployment plan under the adopted operational strategy is to be followed.
Erosion control measures for any coast requires an extensive understanding of the coastal setting and sediment transport patterns. Measurements in near-shore environments are often tedious and more expensive due to uncertain environmental conditions with breaking waves, swift currents and surprisingly vandalism. Innovative methods wielded out of experience are adapted for each specific cases. The operational strategy thus plays a vital role in data collection methodology to find a suitable solution based on the existent scenarios. It has to be understood that the strategies often differ with issues faced by the coast of interest.
With the given methodology of measurements at site, calibration and numerical modelling prediction going hand in hand according to the operational strategy setup for this location, desirable along-shore currents were achieved. The strategy also recommends long-term field measurements for a complete understanding of the site.
Footnotes
Acknowledgements
The authors thank, The Secretary, MoES for funding and the Director, National Institute of Ocean Technology, for his encouragement. The authors are thankful to the project director for the guidance and support.
Funding
The author(s) disclosed receipt of the following financial support for the research, authorship, and/or publication of this article: This present work is part of the research project ‘Shoreline Management (SM)’ funded by Ministry of Earth Sciences (MoES), Government of India.