
Abstract
A finite difference–based three-dimensional modeling has been conducted to evaluate tidal power density at different locations along the Gulf of Khambhat, India. The model uses the Navier–Stokes transport equation in three-dimensional plane under the assumption of shallow water and Boussinesq. The model results were validated with observed water levels and currents available in the literature. The Gulf has strong and varying currents and associated circulation patterns, especially in the northern region, due to complex bathymetry. The current velocities and corresponding power densities were computed for different vertical layers of the entire model domain. The maximum tidal current velocities are found in the northern region along the narrowing part of the Gulf. The estimated values are 2.6 and 1.5 m/s during spring and neap tidal cycles, respectively. Then, the energy flux approximation method has been used to estimate the tidal power densities along the gulf spatially and temporally. The estimated maximum available potential is about 3 and 0.7 kW/m2 during spring and neap at two arbitrary point locations, respectively.
Introduction
Sustainable renewable energies are considered as alternate to the fossil fuel, especially with respect to the present day environmental and climate conditions. As of now, major power generation in India depends on conventional energy sources, coal and fossil fuels, which are believed to be contributing to greenhouse gas emission and thereby global warming. However, in recent times, the Indian power sector is increasingly attempting to tap electricity from various renewable and sustainable energy sources.
Tidal current–based energy, one of the marine renewable energies, has received widespread attention in recent times because of awareness, need and technological development. India has a long coastline of about 7500 km; there are several bays, gulf and inlet estuaries along the coastline, which create variation in currents, and tidal currents in some of these regions are strong enough to convert kinetic energy into electrical energy; a few potential locations are reportedly feasible for tidal energy extraction (Souvik et al., 2016). The maximum estimated tidal range is about 11 m in the Gulf of Khambhat and 8 m in the Gulf of Kachchh, and the associated tide-induced current velocity reaches up to 3 m/s (SatheeshKumar and Balaji, 2015; Sathish Kumar and Balaji, 2015). Whereas, the maximum tidal range along the Ganges Delta in the Sundarbans region is about 5 m with an average range of about 2.97 m (Sovik et al., 2016). The previously reported power potential in the Gulf of Khambhat, Gulf of Kachchh, and Ganges Delta in the Sundarbans is about 8000, 7000, and 1200 MW, respectively. In 2010, Kalpasar Tidal Power Project was initiated to identify potential tidal power extraction locations, and the report clearly shows that the Gulf of Khambhat is the most promising site compared to all other regions along the coast of India (Ministry of New and Renewable Energy (MNRE), 2014).
For the assessment of the tidal power resources, the selection of appropriate sites and prediction of available energy are extremely important. In general, tidal modeling, supported with measurements, is commonly adopted to estimate the available power potential. Blunden and Bahaj (2006) identified the tidal energy resources at Portland Bill, UK, using a two-dimensional (2D) tidal hydrodynamic model, and the results were used to optimize the location of tidal turbine. Carballo et al. (2009) conducted finite element modeling to evaluate the tidal energy potential in the Ria de Muros, Spain during spring–neap tidal cycle. Karsten et al. (2008) used finite control volume method to obtain the maximum power and also to examine the effect of turbine around the Bay of Fundy, Gulf of Maine.
Some of the researchers used various modeling techniques and examined the environmental impacts on the estuary or gulf during energy extraction. Ramos et al. (2014) carried out an assessment study to examine the impact caused by the operation of a tidal farm, and their results reveal that turbine changes the circulation pattern and current speed in the Ria de Ribadeo. Simon et al. (2009) analyzed sediment dynamic patterns around the tidal stream turbine on the British channel using a simple one-dimensional (1D) modeling technique and concluded that sediment dynamics is stronger in the tidal asymmetry region than the tidal symmetry region. Sanchez et al. (2014) studied the impact of floating and bottom-fixed tidal turbine on the estuarine circulation in the Ria de Ortigueira.
Accurate prediction of tidal characteristics of a region is essential for tidal power potential assessment. Although past studies have proven that the tidal ranges and associated currents are significant along Gulf of Khambhat, to the best of the authors’ knowledge, any three-dimensional (3D) analysis of the tidal hydrodynamics of the gulf was not investigated before, and this fact motivated this study. The aim of this study is to estimate and map the available tidal power energy in the Gulf of Khambhat, India, using 3D hydrodynamic modeling. The model results were calibrated and validated with observed water levels and current velocity, reported in the literature. The current velocities were applied to the power estimation equation to get spatially varying power densities at different layers in the water column, over a spring tidal cycle. The assessment of the tidal current energy resources along the Gulf is useful for site selection.
Study area
Gulf of Khambhat (Figure 1) is a funnel-shaped basin located in the Arabian Sea spread over the west coast of India. This region has significant interest among the scientist and researchers due to its complex hydrodynamic pattern as well as potential growth of various industries such as shipping, oil, and gas. The gulf is about 230 km wide at the southern end and narrows down toward the north-east, with a total length of about 250 km. Several inlets and creeks are located along the gulf, which is formed by confluence of many river discharges such as Narmada, Tapti, Mahi, Sabarmati, and Shetrunji. The discharges of the Narmada River, which is the major river, range between 10,000 and 60,000 m3/s during monsoonal floods (Chamyal et al., 1997).
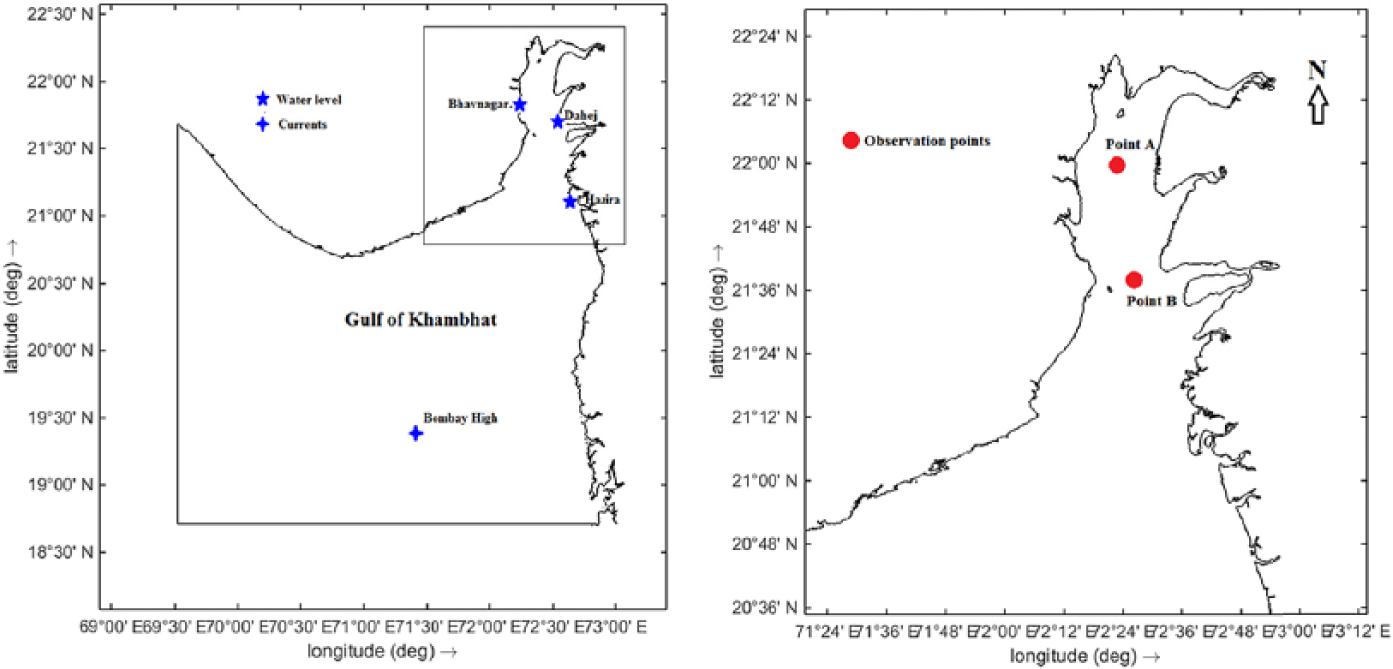
Location of the study area with observation points.
The water depths vary from 10 to 30 m along the northern part of gulf; also, it has a very large tidal flat that offers a great amount of friction to the tidal propagation. The type of tides in the gulf is mixed semi-diurnal with large diurnal inequality and varying amplitudes. The tidal range is the largest as compared to the other part of the Indian coastline because of its complex shape and sudden seabed variations on the head. The maximum tidal current velocities exceed 3 m/s at some locations of this gulf (SatheeshKumar and Balaji, 2015; Sathish Kumar and Balaji, 2015). The complex circulation pattern with strong tidal currents will bring the sediments brought up by the rivers in suspension and makes the water always turbid.
Numerical model
Governing equations
Delft3D-FLOW solves the following conservation of mass and momentum equations simultaneously under the assumption of shallow water and Boussinesq. Equation (1) expresses the conservation of mass for incompressible fluids, equations (2) and (3) express the momentum equation in x and y directions, and equation (4) expresses the conservation of momentum to the hydrostatic pressure distribution in z direction (vertical)
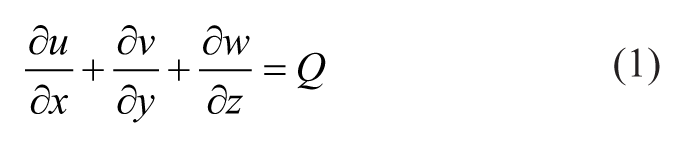
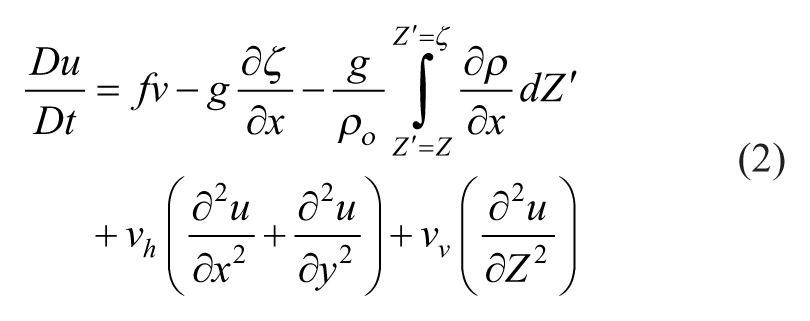
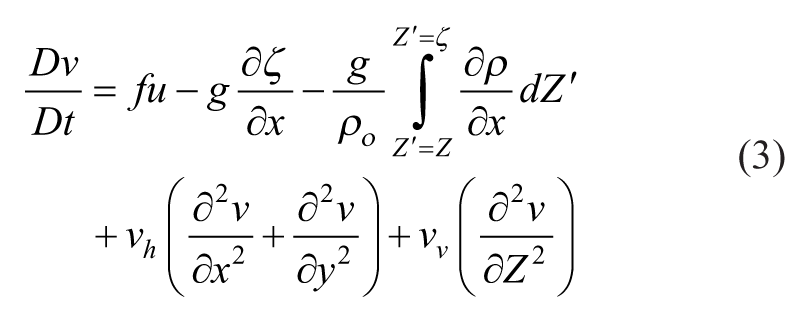
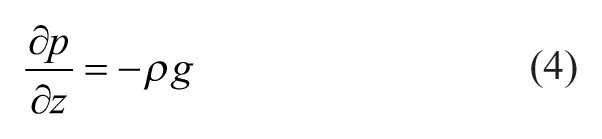
In the above equations, u, v, and w are the water particle velocity components in x, y, and z directions, respectively; ζ is the water surface elevation with respect to still water level (SWL) (z = 0); f is the Coriolis force; Q is the mass source intensity per unit area; g is the acceleration due to gravity; vh and vv are horizontal and vertical eddy viscosity components, respectively; and ρ and
The initial boundary condition was assumed at land margins as null velocity and zero shear stress, whereas the bottom shear stress has been computed using a quadratic stress law
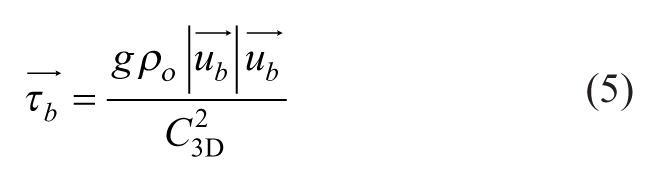
where
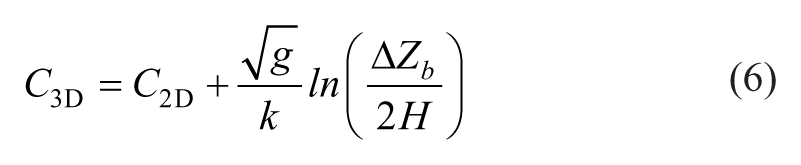
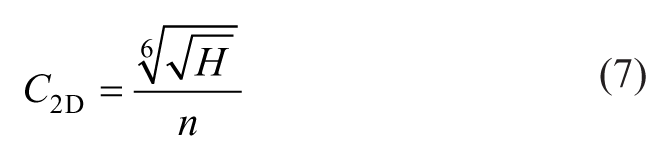
where ΔZb is the vertical distance between seabed and nearest computational grid point, H is the water depth, and k is the von Kármán constant (k= 0.41); with the help of Manning coefficient, C2D has been computed as follows
Model implementation
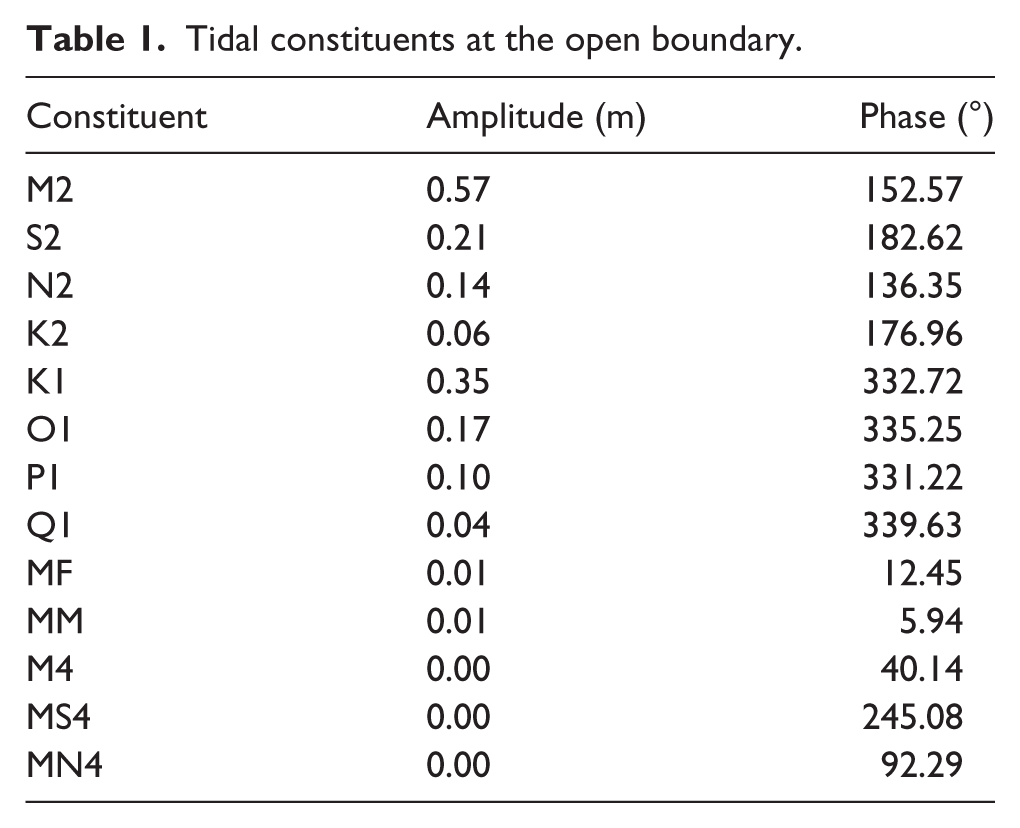
For the present modeling study, the entire Gulf of Khambhat basin has been chosen, as shown in Figure 1. The model domain was discretized into small rectilinear grids with a spatial resolution of 1.5 km along offshore boundary and 150 m on the northern portion of gulf. The option of Arakawa C-grid (Arakawa and Suarez, 1983) was used for this study, in which water level ζ defined in the center of the grid and computed velocities are stored in the mid position of grid cell faces, respectively. The open boundary condition was specified at a water depth of 2500 m along the offshore boundary line. Bathymetry of this study region has been extracted from various ADMIRALTY Charts (nos 1474, 1486, 1487, 1488, 2737, 3460, and 3465), as shown in Figure 2. For the development of 3D model, the boundary-fitted σ-coordinate layer system has been used vertically over the horizontal computational area of the model domain. The non-uniform thickness of 10 σ layers was adopted in this study from bottom to free surface of the water column. Open boundary was forced with 13 tidal constituents (M2, S2, N2, K2, K1, O1, P1, Q1, MF, MM, M4, MS4, and MN4) along the offshore boundary line, and these were extracted from a global tidal model TPXO 7.2 (Egbert et al., 1994), as given in Table 1.
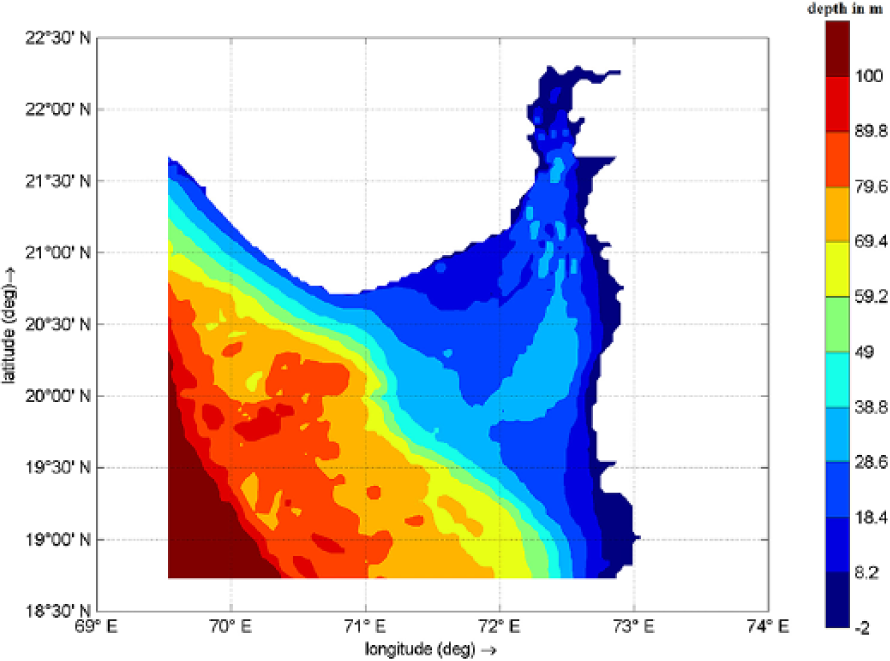
Interpolated bathymetry view.
Tidal constituents at the open boundary.
Results and discussion
Validation of model results
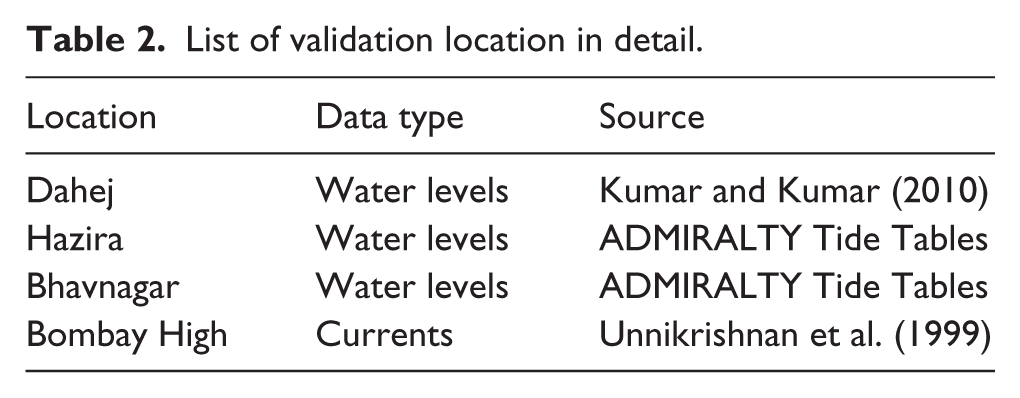
In order to validate our model results, the comprehensive collection of various datasets such as tidal levels and currents extracted from existing literatures was utilized (Table 2). It is to be noted that the calibration model constants have been systematically obtained and the estimated model results have been validated with an existing developed version of 2D model of the same study region earlier using wide range of datasets (SatheeshKumar and Balaji, 2015). In earlier studies, the gulf was divided into six zones with assigned values of varying bed roughness to obtain the tidal amplification factors along the gulf. The same assumption has been applied for this study. In addition to the adjustment of model parameters, the tidal levels and currents are validated vertically along the different water depths in the gulf to obtain better estimation of tidal power densities.
List of validation location in detail.
With the tidal constituents as a given boundary condition, the tidal levels are estimated along different locations in the gulf for the various periods, and these results were compared with the available datasets extracted from various sources, as can be seen in Figure 3. The hydrodynamic simulation was performed in the respective measurement period, as mentioned in Table 1. A spin-up period of 15 days was provided in the simulation timeframe to make sure the initial parameters do not affect the results. It can been seen from Figure 3 that the model can predict the hydrodynamic parameters even in the northern portion of gulf.
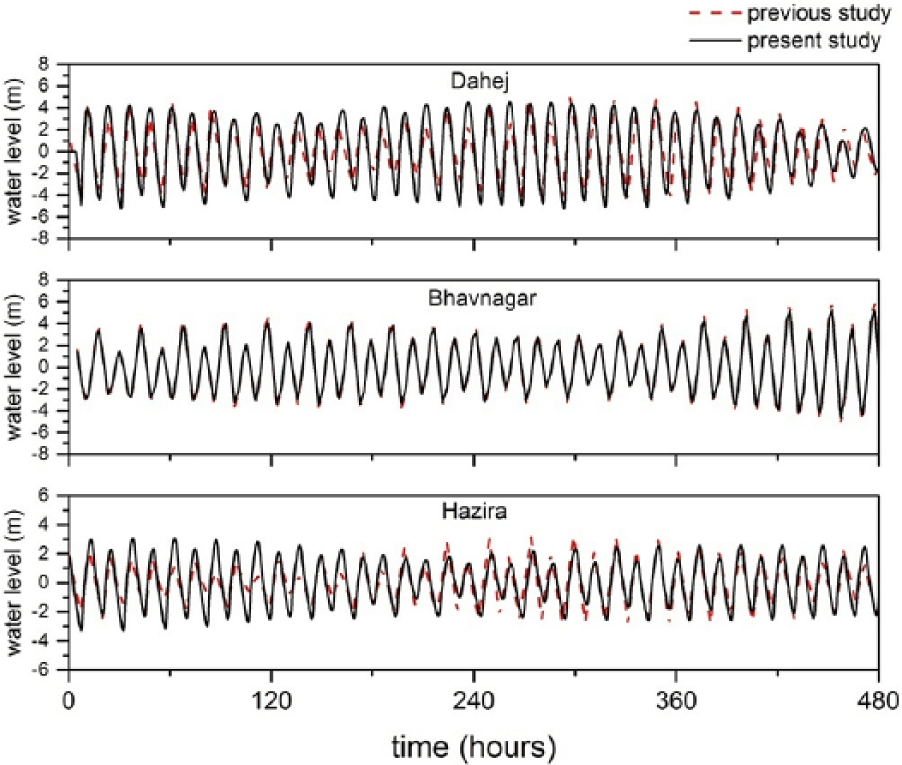
Comparison of water levels with measured data.
The tidal current velocities are obtained from 3D model results over the various depth of water vertically along the model domain and were compared with limited available data measured by Unnikrishnan et al. (1999), as can be seen in Figure 4. The reported currents were measured in a particular location (19° 24.5′ N and 71° 2.5′ E) at the Bombay High region (Fernandes et al., 1993). The overall water depth in this location is about 80 m, and the measurements have been carried out at four different water depths (30, 45, 60, and 75 m) during the period of 24 December 1981 to 3 January 1982, and these data were used to validate the present modeling study. It is clear from Figure 4 that the cross-shore velocity components are in good agreement with the measured data but along-shore velocities are over predicted, and it may happen due to varying spatial resolution of grid in along-shore direction or non-uniform thickness of vertical layers or numerical instability.
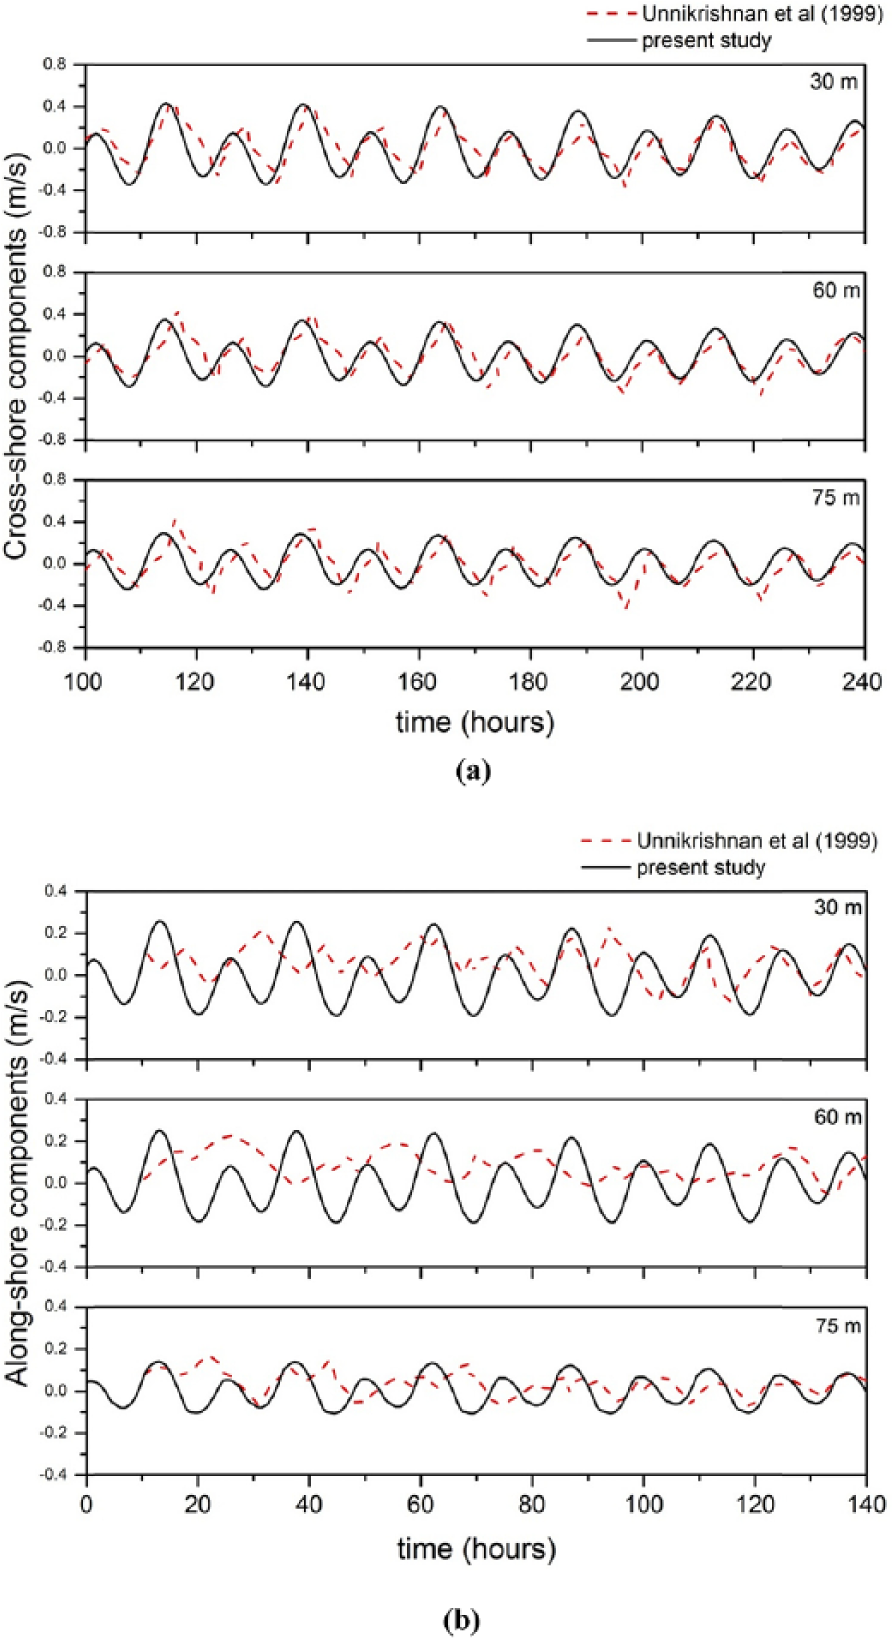
Comparison of tidal current velocities at the Bombay High region: (a) cross-shore velocity components and (b) along-shore velocity components.
In order to obtain better understanding of the hydrodynamic parameters, the spatially varying results were extracted and discussed in this section. The contour variations of tidal levels for the entire study region were extracted on mid-flood and mid-ebb during spring tidal cycle, and the typical results are shown in Figure 5 for the northern part of the Gulf, where the tidal variations are significant. For the tidal current assessment, the three different vertical water depth layers (near free surface, mid- and near-bottom) have been chosen for this analysis. The distribution of current velocities along with vector components during mid-flood and mid-ebb of a mean spring tide is shown in Figure 6. It is to be understood from Figures 5 and 6 that even the near-bottom layer currents have a velocity of about 1 m/s at certain locations in the northern part of the Gulf. This amount is less compared to surface and middle layers but it is more than enough to rotate tidal turbine, which motivates the estimation of tidal power densities in this region, as described in the following section.
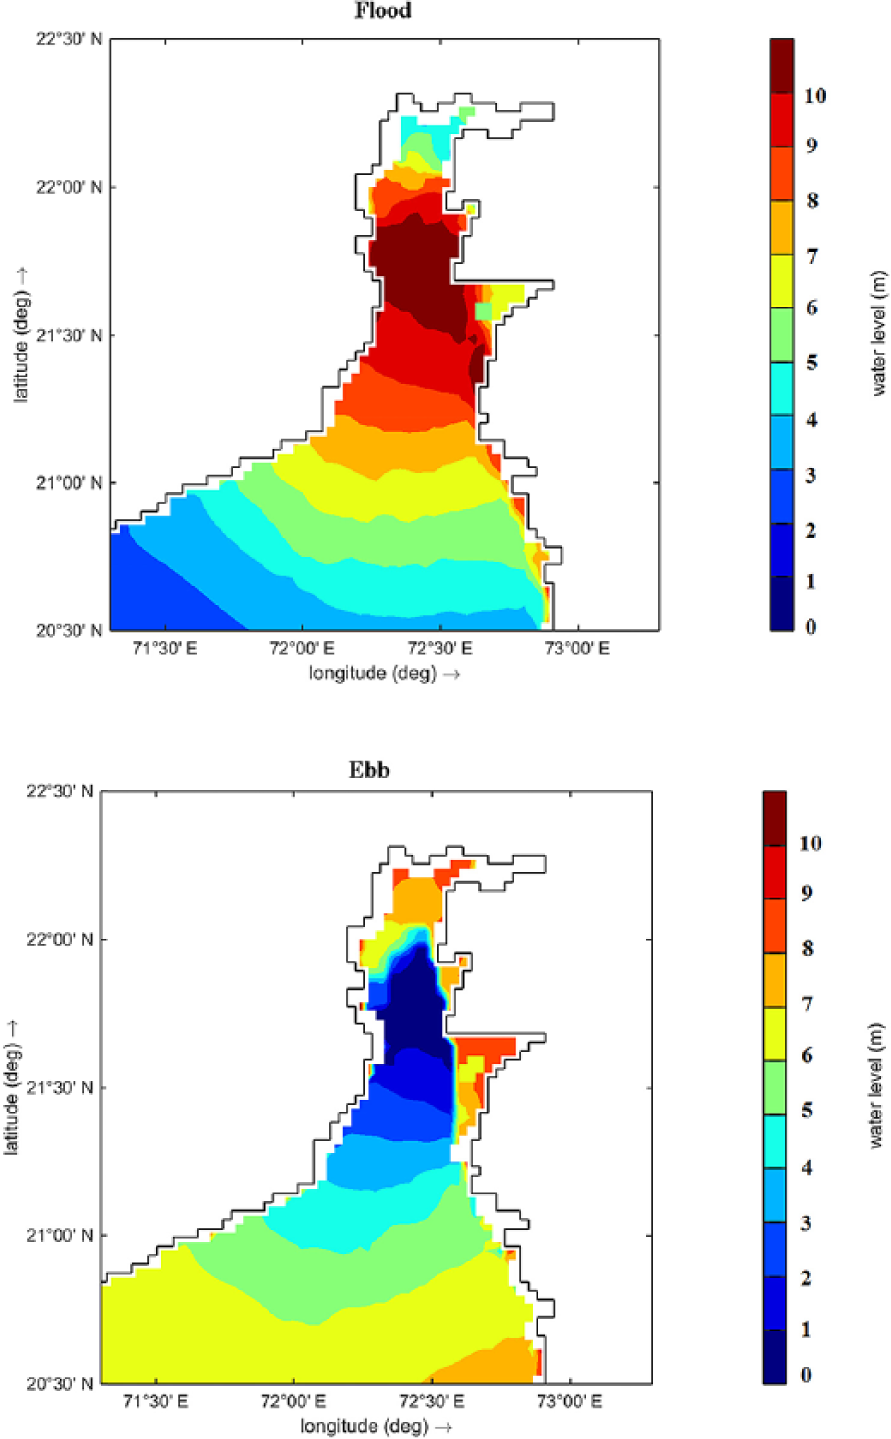
Distribution of tidal level during mid-flood and mid-ebb on spring tidal cycle.
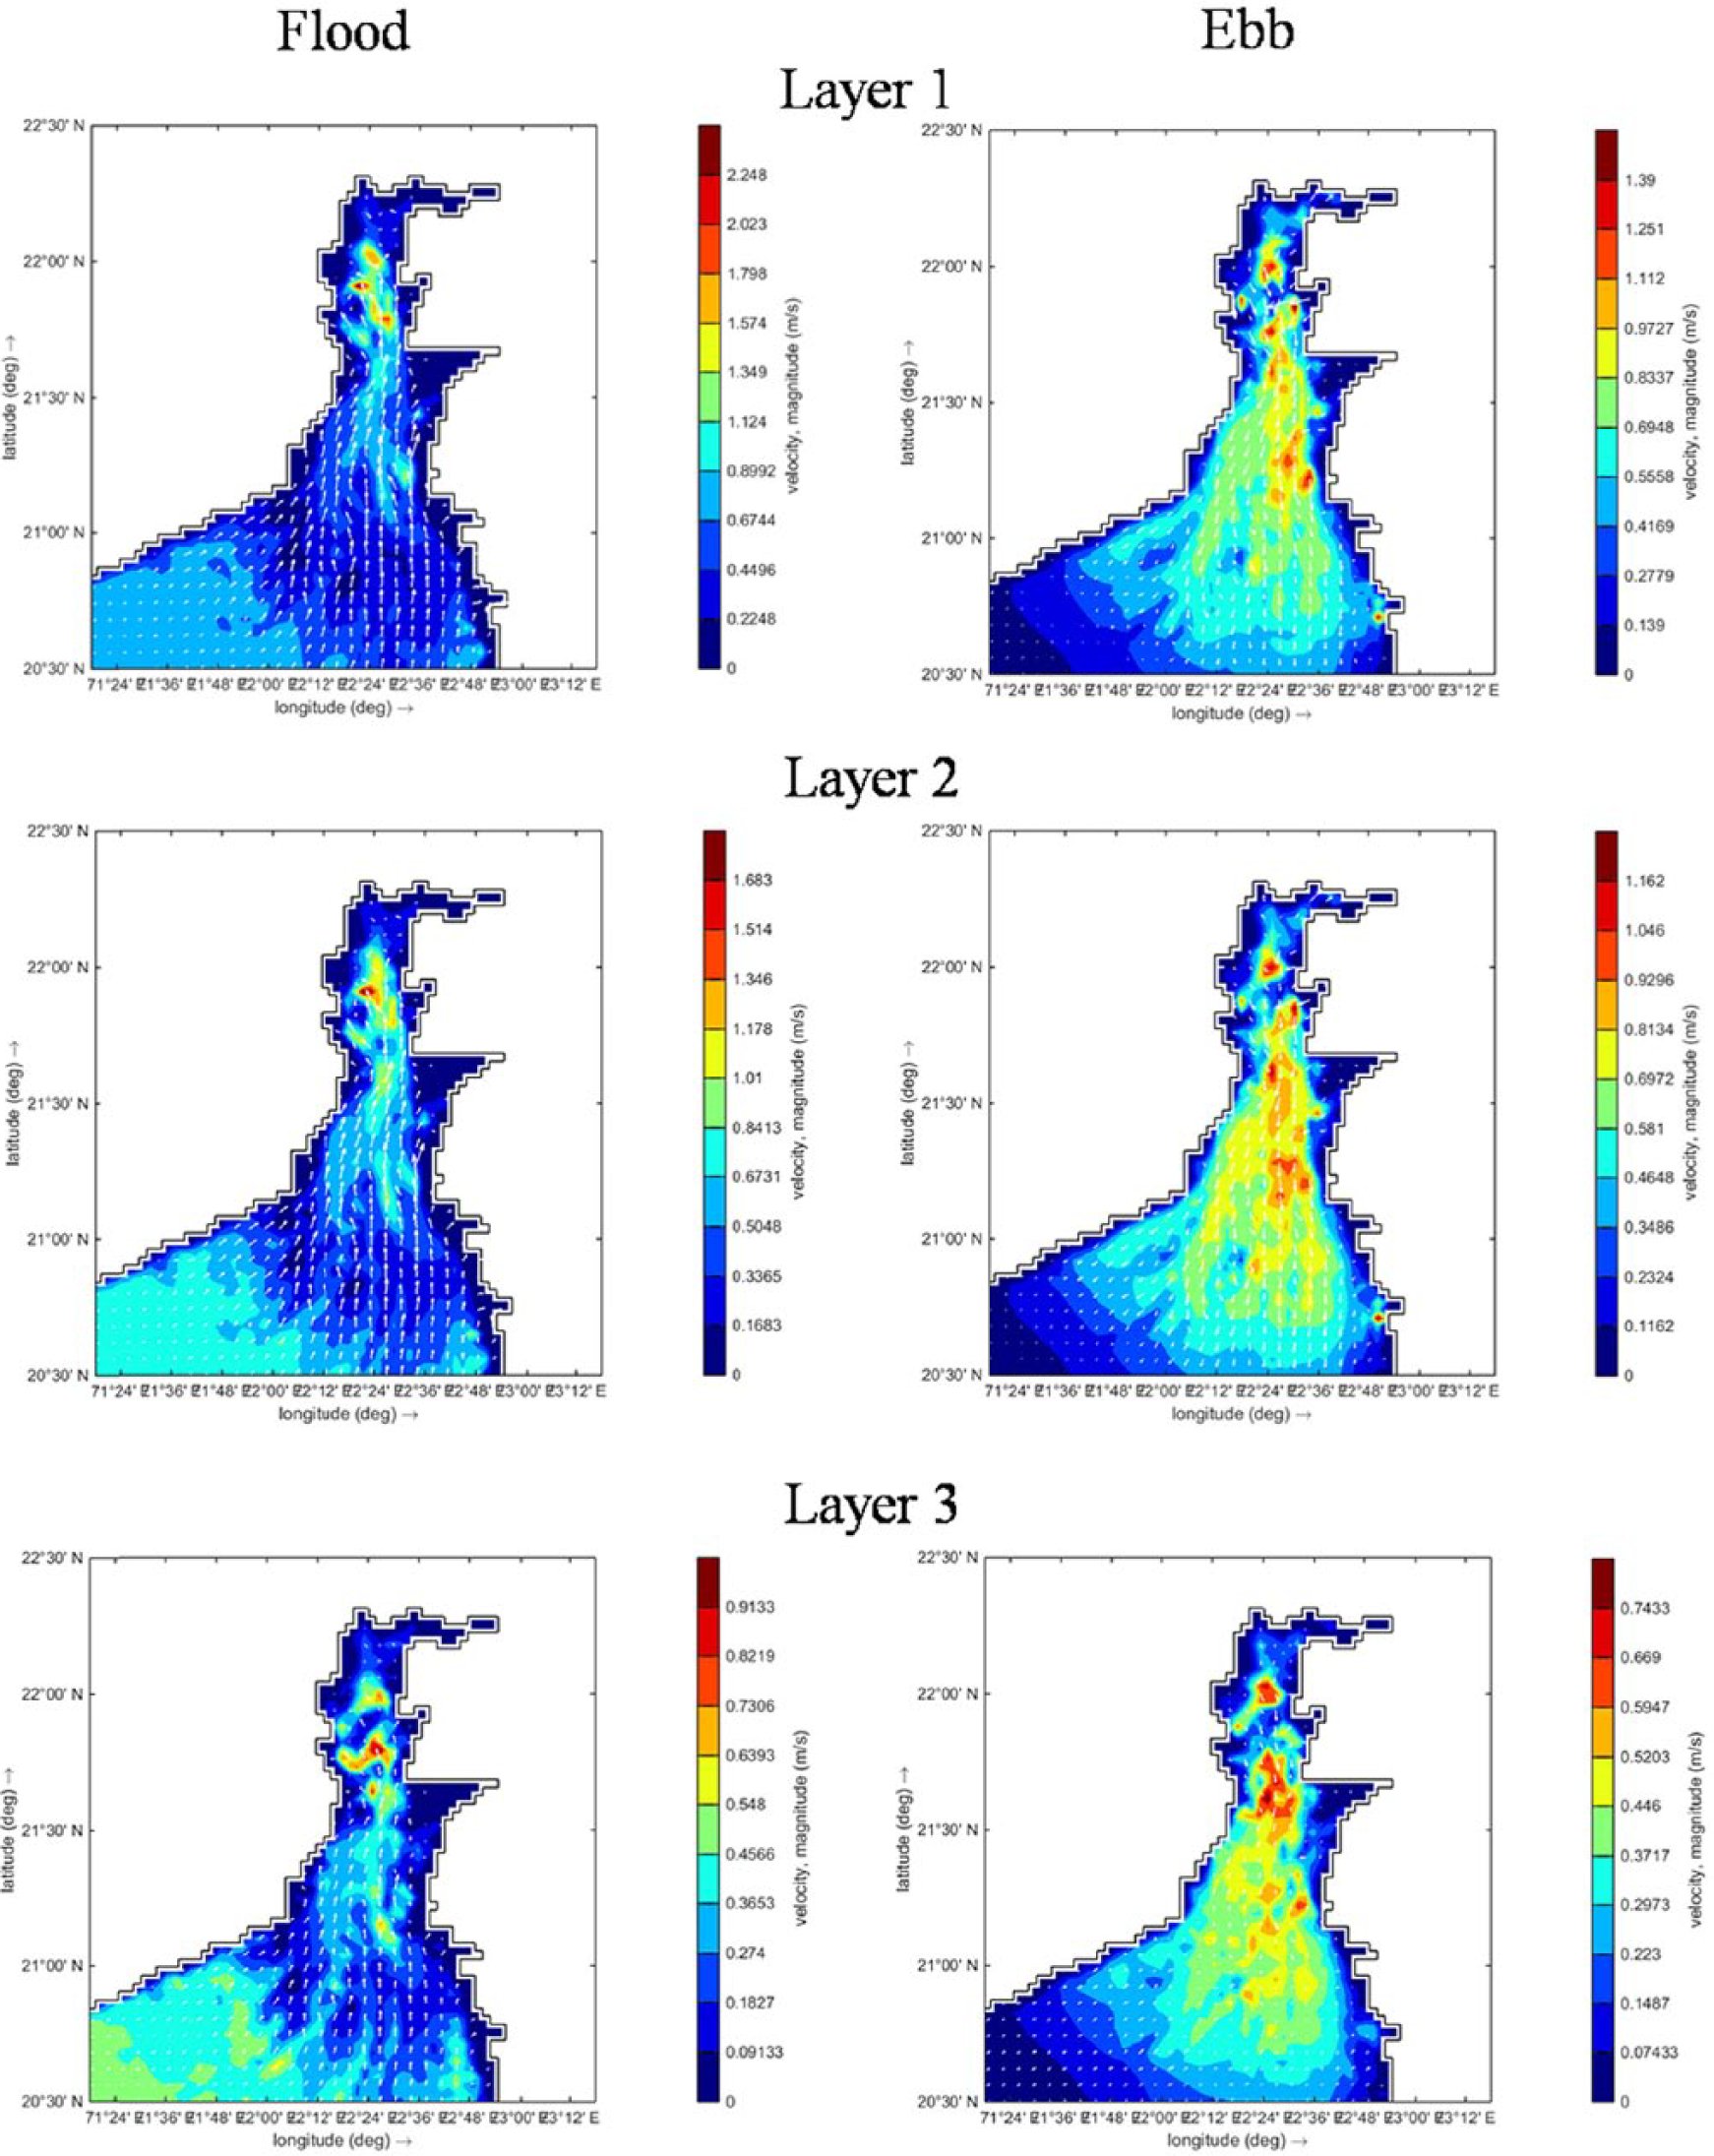
Distribution of current magnitude with vectors during mid-flood and mid-ebb for the different layers on spring tidal cycle.
Assessment of tidal current energy resources
The turbine technologies are most commonly used for the conversion of kinetic energy to electrical energy available in the ocean. Depending on the site and environmental conditions, the following one of the techniques has been selected to extract energy, by constructing tidal turbine/barrage across the estuary of bay or from free surface flow. La Rance is the best example and largest power-producing (240 MW) tidal power plant in the world. Also, tidal turbines are classified into three categories depending on its axis rotations: (1) horizontal axis system, (2) vertical axis system, and (3) variable foil system. Typical view of SeaGen turbine and its types are shown in Figure 7. The estimated rated power of this turbine is about 1 MW, so it can produce three times the power of flow of water (Ben Elghali et al., 2007).
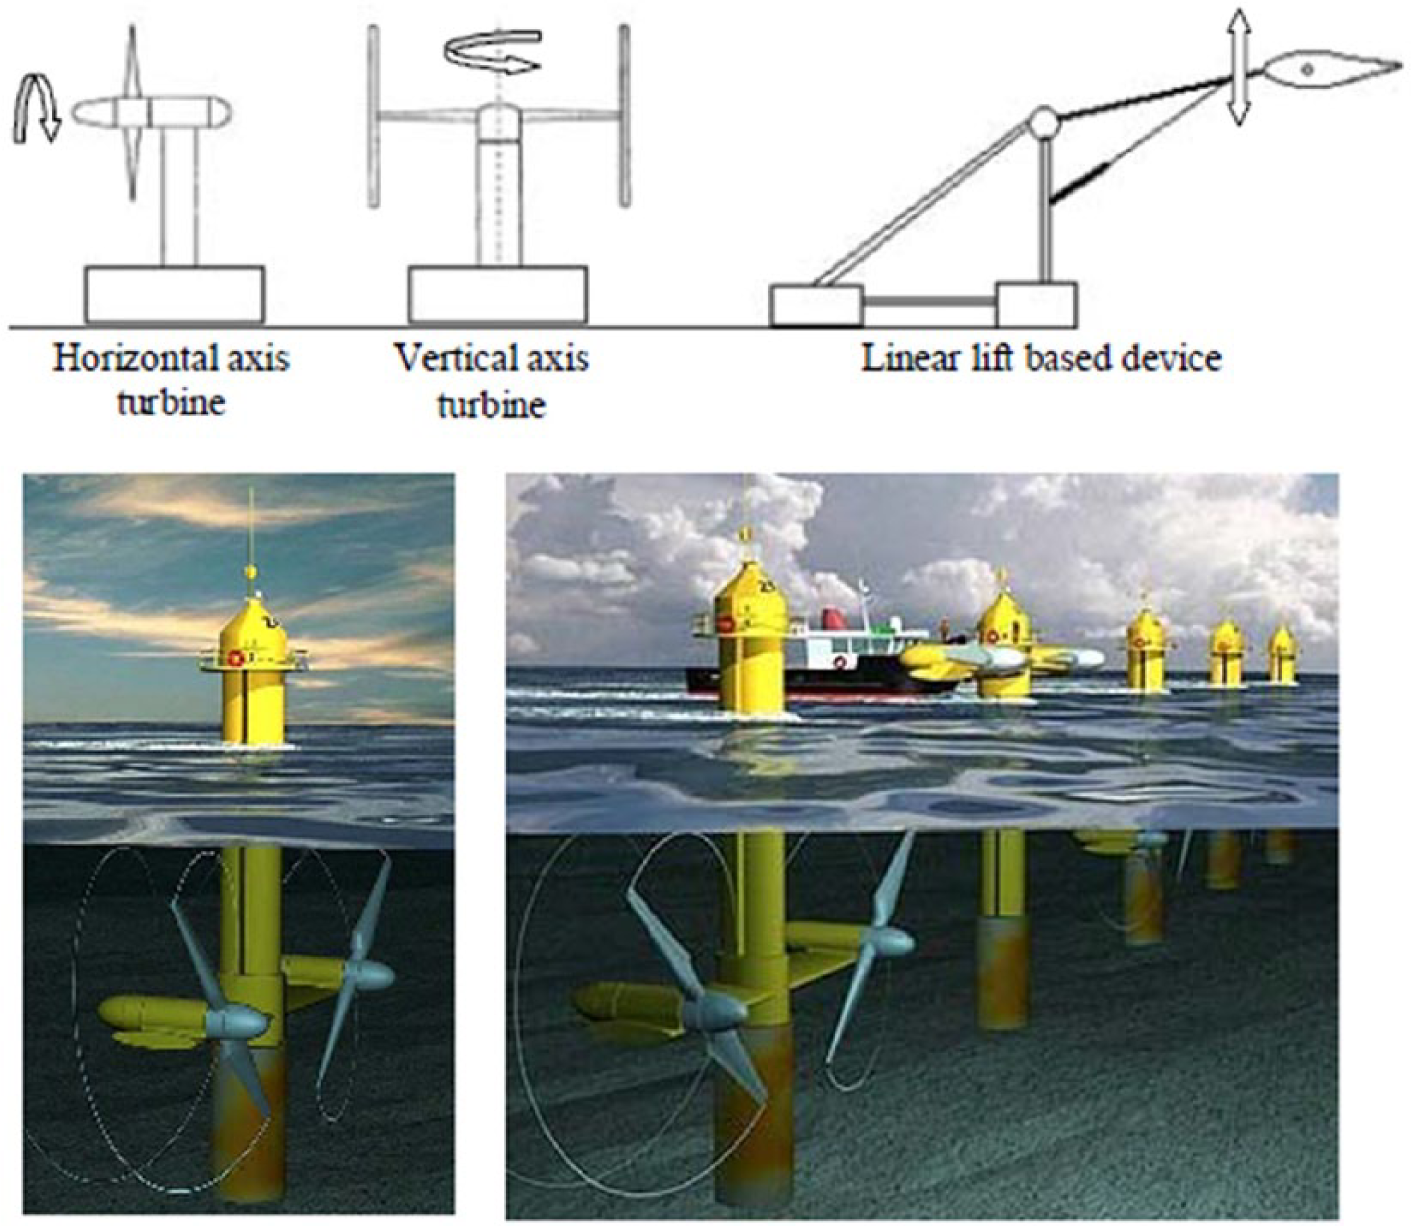
Typical view and tidal turbine and types (Ben Elghali et al., 2007).
On the successful validation of the tidal currents over the different water depth layers, the following equation has been adopted for the estimation of tidal energy resources
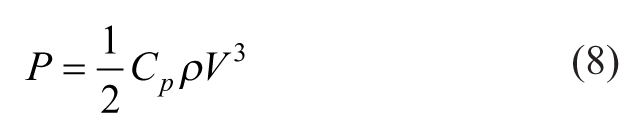
where P is the density of tidal current energy, Cp is the coefficient of turbine efficiency (according to SeaGen, Cp can reach 0.443), V is the flow velocity magnitude, and ρ is the density of seawater.
Gorban et al. (2001) conducted a propeller efficiency study to estimate maximum efficiency of plane propeller, and the results show that it was about 0.30 for free fluids. Alnsworth and Thanke (2006) carried out various studies with MCT SeaGen turbine and found that when Cp value was 0.443, it can produce an electrical power of 1 MW, while the rated velocity of turbine reaches up to 2.8 m/s. In this study, a Cp value of 0.443 has been considered for the estimation of tidal power density. The typical spatial variations of power density have been estimated with respect to tidal currents using equation (8) during mid-flood and mid-ebb of mean spring tidal cycle over the different layers of water depth as shown in Figure 8. It is clearly seen from Figure 8 that the northern part of the gulf has the highest power density of maximum of 2000 and 810 W/m2 on flooding and ebb at the free surface layer, respectively. In order to obtain the temporal variation of power densities, two locations (Points A and B), as marked in Figure 1, are chosen in the northern part of gulf, where the tidal current velocities and corresponding power potential were extracted. It is observed that the mean velocities reach 2.5, 1.9, and 0.7 m/s at the three different layers of Point A and 2.3, 1.7, and 1.2 m/s at three different layers of Point B, respectively, as shown in Figure 9. The corresponding time histories of power densities for points A and B are given in Figure 10. It is clear from Figure 10 that the mean power densities are 1980, 1630, and 104 W/m2, respectively, at the three different layers of Point A and 1840, 1290, and 400 W/m2 at the three different layers of Point B, respectively. The spatial, temporal, and vertical distribution of the tidal stream–based power densities along the Gulf of Khambhat encourages pilot-level power extraction attempts.
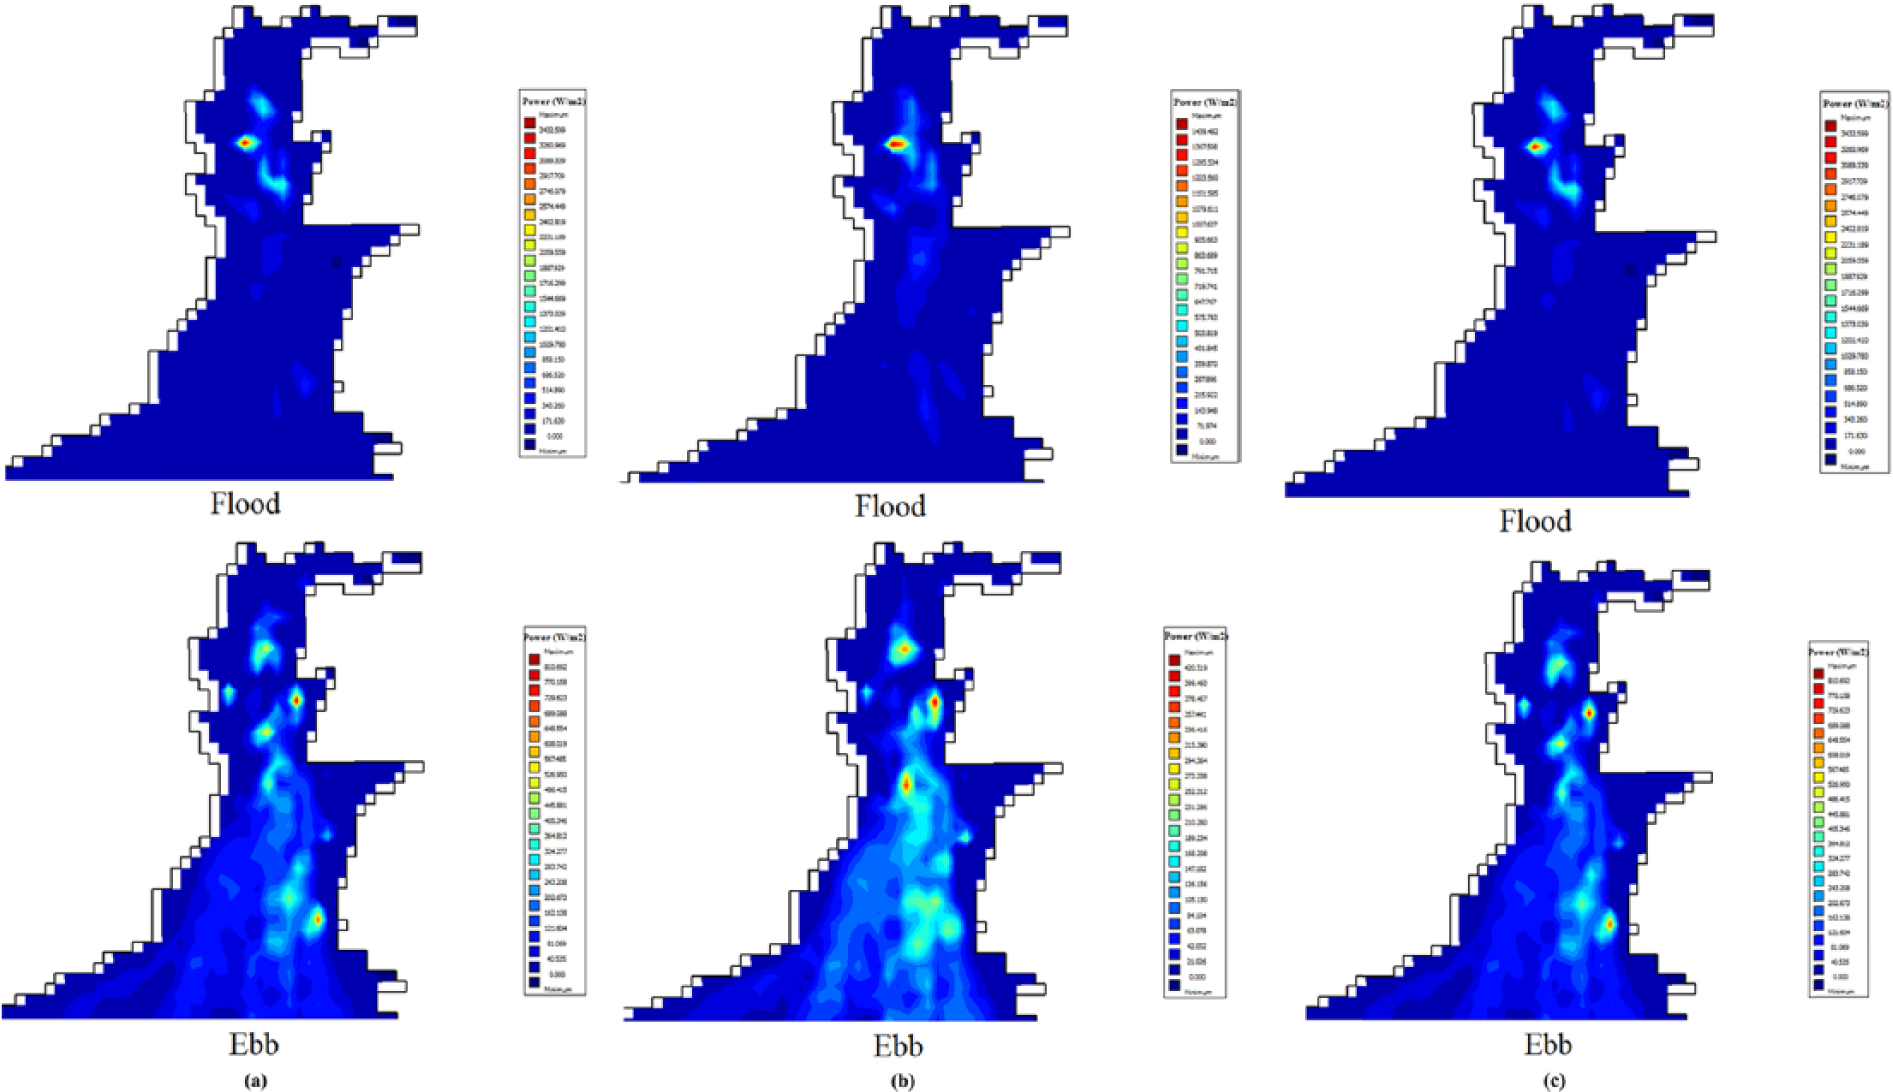
Variations of power density during mid-flood and mid-ebb for the different layers on spring tidal cycle: (a) layer 1, (b) layer 2, and (c) layer 3.
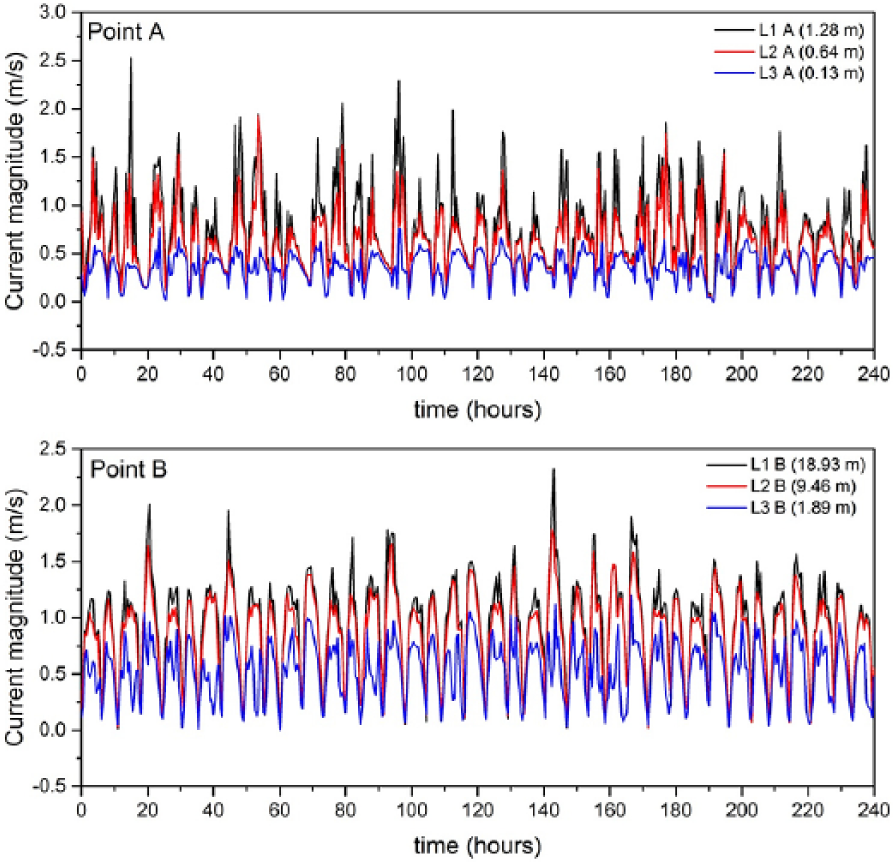
Typical time series of current magnitude at Points A and B.
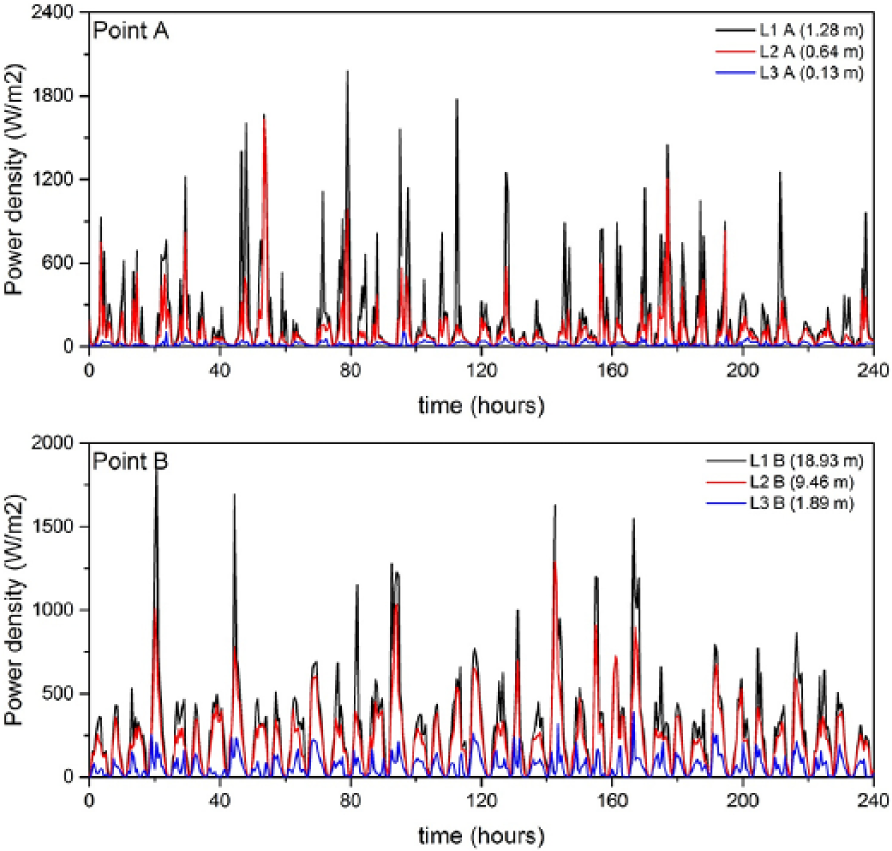
Typical time series of tidal power densities at Points A and B.
Conclusion
A finite-difference 3D hydrodynamic model has been developed to study a flow characteristic along the Gulf of Khambhat. The model was forced with tidal constituents as a boundary condition, and the simulated results were validated with the existing available literature-based collected water levels and current datasets. The maximum estimated values of tidal current velocities are of the 2.6 and 1.5 m/s during spring and neap tidal cycles, respectively. The corresponding maximum available power densities, from the tidal stream through the energy flux approximation technique, are estimated to be about 3 and 0.7 kW/m2 during spring and neap, respectively, in the Gulf of Khambhat. The results of this study are expected to be useful in making any first-hand estimation of power potential from tidal stream in the Gulf. With more actual field measurements, spread across the Gulf, of the tidal currents at various water depths, the accuracy of the estimation can always be improved.
Footnotes
Declaration of conflicting interests
The author(s) declared no potential conflicts of interest with respect to the research, authorship, and/or publication of this article.
Funding
The author(s) received no financial support for the research, authorship, and/or publication of this article.