
Abstract
The Mousuni Island in West Bengal, India is wide-open to Bay of Bengal. This island by virtue of its location is exposed to river flow as well as wave action. It is thus subjected to severe erosion along its south-western coastal stretch and also significantly affecting agriculture due to seawater inundation. This is due to the lower level of bund crest elevation combined with high water levels during coastal flooding. The most suitable method to arrest the shore erosion and salt water intrusion is to divert the flow gradually toward the deeper section of the channel. To meet this requirement, after carrying out a comprehensive profiling of the existing bund, bank connected series of spurs with locally available construction materials and unskilled labor are proposed. In order to design these spurs, the magnitude and direction of sediment movement along the stretch is estimated. The layout of protection measures is proposed based on a detailed analysis of site conditions and the environmental conditions. The tranquility inside the proposed coastal protecting structure is substantiated with a two-dimensional horizontal flow model. Furthermore, the behavior of the shorelines has been studied numerically with the proposed coastal protection measure. The detailed analysis of the results from the numerical model and the protection measure are discussed in this article.
Introduction
The Mousuni Island is such that the water drains into the Bay of Bengal in the South with Murianga River flowing along the West and Cheneyar River along the East. The livelihood of people residing in the Island depends mainly on farming- and fishing-related activities. The beach in Mousuni Island is generally flat with a gentle slope toward the South and South-East. The highest elevation of bund to protect the Island is +8.90 m from the mean sea level (MSL). Due to its nature of the elevation, due to an increase in extreme events, the inhabitants of this Island have been losing their agricultural productivity due to frequent salt water intrusion due to which the land becomes useless for few years. About 90% of farming families are affected by this effect. It is unfortunate to state that the Mousuni Island has lost more than 14% of its land mass since 1969. The study area considered for protecting the coast is about 1200-m long situated along the south-western part of the Island (from 21.63222°N, 88.19635°E to 21.64502°N, 88.19368°E). In this article, the details of the extensive survey pertaining to field measurements, design of structures, shoreline evolution, and the two-dimensional (2D) flow modeling are presented and discussed. The location map of the island is projected in Figure 1.
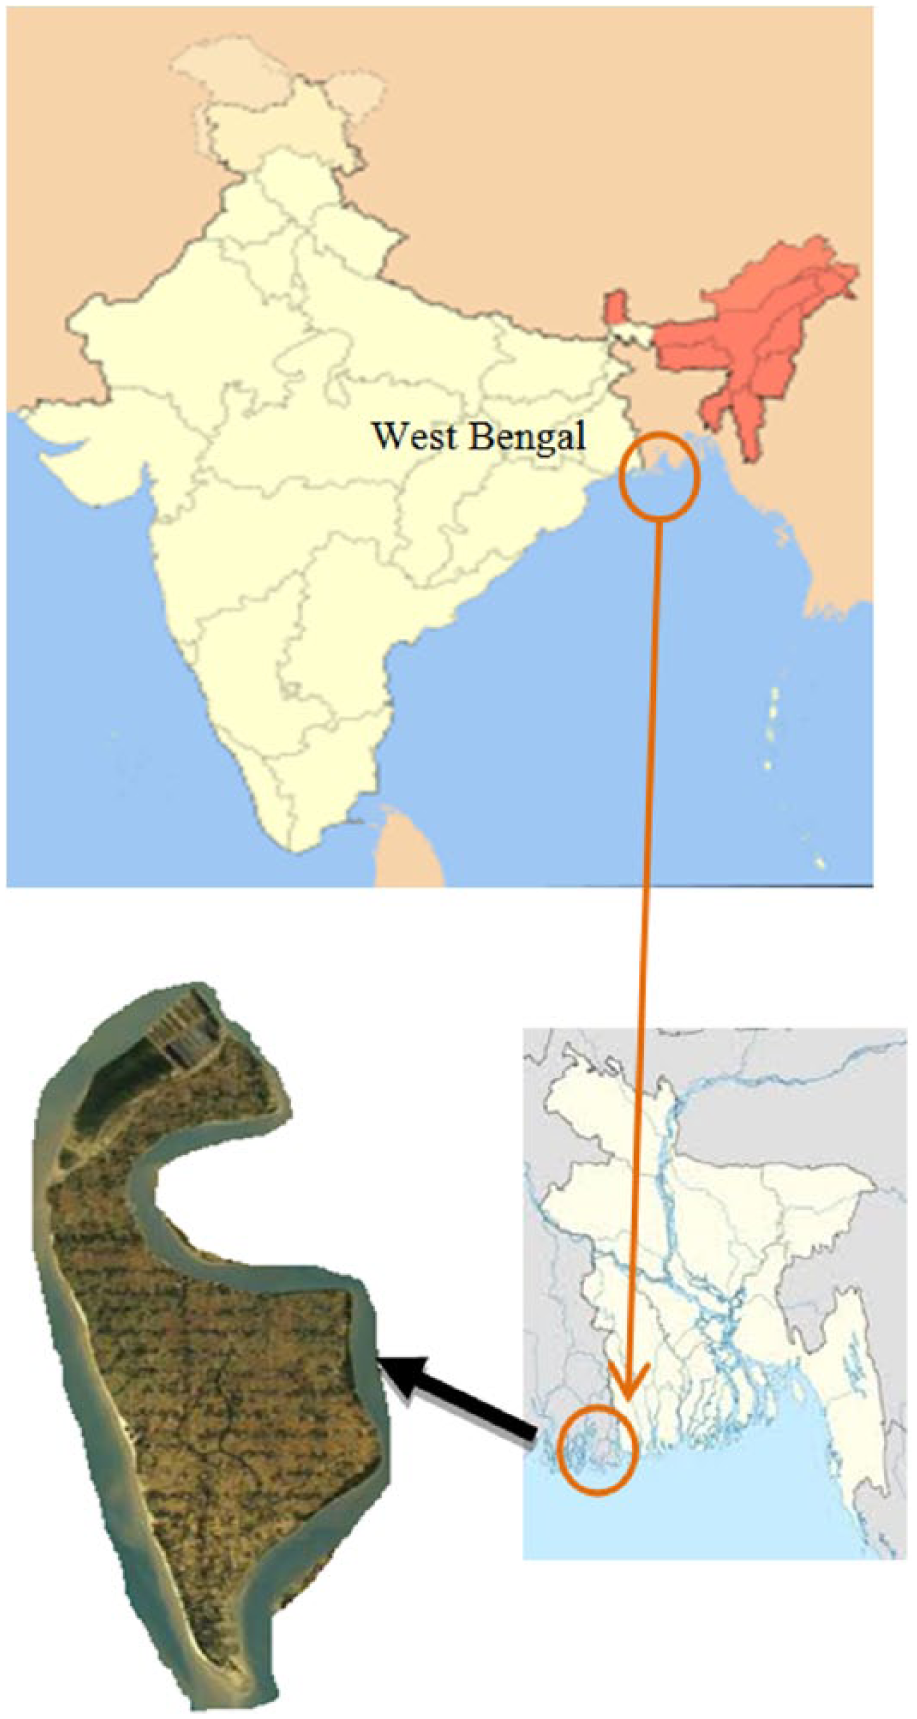
Aerial view of Mousuni Island in West Bengal state.
Field survey
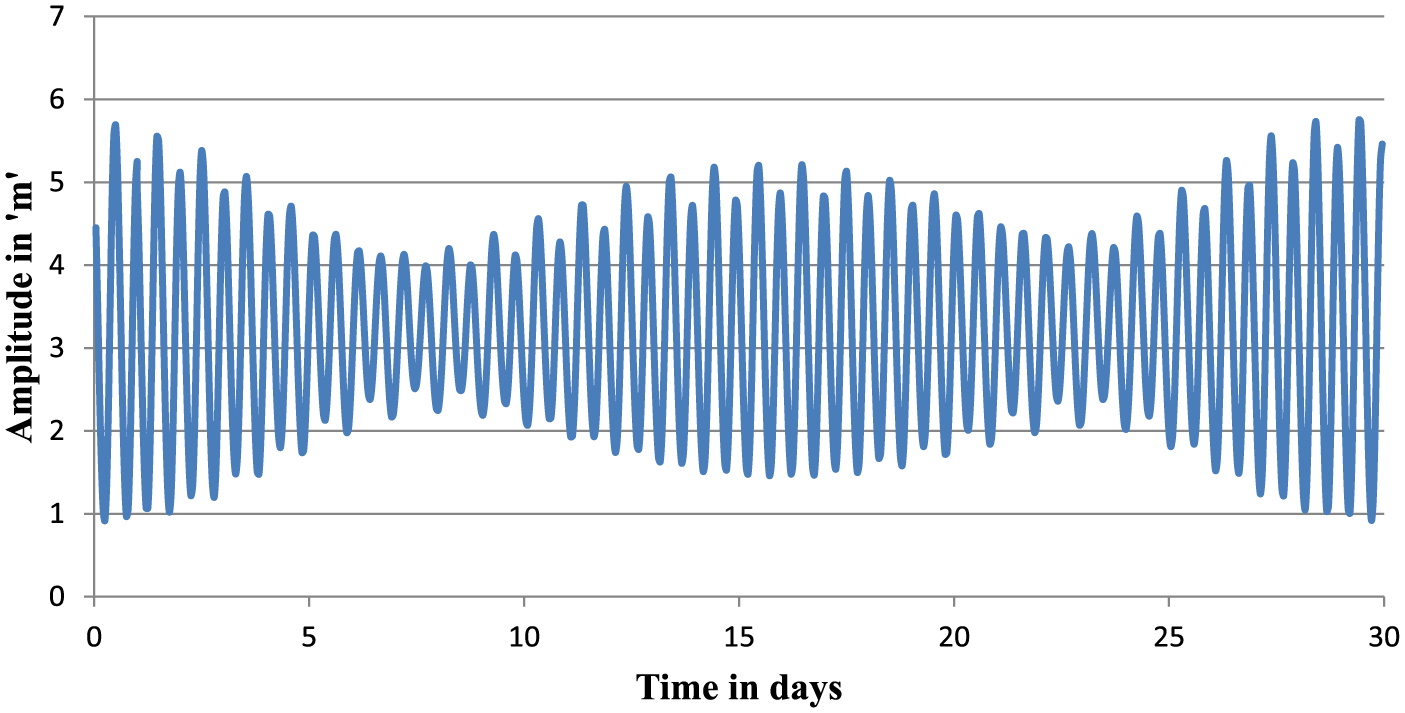
An extensive survey has been carried out in the study area to obtain real field data like river discharge of the channel, cross-sectional details of the channel, cross-section of the embankment, tidal level details, and bathymetry up to 5 m water depth. The field measurements were carried out to measure depth at every 50 m across the river of width 4000 m, current velocity in the channel for 28 days covering spring to neap tides, the velocity profile at 3 and 5 m water depths, availability of materials, beach profile at various places, and flood details (inundation, run-up). It is observed that the tidal flat varies between 170 and 200 m. The demarcation of high-tide line (HTL) and low-tide line (LTL) was done using a handheld global positioning system (GPS). The plan showing the HTL and LTL along the study area is projected in Figure 2.
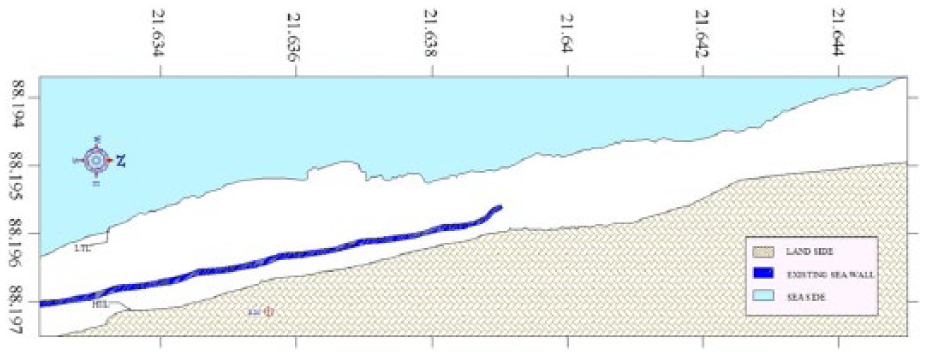
The plan showing the HTL and LTL along the study area.
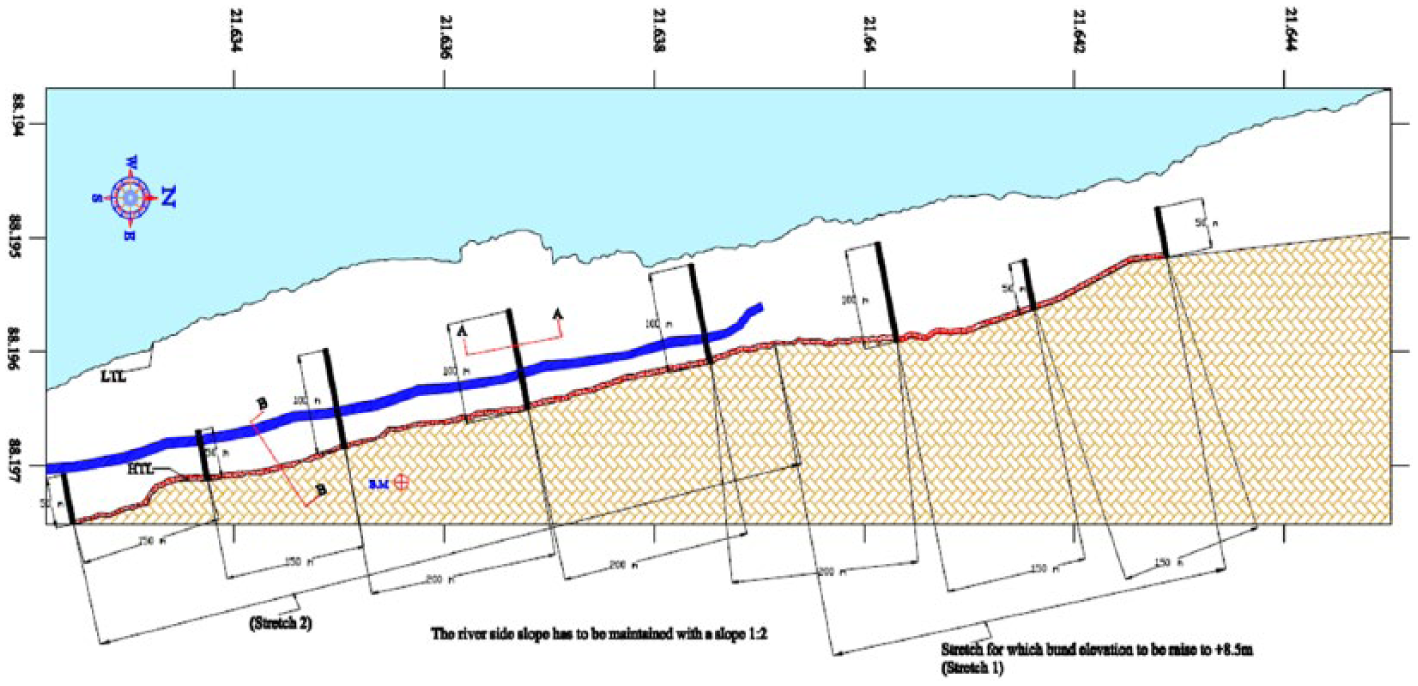
The levels of existing bund and beach at different sections were taken with the help of a dumpy level and a staff. Initially, a bench mark was fixed at the window sill level of an existing building and its location is 21°38′8.79″N, 88°11′48.48″E. Its level was arrived as +5.882 m CD. The location of bench mark is projected in Figure 3. The existing beach profiles including the bund levels at 10 different sections and its location are superposed over the plan showing HTL and LTL and are projected in Figure 4. The bunds on the southern part for a length of about 800 m are experiencing erosion due to wave action. In order to protect the bund, the local people initiated the protection measure of piling wooden logs, locally called as “ballas” side by side and filling in between with sand bags as can be seen in Figure 5. This in fact is an inefficient solution and on the contrary causes scour and thus accelerating the failure. The construction of a rigid seawall of slope 1 in 8 at a distance of 20 m from existing bund also had failed. Unfortunately, the construction could not be completed and due to lack of maintenance of these structures, it had rapidly depleted which is projected in Figure 6. It should be borne in mind that flexible structures could have served better than the rigid ones as coastal protection, and furthermore, the latter type is very expensive and also difficult to rehabilitate in the event of its failure. On the other hand, a length of about 100 m stretch immediately to the north of the previous mentioned stretch was affected by severe erosion and resulted in the construction of a new bund by providing a 30 m width of land to sea, as projected in Figure 7. However, the top level of the newly formed bund is kept around a meter less than the existing ones as shown in Figure 8. The field survey data were used in the design of protection structures and tidal modeling.
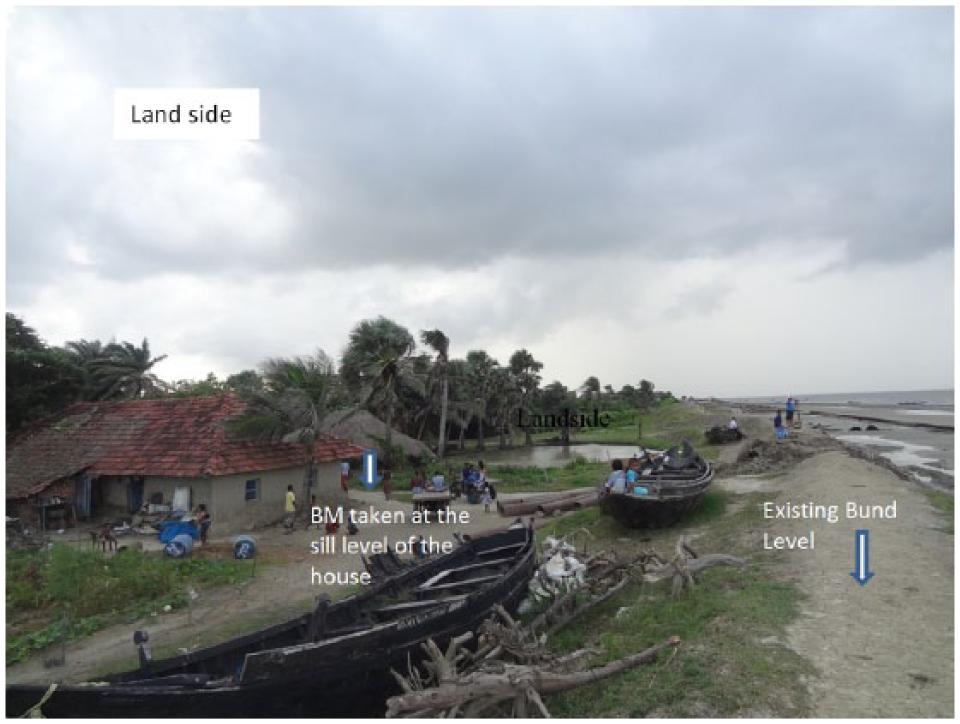
Location of bench mark.
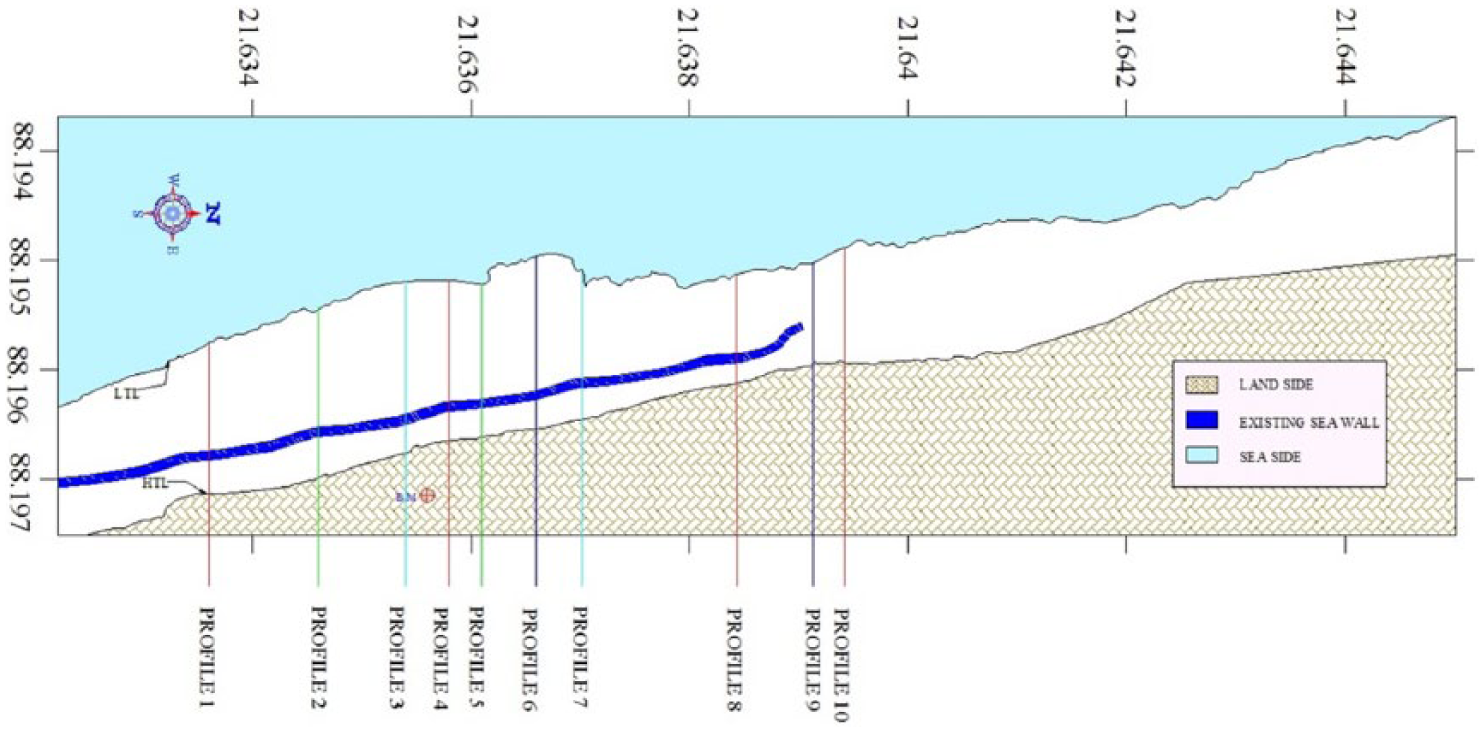
Location of profiles superposed over the plan showing HTL and LTL.
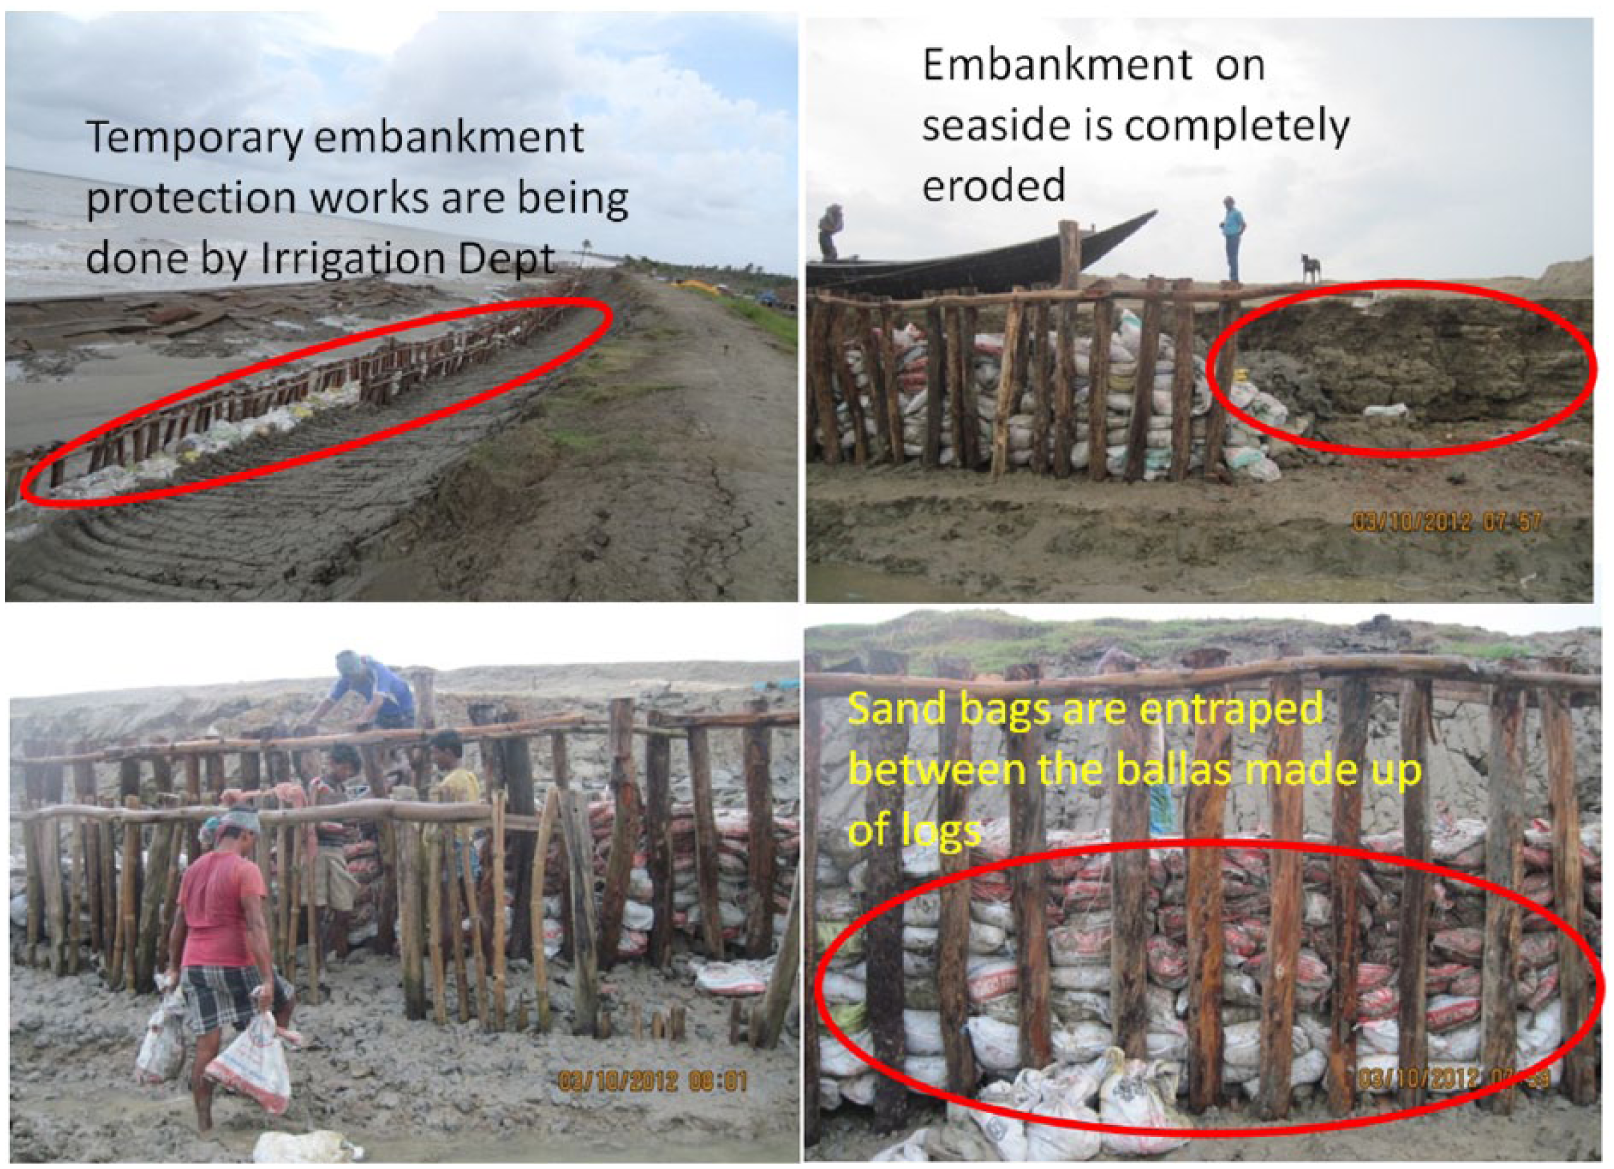
Bund protection measure by local PWD.
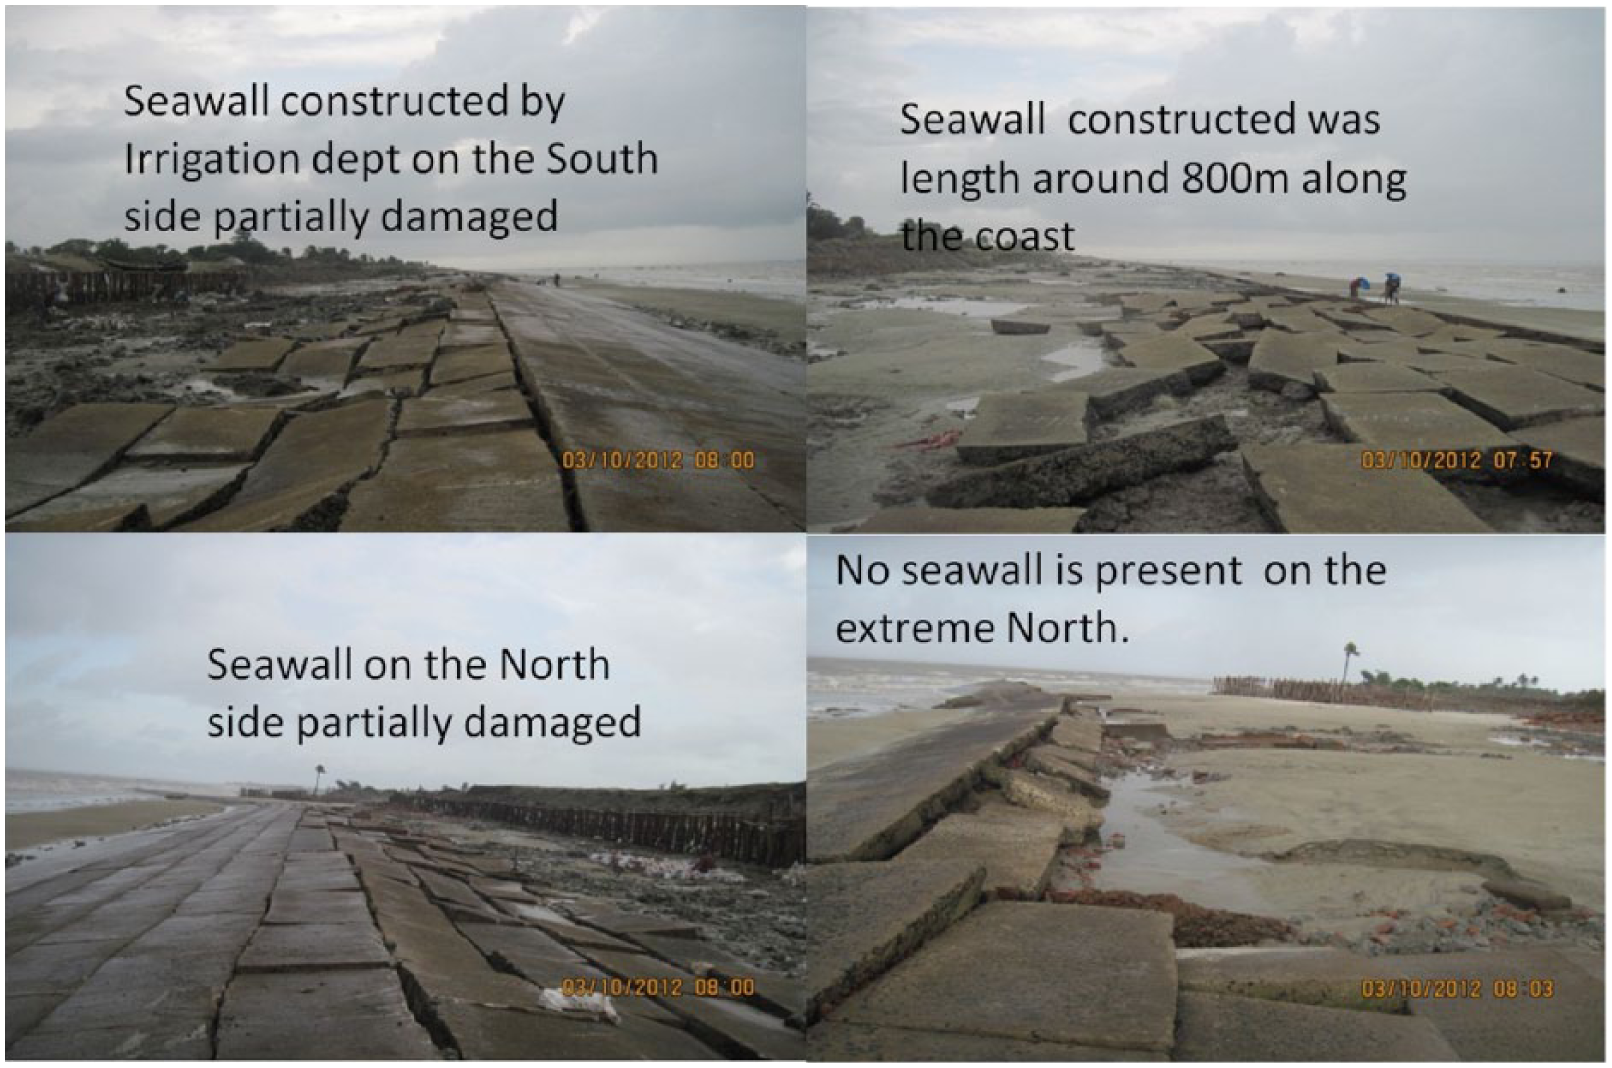
Damaged seawall on the seaside of the bund.
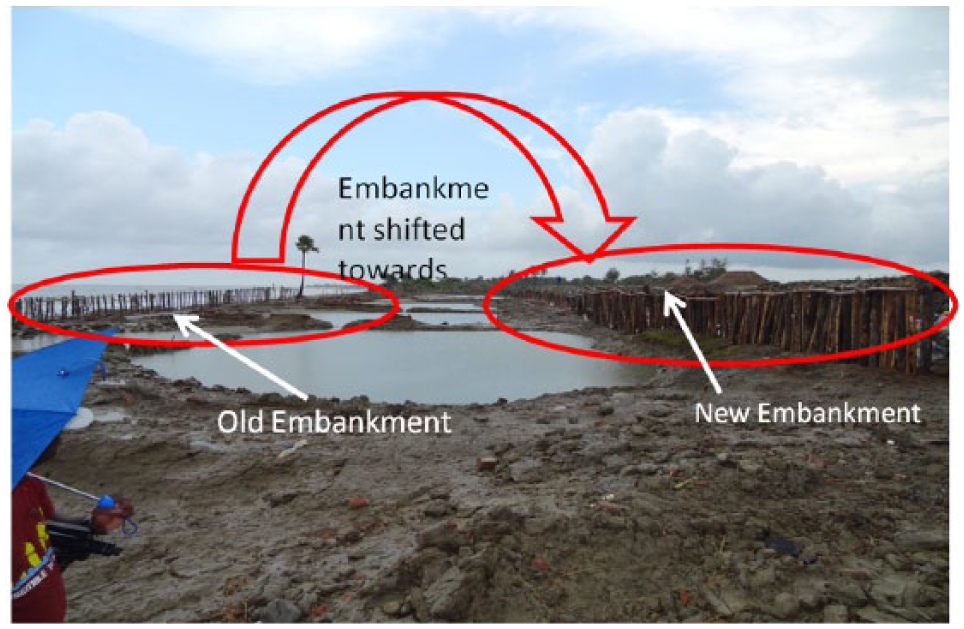
Erosion of bund and the construction of the new one at 30 m inland.
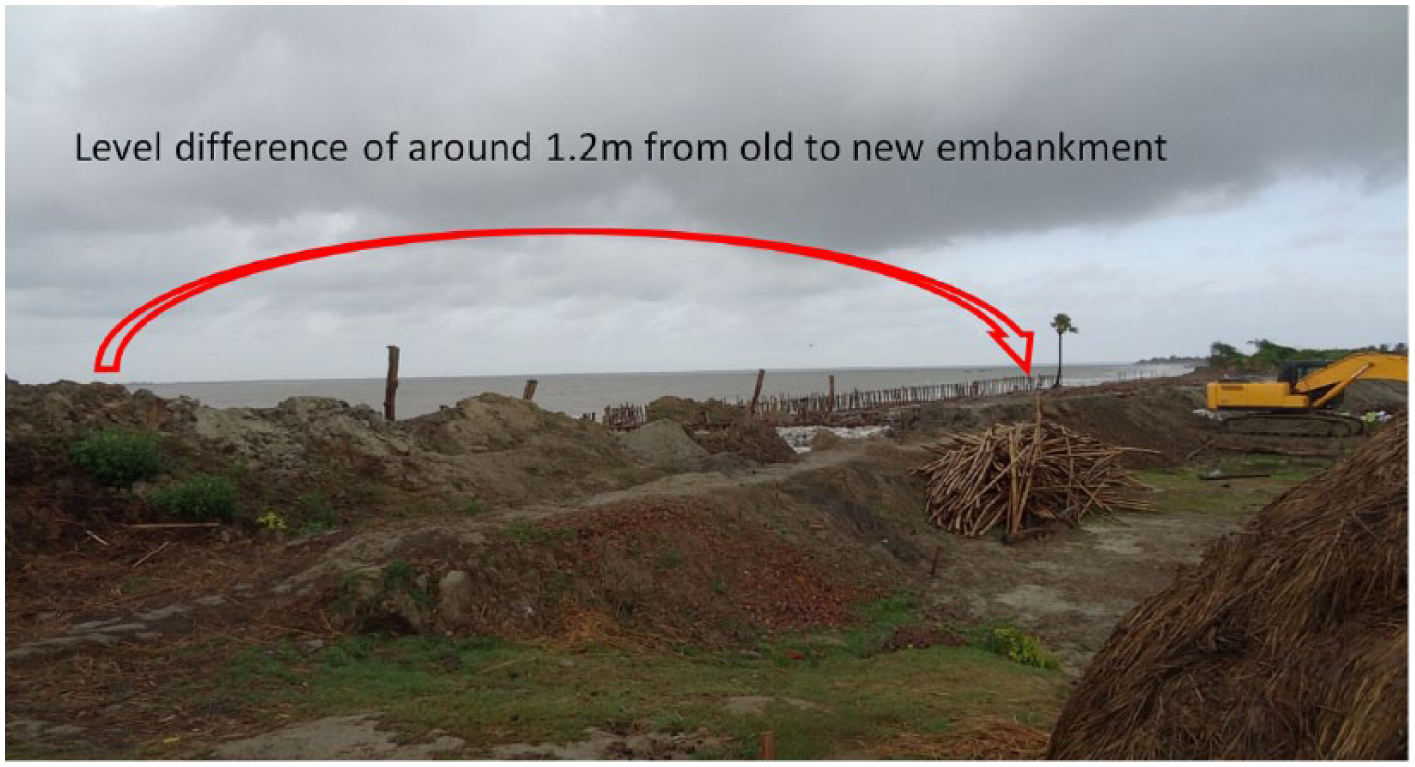
The variations in the top levels of the existing and the new bunds.
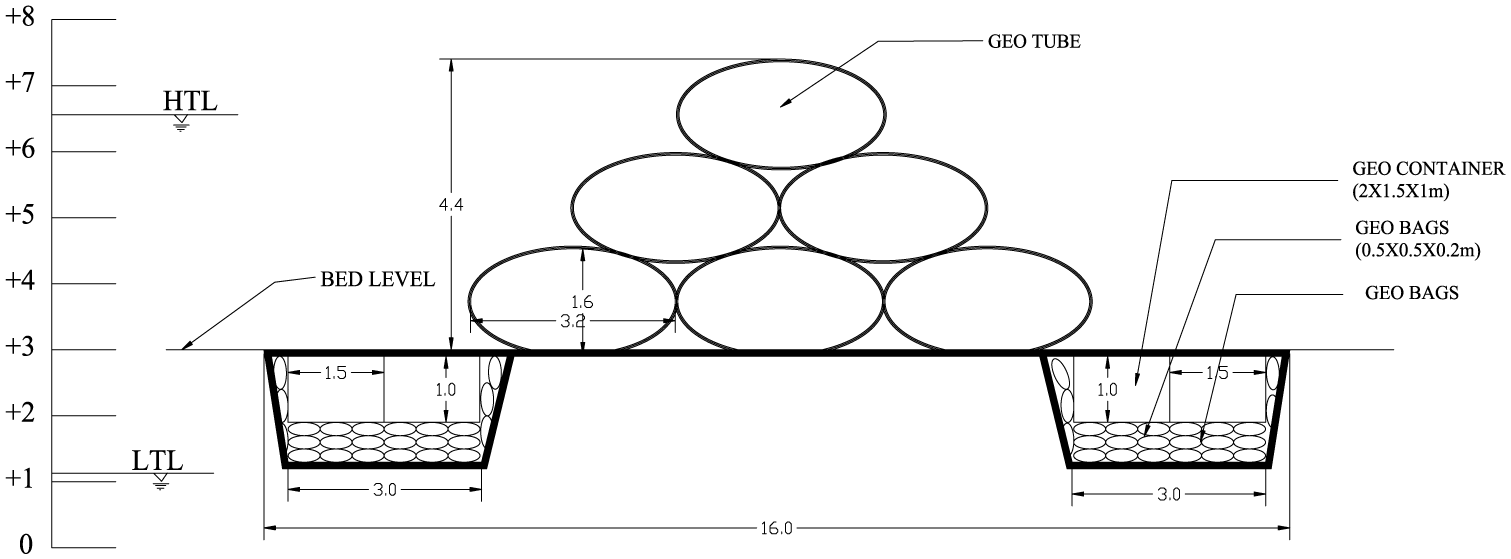
Proposed coastal protection structures
The basic function of arresting this erosion is to divert the river flow gradually toward the deeper section of the channel which will reduce the velocity of the flow closer to the banks. This would ensure building up of the banks that experience erosion (Sundar, 2005). This certainly is possible by carefully designing and constructing a series of spurs along the bank. In the present study area, as already stated, the top level of the bund permits significant overtopping which leads to damage of the bund, which need to be restricted in order that the proposed spurs will be effective to act as bank-building barriers. Hence, the top level of the bank should be raised from its present level. The solution to the affected area as stated above will be spurs jetting from the bund into the estuary. The details of the spurs provided along the bank of the affected stretch are shown in Figure 9. The detailed survey exposed that over the stretch 1, the top level of the bund is at a lower level facilitating flooding during the spring tides. Hence, the top level of the bund for this stretch has to be raised to +8.5 m throughout its length. Furthermore, along the remaining stretch, although the top level is observed to be close to +8.5 m, its estuary side slope has steepened that needs to be rectified and a slope of 1:2 has to be maintained. The present practice of constructing the ballas should be avoided. Instead, as a short-term measure, they can be tried as spurs after treating the stretch as 1 and 2 as mentioned above.
A plan shown up the Geo-tube as toe protection along the shore and location of spurs in field.
The protection is thus ensured in two ways, the protection to existing bund with rehabilitation of bund with a seaward slope of 1:2, a top level of 8.5 m and series of spurs as detailed in earlier figure. A typical view of toe protection for existing bund using geotextile tube is shown in Figure 10. The different forms of spurs that could be considered are rubble-mound spurs, spurs formed with the traditional locally employed ballas, and spurs formed using geotextile tubes with strong toe protection.
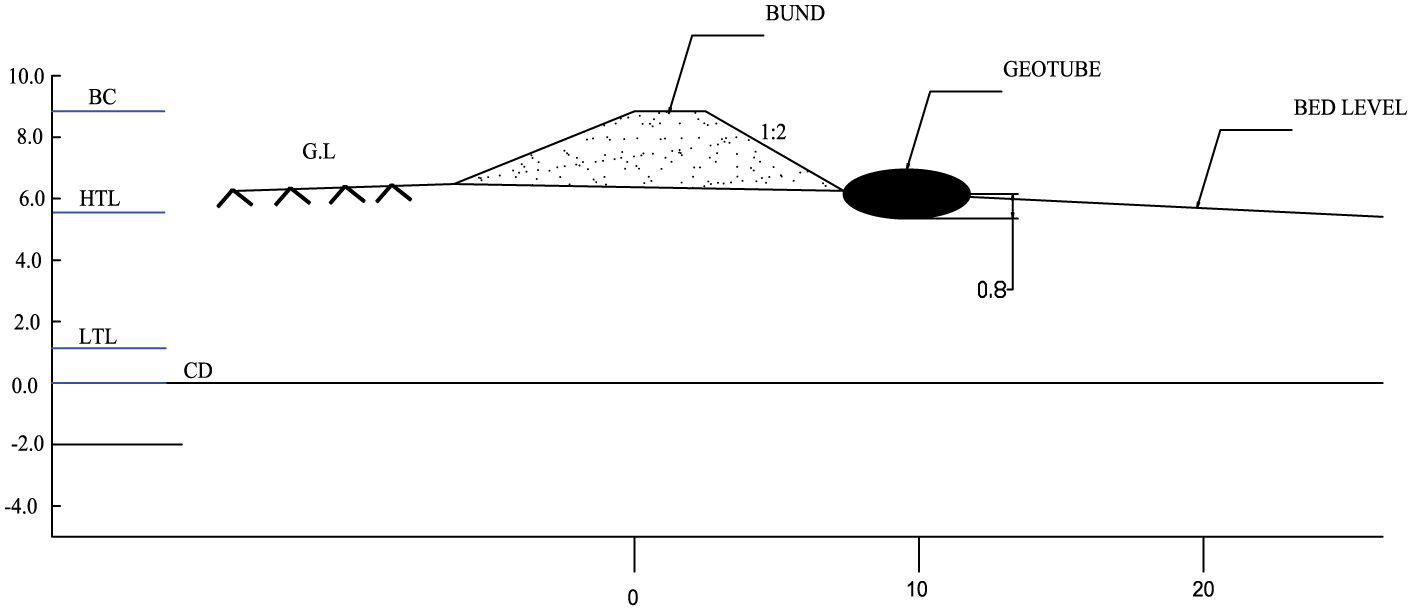
A typical view of toe protection for existing bund using Geo-tube at section B–B (of Figure 9).
A layout of protection structure is drawn and proposed based on the analysis and through numerical modeling. The tidal current velocity is obtained through executing a two-dimensional horizontal flow (2DHF) model for the proposed protecting structure and the velocity along u, v direction is taken. From the observation of tidal model, it was noticed that calmness inside the structure would prevail with a maximum value of 1.7 m/s. The prediction of change in shoreline variation due to proposed structures was obtained through a shoreline evolution model. The predicted variations in shoreline profile after construction of structures exhibited beach nourishment along the banks. The detailed design and numerical analysis of the proposed layout of protection structure are discussed in the following section of this article.
Different options for the design of the spurs
The main objective of the spurs is to protect the Mousuni Island from severe erosion. However, the construction of spurs would pose many practical difficulties. The availability of construction materials and the working ambient pose challenging tasks. Hence, three design options are considered to make the implementation feasible.
Option I
The design of rubble-mound spur is carried out for the stability of armor units with the consideration on overtopping and run-up. The design of rubble-mound spur has been carried out in such a way that the crest elevation is at +7.5 m CD. The section is designed to be safe for the sections placed at +3 m CD in front of the bund. The following section presents the design of a typical rubble-mound spur at +3 m CD.
Design water level
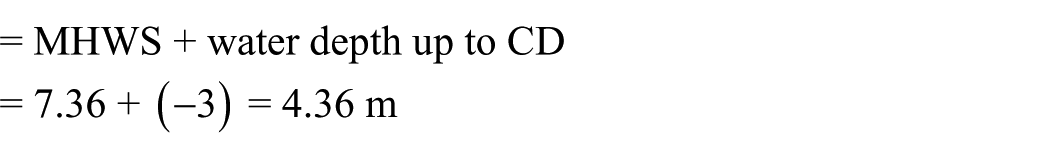
Following design data have been adopted for the design of rubble-mound spur section. The mean high water spring, MHWS
The design water level for the breakwaters is thus set as
Design of rubble-mound spur
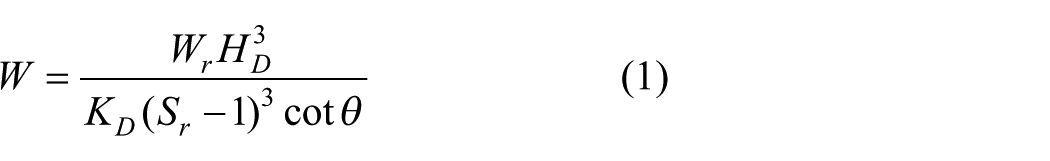
A typical design of rubble-mound spur cross-section is given here. A rubble-mound section has an armor layer. The weight of the armor stones (W) for the rubble-mound spur section is calculated using the Hudson formula (US Army Corps of Engineers, 2002)
where
In the water depth of 4.36 m, the maximum possible significant wave height that can be incident on the rubble-mound spur section is 2.2 m. This is based on breaking limit of the waves. However, by considering the rise in water level of about 0.5 m due to storm surge, tsunamis, and long-period swell that could approach the coast, the design wave height is taken as 2.4 m. From Hudson’s formula, the weight of rubble stones is worked out to be 2.2 T in two layers for the design wave height. Accordingly, two layers of rubble stones in the range of 1.5–3 T are adopted. All other details were established as per US Army Corps of Engineers (2002).
The cross-section of the rubble-mound spur section is shown in Figure 11. A submerged toe has been designed by keeping in view that this section is placed in intertidal region. A geosynthetic fabric layer would act as a filter in view of very fine silt bed materials.
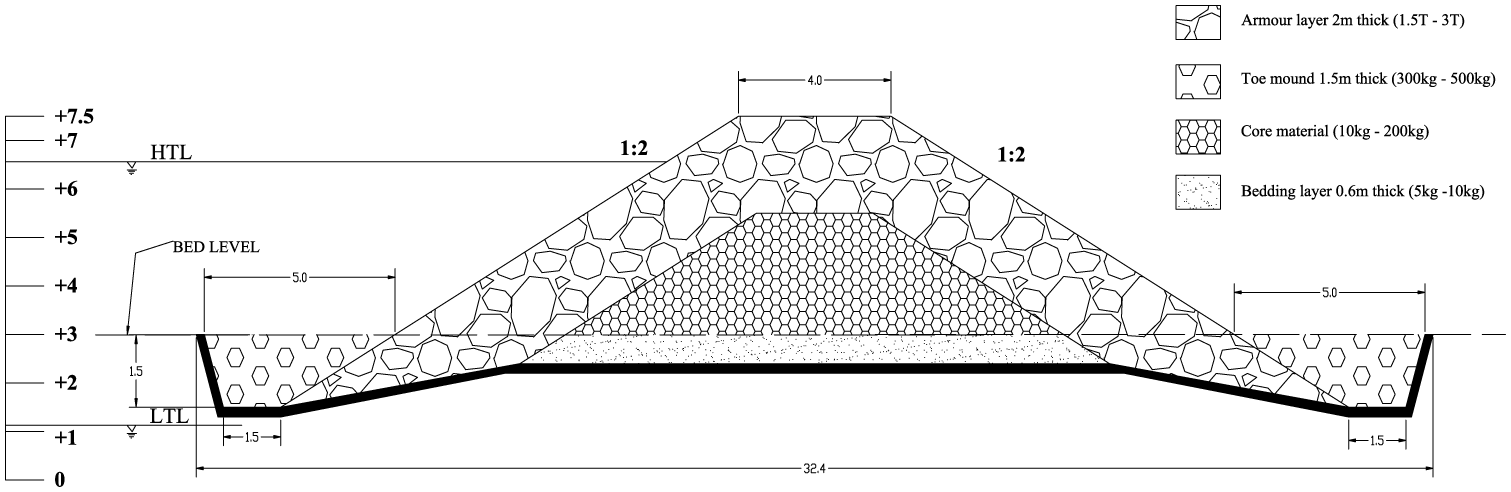
Cross-section of rubble-mound spurs at section A–A (of Figure 9) (Option I).
Option II
In Option II, it was decided to adopt the locally available materials and the cross-section of which is projected in Figure 12. The ballas (wooden poles) is being adopted for bank protection at present, which becomes frequently ineffective due to its shore parallel nature. Here, a similar section with geotextile bags filled with local soil would form the spur sections. On both sides, a 3-m-wide submerged toe is designed.
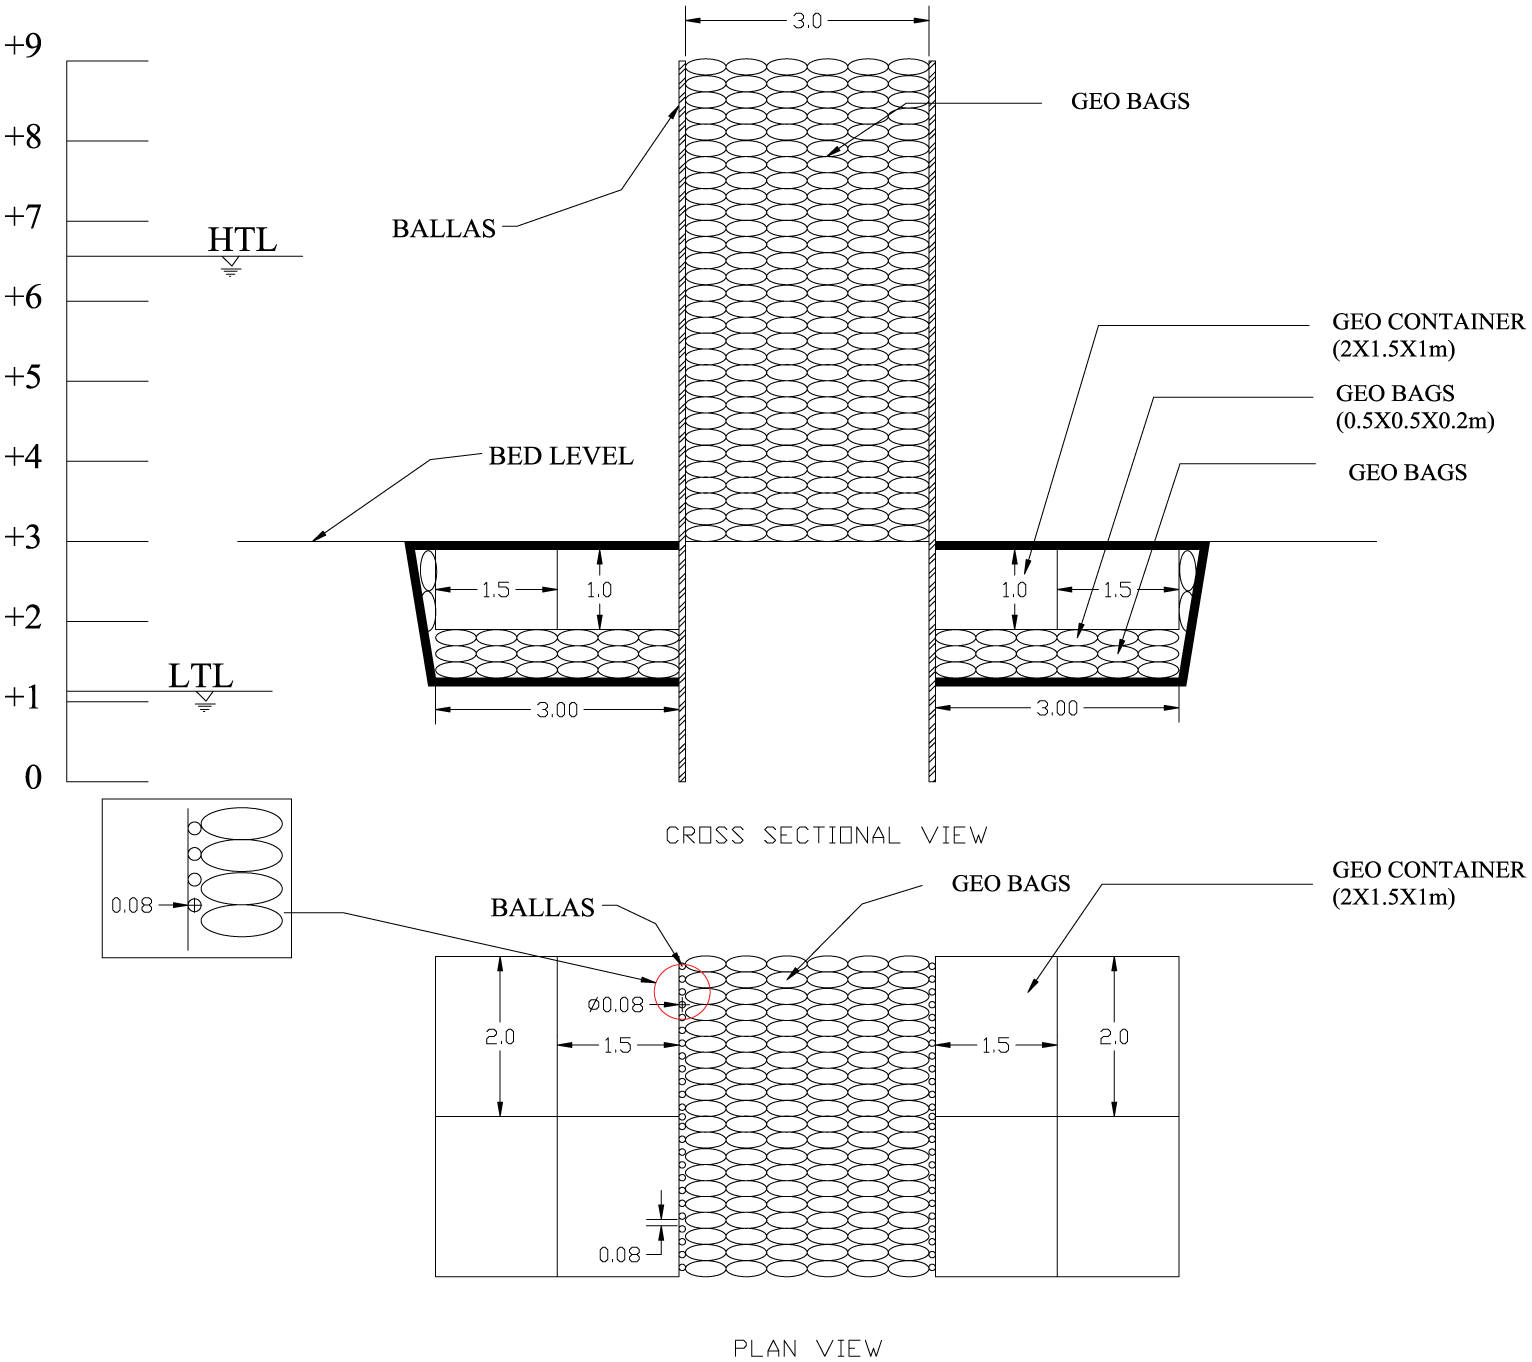
Cross-section of spur using ballas at section A–A (of Figure 9) (Option II).
Option III
The purpose of geotextile tube is to hold back the ocean along eroded sections of the shorefront. So, shore protection alternatives, such as breakwater, seawalls, groins, and artificial reefs, adopt geotextile materials instead of hard structures made of concrete or rubble material. The stability formulae available are generally simple and derived on a similar basis as the Hudson formula for non-deformable armor units, that is, they do not take into account the effect of deformation of the geotextile sand containers (GSCs) and other important processes such as the friction between containers and the effect of the wave period (Darshana and Oumeraci, 2012; Recio and Oumeraci, 2009).
Mobilizing and resisting forces on sand containers
The wave-induced flow on and around a GSC with horizontal velocity u and associated acceleration induces four types of forces:
1. Drag force

where
2. Inertia force
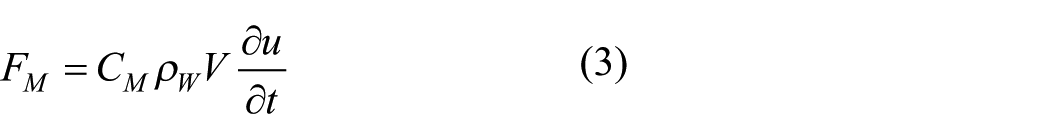
where CM is the inertia coefficient and V is the volume of the container.
3. Lift force

where CL is the lift coefficient and AT is the plan form area of the container.
4. Buoyancy force

where g is the acceleration due to gravity. The resisting forces are essentially caused by the weight of the GSC under buoyancy.
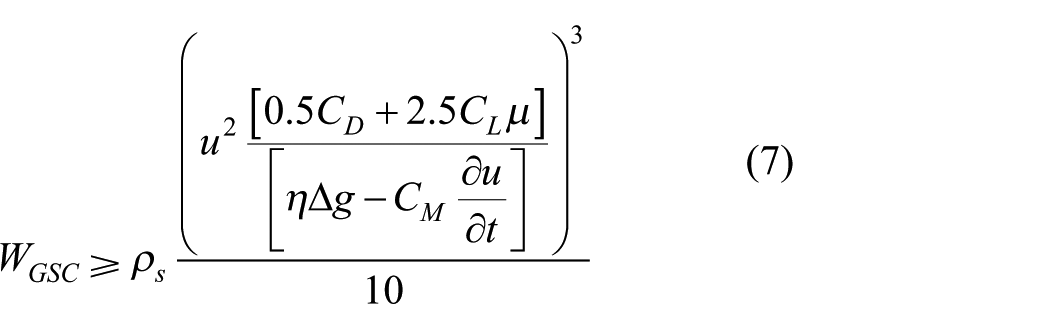
Weight of GSC

where ρS is the density of the sand fill material. For designing geotextile tube, stability against sliding and overturning are considered.
Stability against sliding
Sliding occurs when the wave-induced forces push one of the containers on the seaward or landward slope out from the structure. It simply slides either landwards or seawards. The geotextile tube will be stable when the resisting force is equal to or larger than the mobilizing forces. Sliding stability formula is given below
Stability against overturning
Overturning occurs when the mobilizing moments around the rotation pint are larger than the resisting moments. The rotation point is defined at the edge of the contact area of the GSC with its neighboring container underneath. For the GSC to resist overturning, the resisting moment should be equal to or larger than the mobilizing moment.
Overturning stability formula is given below
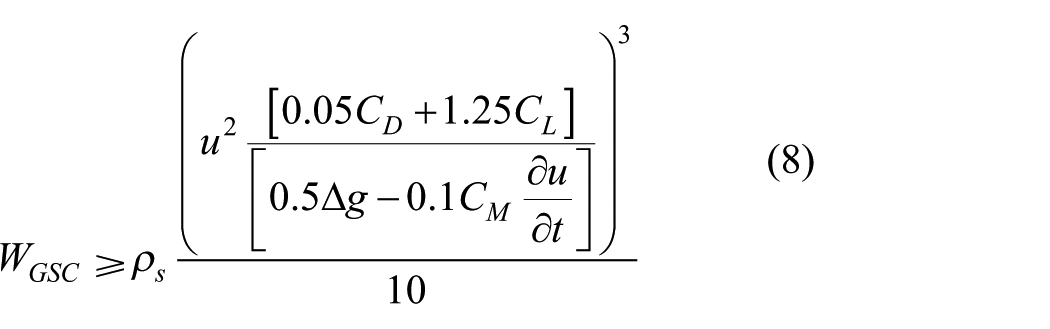
The cross-sectional view of the spur with geotextile tubes is shown in Figure 13.
Cross-section of spur using Geo-tube at section A–A (of Figure 9) (Option III).
Tidal modeling
General
The circulation-generating factor is a periodic or non-periodic perturbation of the free surface elevation (ζ) of the free elevation arriving from the open sea and developing over a period of several hours generated by the influence of the moon on the earth. The long waves arriving from the open sea enter through the open sea boundary, propagate to the coastal area, and are reflected from the coastal boundaries. They are subjected to various deformations due to diffraction, refraction, shoaling, and frictional losses of energy and part of their energy is radiated through the open sea boundary back to the sea. The circulation pattern is studied by mathematical modeling approach.
Mathematical modeling
The applicability of the long-wave mathematical theory can be verified by comparison with the wavelength L and the depth h. As this phenomenon evolves slowly with time, the velocity (u) profile develops uniformly in stages. The current intensity is almost uniform over the depth and steep gradients develop only near the bed. The uniformity of velocity over the depth permits simplification of the general model by integration over the depth and the introduction of the depth integrated mean velocity (U) values
In the case of homogeneous fluid, the pressure (p) terms become under the hydrostatic pressure approximation.
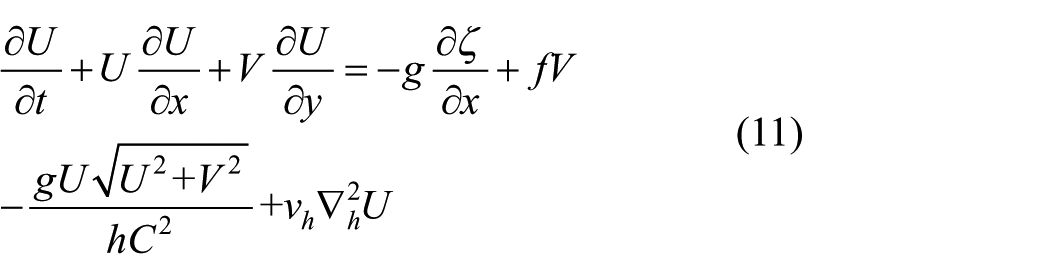
The Coriolis terms are retained. The approximation of the non-linear convective terms by their mean values results in a simple model known as the 2DHF model
where
Numerical solution of 2DHF model
The 2DHF model is solved using finite difference method. The flow domain is by an orthogonal horizontal grid with a mesh size, δx. The lateral coastal boundaries are approximated by mesh sizes δx or δy. The open sea boundaries are also selected piecewise by δx and δy. The unknown functions U, V, and Z are computed on the characteristic locations in a staggered way. U and V values are referring to Ox and Oy, respectively. Z refers to the mesh centers. The co-ordinates of the computation points are characterized by i, j, n indices; the first referring to the abscissa, the second to the ordinate, and third to the time.
The forward differences are used for the time derivative and the center difference for the rest of the space derivatives and synthesizing in an explicit finite difference scheme. The computation of U and V values at “n + 1” level time involves known values of U, V, Z (n and n + 1/2) and there is no algebraic system to be solved. The model indices i, j relevant to a typical mesh are illustrated in Figure 14.
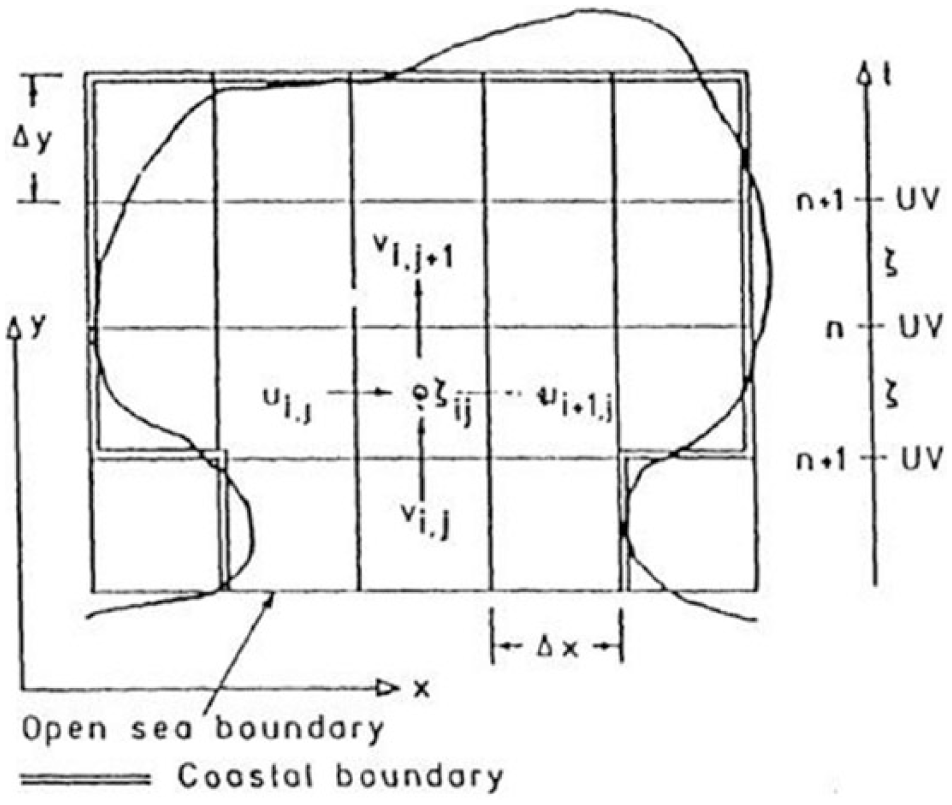
Gird details for tidal model.
The functional forms are
The present numerical model is based on alternating direction implicit (ADI) technique (Duff, 1983). ADI is an efficient method for numerical integration of the time-dependent Laplace tidal equations. The method is implicit, uses alternating directions in two space dimensions, with time staggering. It solves successively along X and Y directions implicitly and thus involving a large number of small algebraic system in all the field variables.
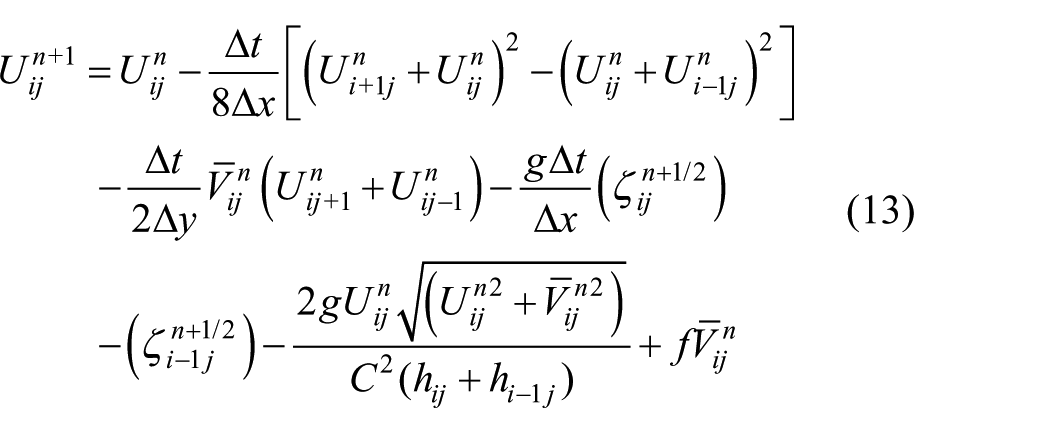
The finite differences according to the present explicit scheme are
The boundary conditions are treated simply with the assumed approximation for the coastal boundaries and the use of a staggered grid. A simple efficient approximation is the assumption of the velocity across the open sea boundary
Model execution
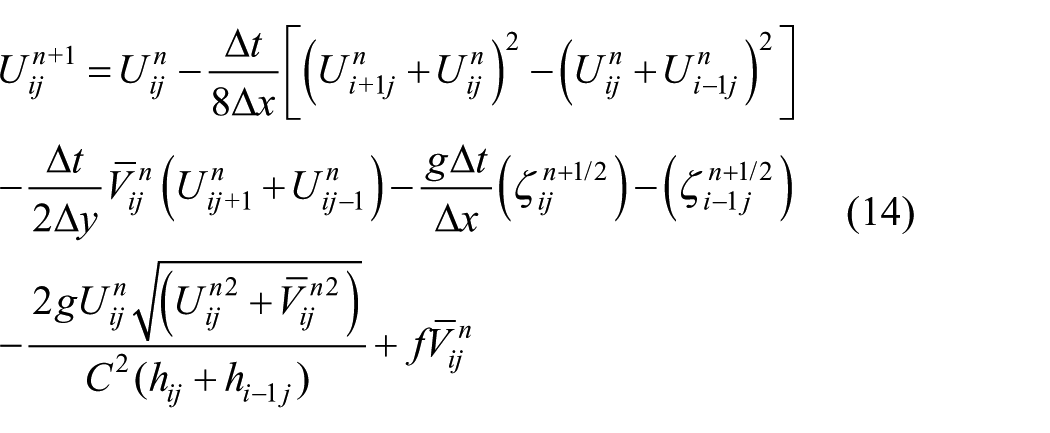
The input required to run the model include the discretized field under observation in time and space, boundary conditions, and other details like tidal period, amplitude, bed friction, and Coriolis constant. The input tidal elevation at the offshore boundary is shown in Figure 15. The domain is divided into a number of squares for the purpose of numerical integration as shown in Figure 16. The boundary of the domain consists of land boundary, island boundary, and boundary with open sea. The boundary with open sea is usually taken as a straight line. Tidal model is run for protecting coast, which is shown in Figures 17 and 18. Current velocity in U direction is 1.4 m/s and V direction is 1 m/s. The results indicate the degree of calmness that would prevail in the location of the proposed structures.
Input amplitude for tidal model.
Discretization of the domain and giving boundary conditions.
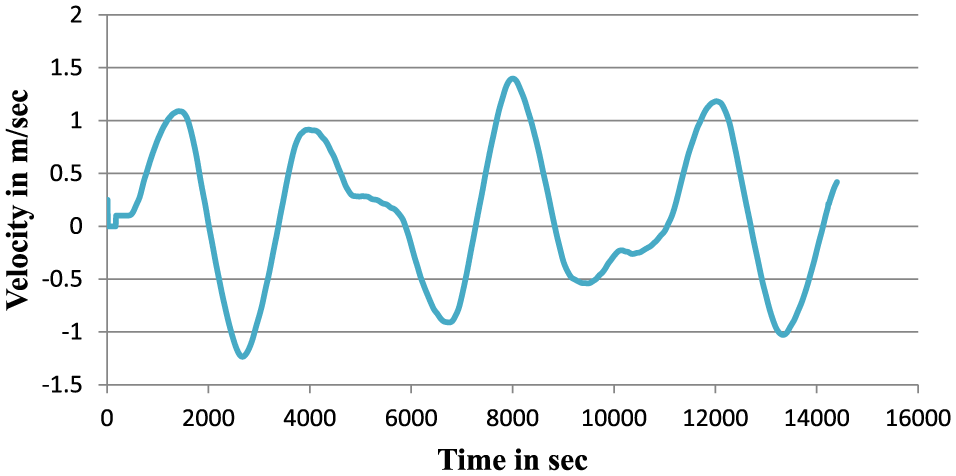
Current velocity in U direction.
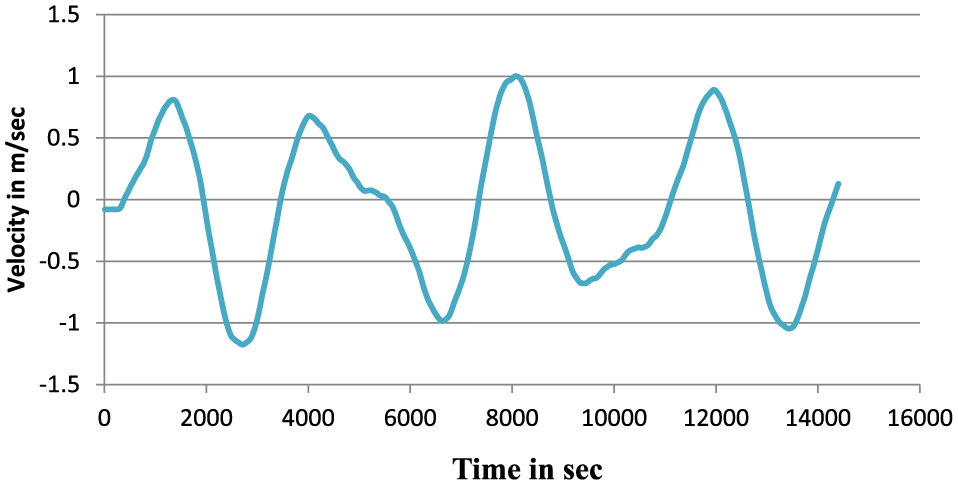
Current velocity in V direction.
Modeling of shoreline evolution
Numerical models offer the capability to study the effect of the wave characteristics, structure layout, and other associated parameters in providing reasonable estimates of the shoreline response. When a structure is constructed normal to the shoreline, it will intercept the free passage of longshore sediment transport (Van Rijn, 2001), resulting in an imbalance in the quantity of sediment in the near shore especially near the structure. This leads to accretion on the up drift side and erosion on the down drift side of the structure.
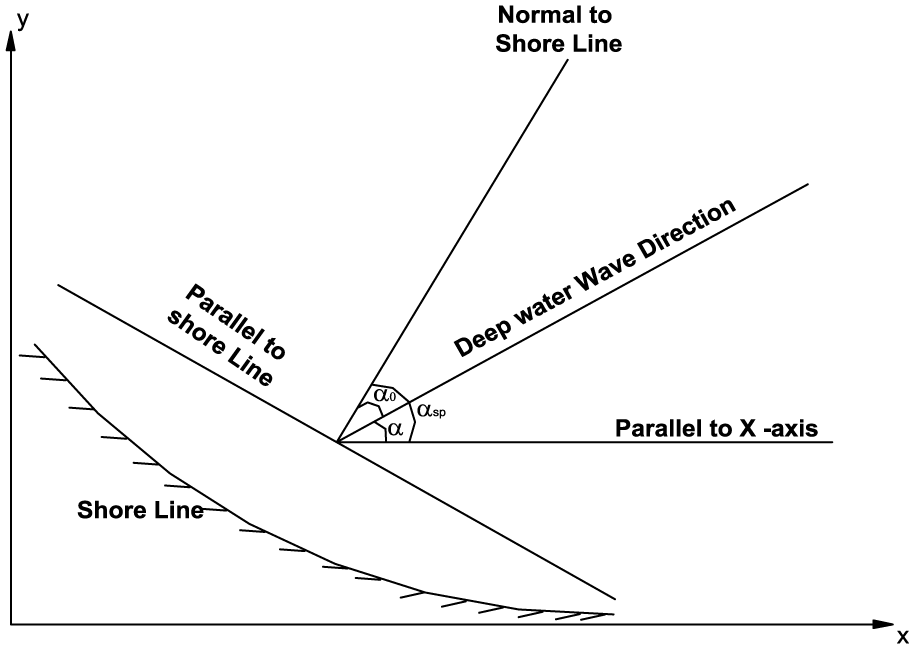
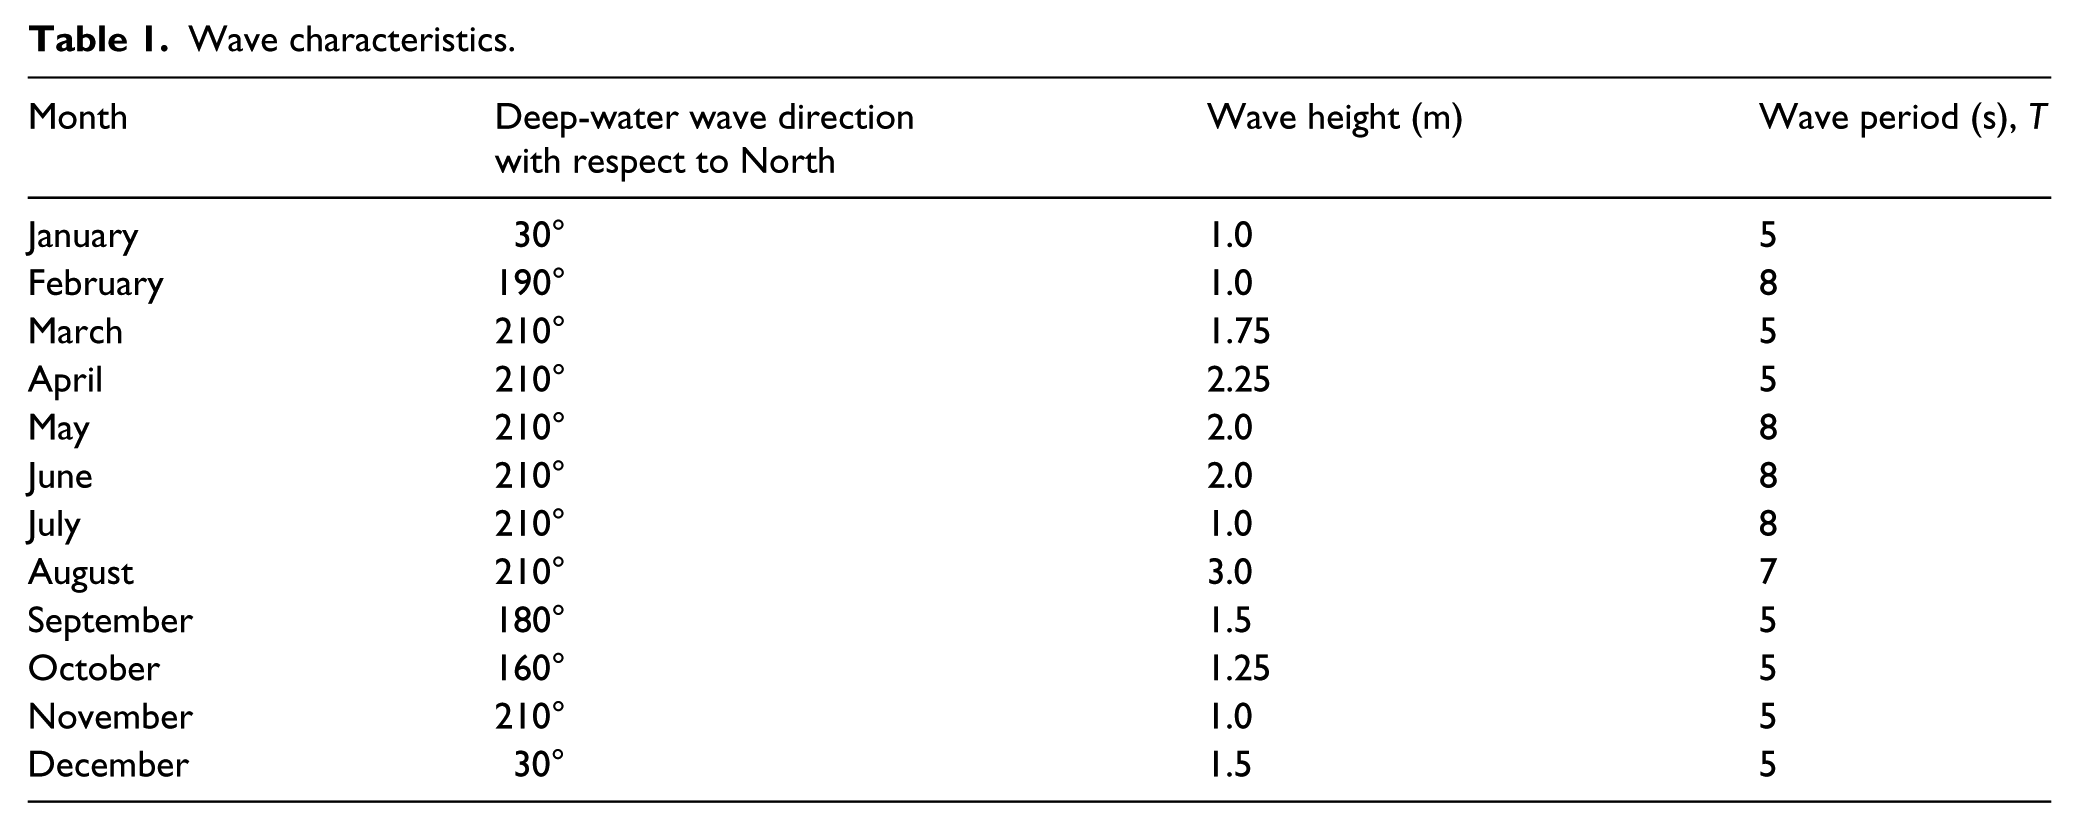
The deep-water wave angles were converted to that corresponding to shallow waters through Snell’s law, taking into consideration the inclination of shoreline with respect to geographic North. These shallow water wave angles were then expressed with reference to shore normal according to the angle conventions employed in the present numerical model. The conservation of energy while the wave propagates from deep to shallow waters is adopted to obtain the wave height at shallow water depth, that is, the offshore boundary for the wave transformation model.
Snell’s law (also known as the Snell–Descartes law and the law of refraction) that governs the wave refraction is given as
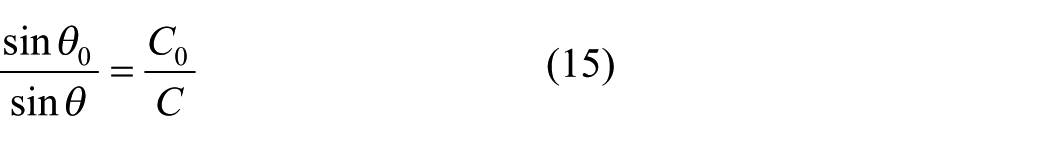
where C0 is the deep-water wave celerity (deep-water wavelength Lo = 1.56 T2) and C is the wave celerity. The angle conventions for the seabed contours, as well as for the wave direction used for the numerical model are shown in Figure 19.
Angle conventions used in the numerical model.
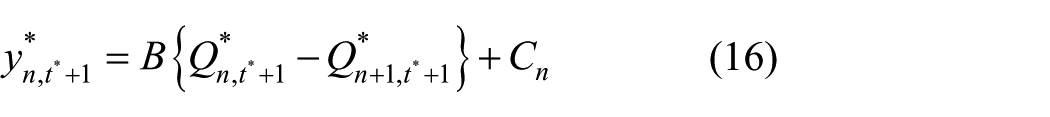
Kraus and Harikai (1983) proposed a numerical scheme to solve the one-line model using Crank–Nicolson implicit finite difference method. The non-dimensional equation of shoreline is
where
The non-dimensional shoreline is divided into “n” grid points at equal non-dimensional interval, δx*. Then, shoreline changes over a non-dimensional time δt* are calculated using Crank–Nicolson finite difference scheme. In this method, Q* at the time interval (t* + 1) is expressed in terms of the shoreline co-ordinate of y*, first isolating the term involving αsp (angle of shoreline normal to x-axis) using trigonometric identities. One of the terms involving αsp is then expressed as first-order quantities in y* at time step (t* + 1)

where αo = α − αsp and α is wave direction with respect to x-axis
where
By substituting above equations, the final equation leads to
The above equations represent a set of (N − 1) linear equation for (N − 1) unknowns. The end values are specified as boundary conditions, that is,
Wave characteristics.
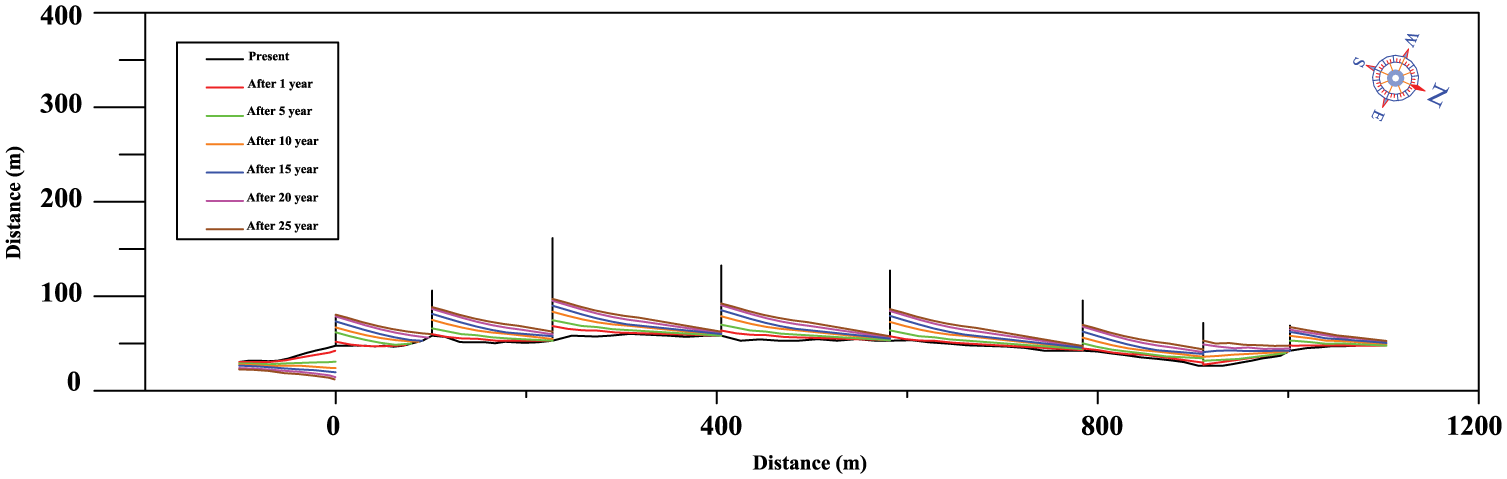
Shoreline evolution along the coast.
Conclusion
A detailed scientific investigation was carried out in arriving at suitable protection measure for the south-western coast of Mousuni island. The details of the protection scheme are summarized. The type of the spur to be adopted is considered based on the availability of natural rocks and other locally available materials and ease of construction with local manpower. The availability of 1.5–3 T natural rocks is not seen in the near vicinity of the site. Hence, the solution with geotextile tubes or with ballas is recommended after rectifying the existing defects as discussed earlier, which could be a solution for short term that might stretch over longer duration. As a pilot project, a trial spur made up of ballas of length of 20–30 m is recommended in the testing phase in order to examine the status of the banks for a year after its construction.
Footnotes
Funding
The author(s) received no financial support for the research, authorship, and/or publication of this article.