
Abstract
Among the different technologies developed in order to harness wave energy, the Oscillating Water Column devices are the most accredited for an actual diffusion. Recently, Boccotti has patented the REWEC1 (REsonant sea Wave Energy Converter solution 1), a submerged breakwater that performs an active coast protection, embedding an Oscillating Water Column device, which is capable of operating under resonant conditions with that sea state, which gives the highest yearly energy contribution. The REWEC1 dynamic behavior can be approximated by means of a mass-spring-damper system. According to this approximation, a criterion for evaluating the oscillating natural frequency of the REWEC1 has been derived. This criterion has been validated against both experimental results and computational fluid dynamics simulations, performed on a REWEC1 laboratory-scale model. The numerical simulations have shown a good agreement between measurements and predictions.
Keywords
Introduction
The first examples of patents on wave energy converters (WECs) were filed more than two centuries ago. Until today, more than 500 devices have been proposed, such as “rocking ducks” (Salter, 1974), “articulated rafts” (Cockerell, 1980); McCabe, 1992), “oscillating buoys” (Falnes and Budal, 1978), and “oscillating water columns” (Wells, 1993). Despite the inventive fervor, only few of these WECs were actually manufactured and tested. The largest obstacle to the commercial development of WECs is the high total cost. For instance, in the case of Oscillating Water Column (OWC) devices, the construction of a reinforced concrete structure is required and this can constitute up to 66% of total costs. A possible solution to reduce these costs is the insertion of the OWC device inside a breakwater. An example of this type of installation is the one operating in the port of Sakata (Takahashi et al., 1992) since 1989. In this way, the incidence of the cost due to the structure for the OWC is drastically reduced, and the plant fulfills a double purpose: to defend the stretch of water behind it and to produce electrical energy by means of generators connected to one or more turbines (for instance, high solidity Wells turbines). The Wells turbine is actually a self-rectifying axial flow turbine (Raghunathan, 1995) suitable for the conversion of the kinetic energy of the oscillating air flow into unidirectional mechanical energy of the turbine shaft. Another possibility is the use of impulse turbines (Thakker and Hourigan, 2004). Both Wells and impulse turbines have been examined in various configurations for wave energy conversion (e.g. Setoguchi and Takao, 2006). In order to improve the energy conversion process, both high and low solidity Wells turbines need to be characterized by good efficiencies over a wide range of flow rates (Curran et al., 1997; Raghunathan, 1995). Furthermore, turbine performance has to be optimized not only considering the turbine as a standalone machine but also as a whole together with the OWC plant. Several experimental analyses have been carried out in order to investigate the performance of Wells turbines. For instance, wind tunnel tests have been considered under both constant or reciprocating flow conditions (Torresi et al., 2007), using scaled devices (Filianoti and Camporeale, 2009), or in operative plants, such as the LIMPET (Heath, 2009) and the PICO ones (Falcao, 2001). More detailed investigations of the fluid dynamics of Wells turbines have been carried out by means of computational fluid dynamics (CFD) analysis, regarding hydraulic low solidity Wells turbines (Camporeale et al., 2003), or high solidity Wells turbines (Dhanasekaran and Govardhan, 2005; Torresi et al., 2008). More recently, Boccotti (1998, 2001) invented a family of WECs named REWEC1 (REsonant sea Wave Energy Converter solution 1), which consists of several caissons placed close to each other, in order to form a submerged breakwater (Figure 1(b)). Each caisson encloses a pressurized air volume, which is connected to a completely submerged vertical duct open to the sea, where a hydraulic low solidity Wells turbine can be placed for the direct conversion of the kinetic energy of the OWC into mechanical energy (Torresi et al., 2004).
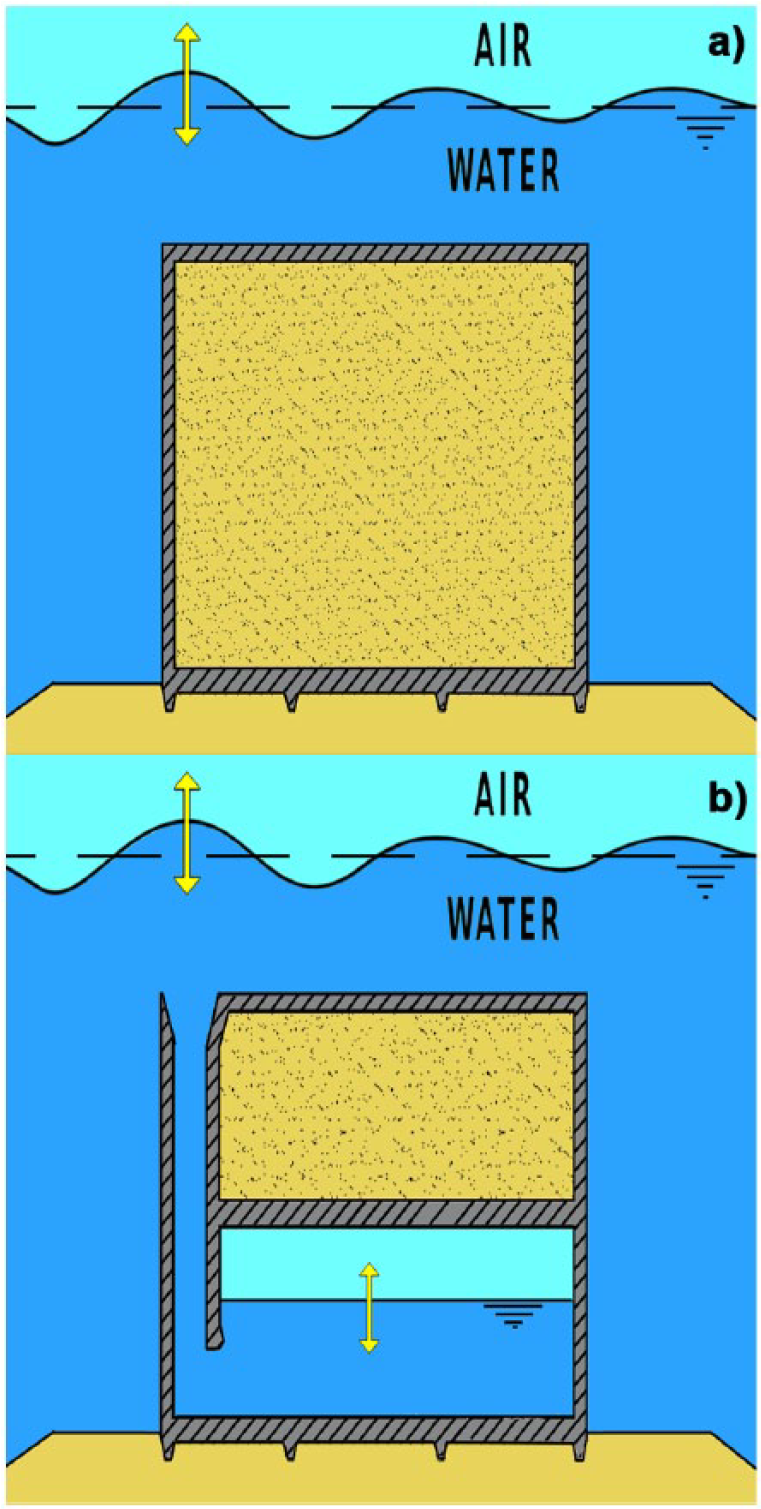
(a) Conventional breakwater and (b) REWEC1 schematics.
Actually, the incident waves cause fluctuations of the water free surface inside the pressurized caisson, and the alternate exhalation and inhalation of the water in the vertical duct drive the turbine. The main characteristic of the REWEC1 is that it can be designed in order to operate under resonance conditions with the characteristic frequency of the sea state, which gives the greatest yearly energy contribution. Under such conditions, the amplitude of the fluctuations of the water free surface inside the pressurized caisson increases, increasing the amount of kinetic energy of the OWC. Actually, the REWEC1 dynamic behavior can be approximated by means of a mass-spring-damper system. According to this approximation, a criterion for calculating the oscillating frequencies of the REWEC1 can be derived. This criterion has been validated against both the experimental results and CFD simulations, performed on a REWEC1 laboratory-scale model. Previously, CFD simulations were also carried out in order to study the dynamic behavior of a scaled model placed in a wave flume (Scarpetta et al., 2015).
Experimental set-up
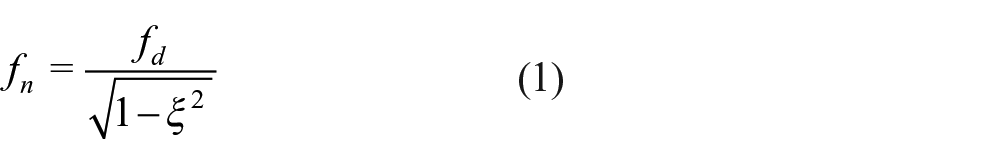
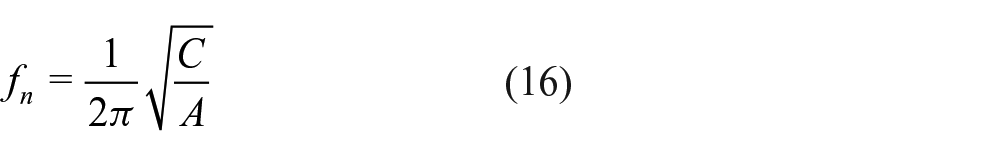
The REWEC1 (Figure 1(b)) is essentially a submerged caisson with a U-tube inside. The first branch of the U-tube is a vertical duct connecting the free water surface to the second branch, a chamber in which an air pocket is generated by means of compressed air. The value of the REWEC1 undamped natural frequency,
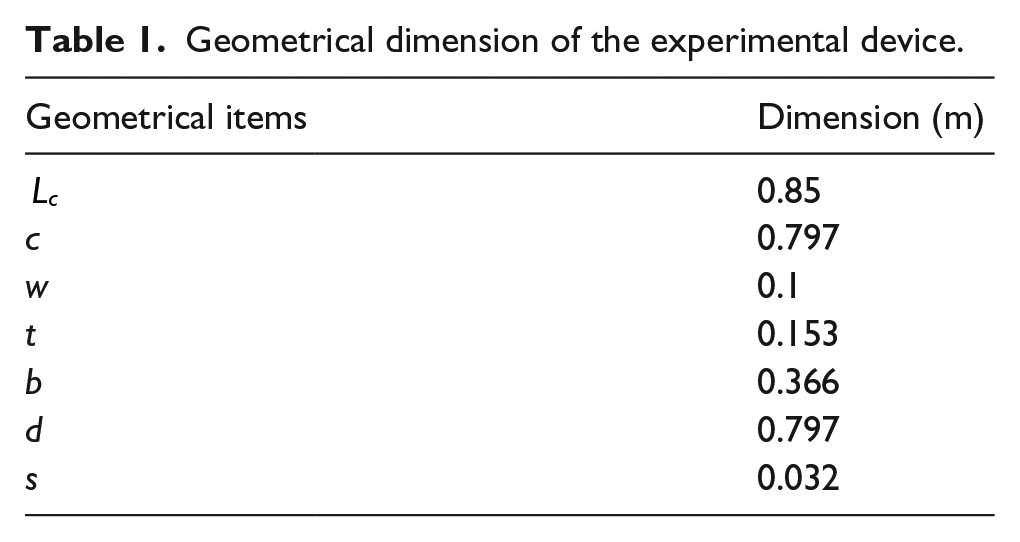
All the geometrical parameters (Figure 2(a)) of the experimental device are summarized in Table 1.
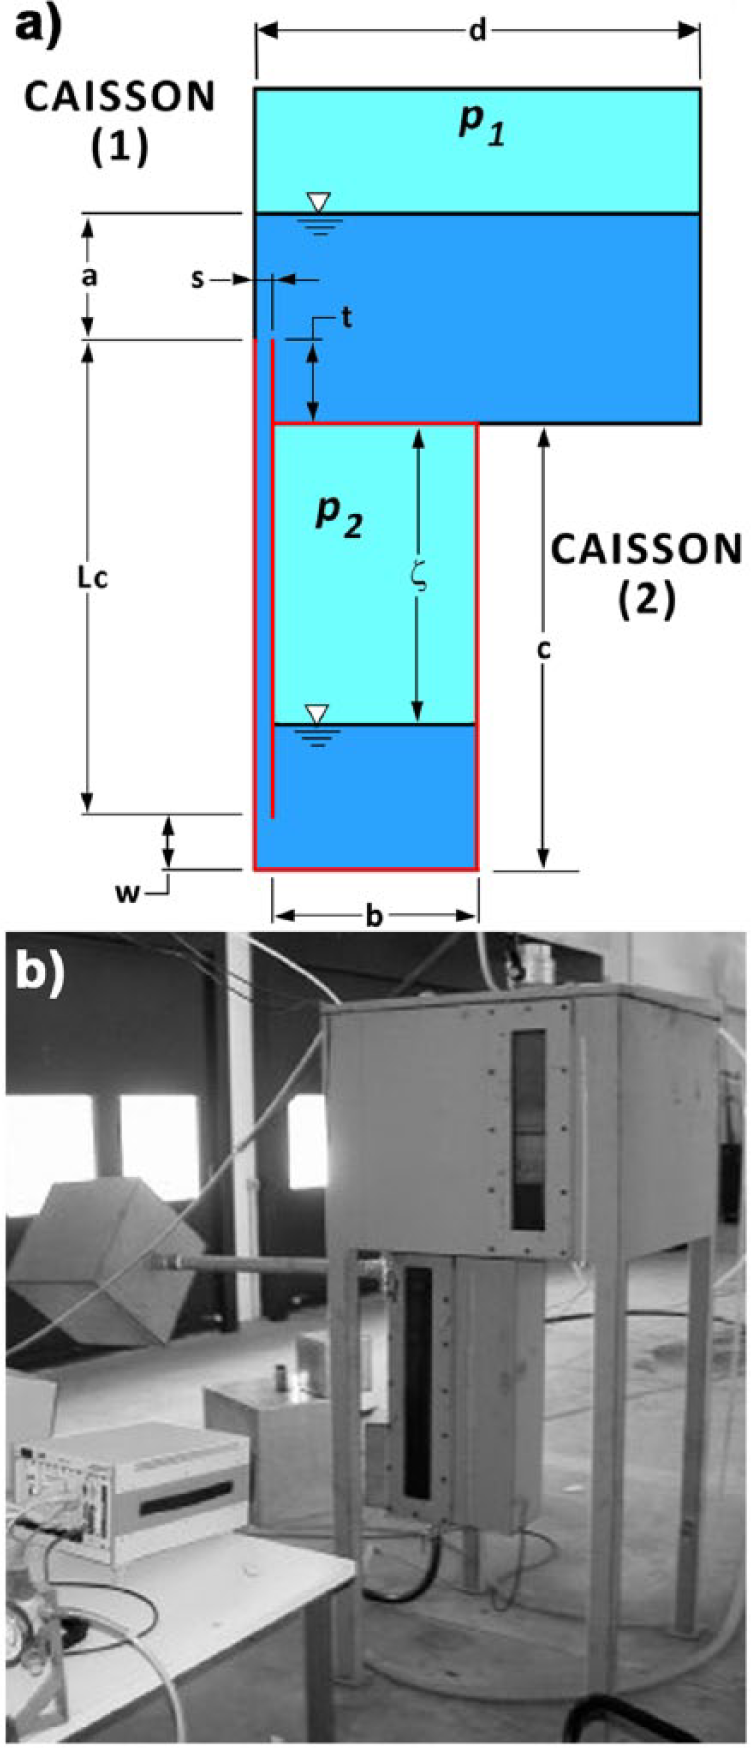
(a) Section of the experimental device and (b) the experimental device.
Geometrical dimension of the experimental device.
The test procedure is as follows:
The valves of both upper and lower caissons are opened, connecting each air pocket with the atmosphere.
A specified amount of water is introduced in the upper caisson and part of it overflows in the lower one. During this operation, the valve in the lower caisson is closed, in order to generate an air pocket inside it with a
Air is pumped inside the lower caisson until the desired resting condition is achieved.
In order to generate the initial non-equilibrium condition (
When the valve of the upper caisson is opened, the value of the pressure in the upper caisson drops to the atmospheric value and the free damped harmonic oscillations occur.
In order to evaluate
Initial and resting conditions of the CFD simulations.
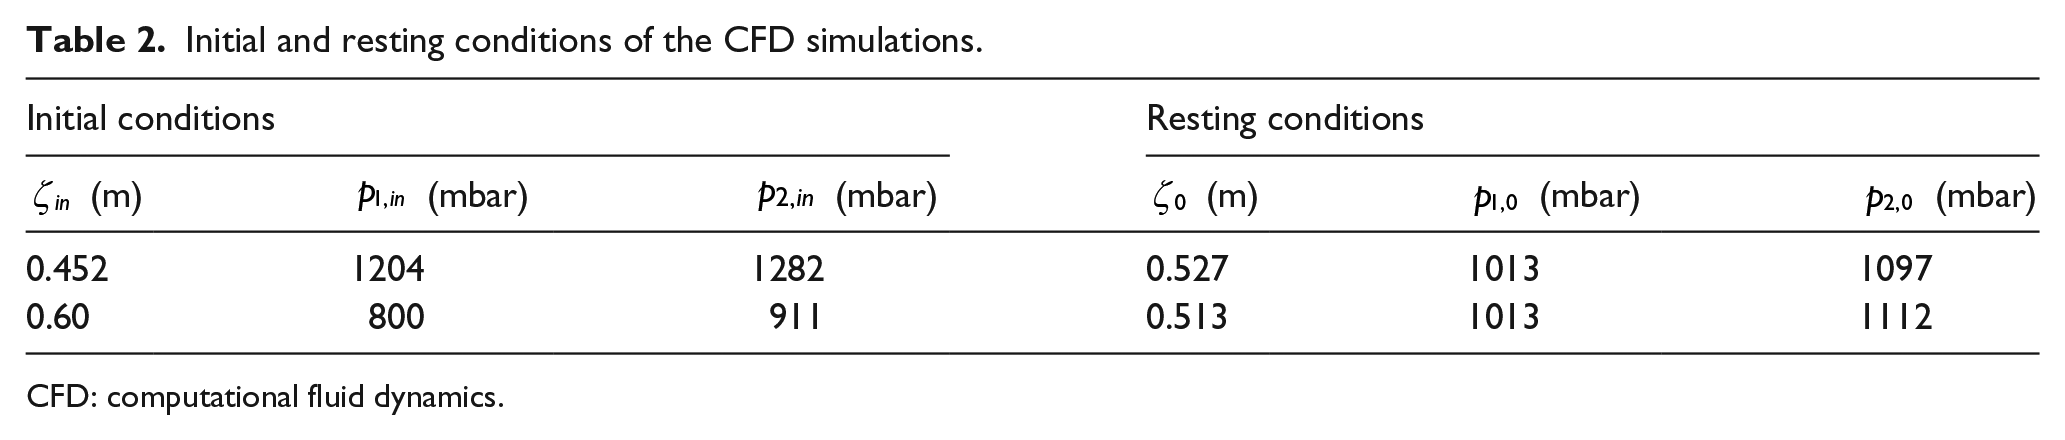
CFD: computational fluid dynamics.
Analytical model
An analytical model, describing the behavior of the water flow inside a REWEC1, has been developed under the simplifying hypothesis of one-dimensional and incompressible flow. Actually, the REWEC1 is essentially a U-tube (Figure 3) and its fluid-dynamic behavior can be correctly described along a streamline, which starts from the air–water interface inside the lower caisson (point A) and ends at the air–water interface inside the upper caisson (point B).
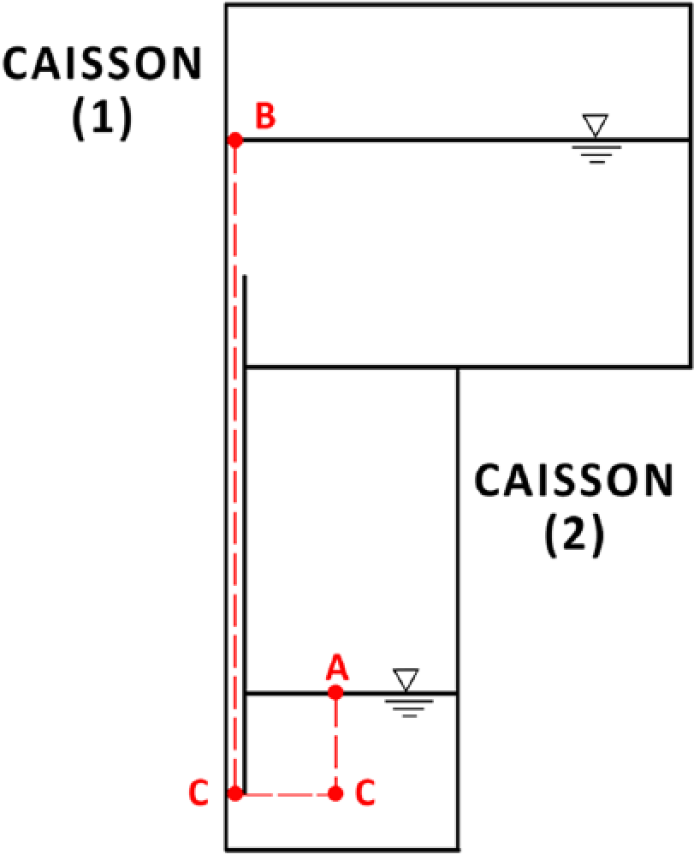
Streamline describing the fluid dynamics of water inside the REWEC1.
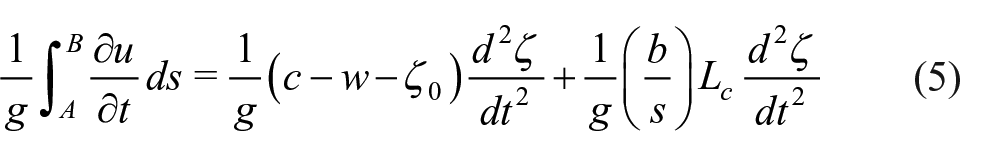
Applying the generalized Bernoulli equation along that streamline, one obtains
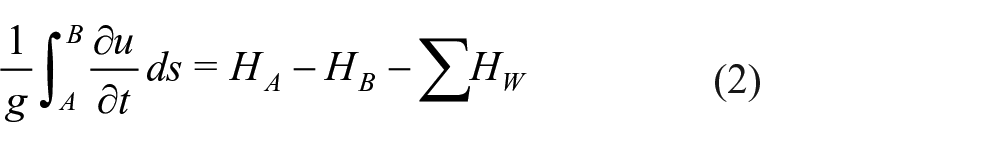
where
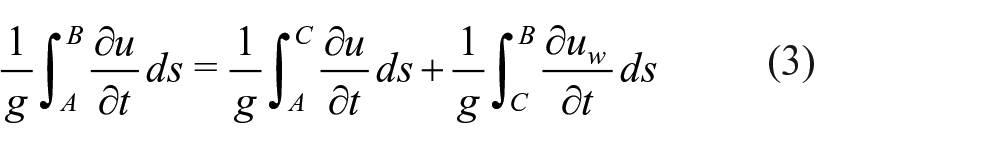
where, in the first integral,
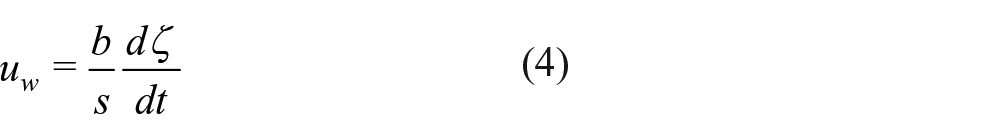
where
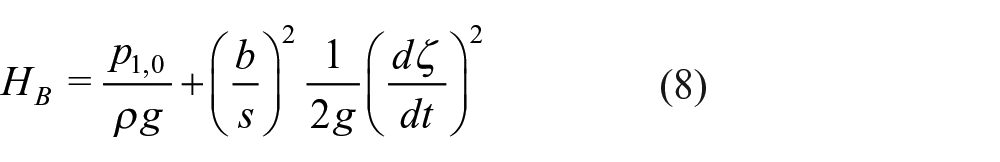
The total head,
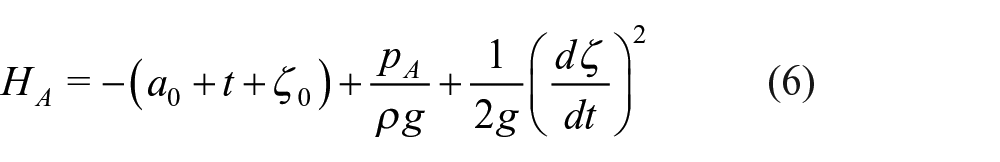
Assuming a polytropic law for the thermodynamic behavior of the air inside the chamber,
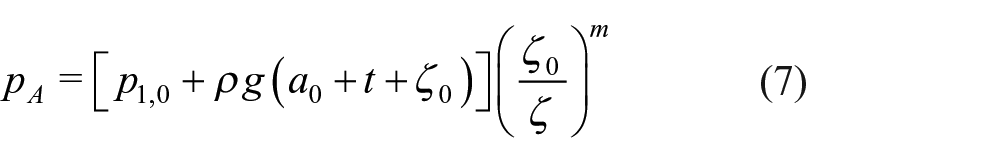
where the subscript “0” refers to the resting condition and m is the polytropic index. Actually, an isentropic law for the thermodynamic behavior of air has been assumed; then the value of the polytropic index has been considered to be equal to 1.4. The total head,
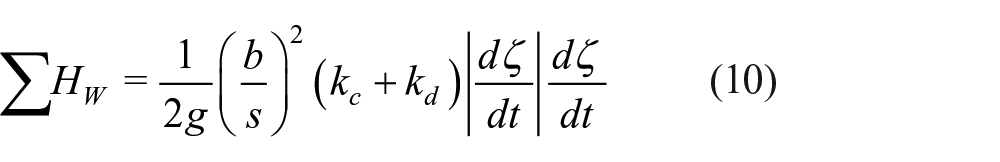
The head losses,
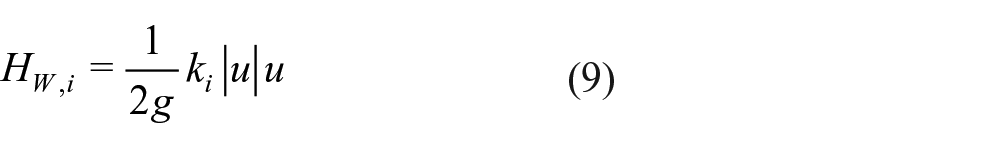
where
Substituting Equations 6, 8, 10 in Equation 2 leads to a non-linear second order differential equation
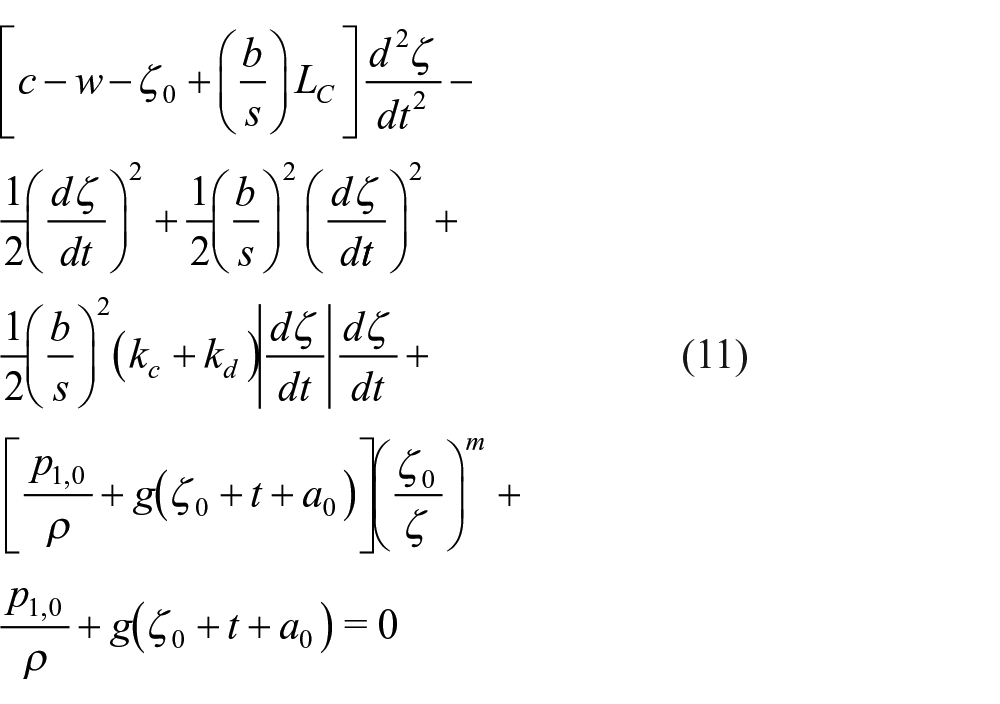
In order to obtain a simple solution for this problem, Equation 11 needs to be linearized, in particular the terms associated to polytropic law inside the air pocket and the head losses. The linearized form of Equation 11 becomes
where
where
which, actually, depends on the geometry of the device and the value of the pressure inside the air pocket. In order to validate the analytical model, the value of
CFD analysis
The CFD analysis has been carried out using a computational domain, which reproduces the 2D schematic reported in Figure 2(a)). This domain has been discretized by means of the grid generator Pointwise adopting a multi-block structured mesh. The total mesh size has approximately 60,000 cells. The numerical domain has been imported in the ANSYS Fluent solver. The physical model under investigation is described by means of the Navier–Stokes equations written for an unsteady two-phase flow. These equations are discretized according to a Finite Volume approach, adopting a pressure-based algorithm in its implicit formulation. The two-phase interaction is taken into account by means of the Eulerian Volume of Fluid (VOF) Model. Air is assumed to be compressible, in order to take into account the compressibility of the air pocket inside the chamber. The SIMPLE algorithm has been used for the pressure-velocity coupling. Regarding the spatial discretization of the equations, the Green-Gauss cell-based scheme has been used for gradients, the PRESTO! scheme for pressure, whereas first-order upwind schemes for momentum and the energy. In order to evaluate the surface of separation of the different phases, the Geo-Reconstruct model has been used. Regarding the temporal discretization, a time step t = 0.001 s has been chosen and the first-order implicit scheme has been used for the transient formulation. Every two time steps, the values of the pressure inside both the lower and the upper caissons have been registered, allowing the analysis of the dynamic behavior of the water inside the device during post-processing.
Results
In order to make a comparison with the experimental test, a numerical simulation has been carried out, setting the values of the initial and the resting conditions reported in Table 2. The graph in Figure 4 shows a comparison between the values of
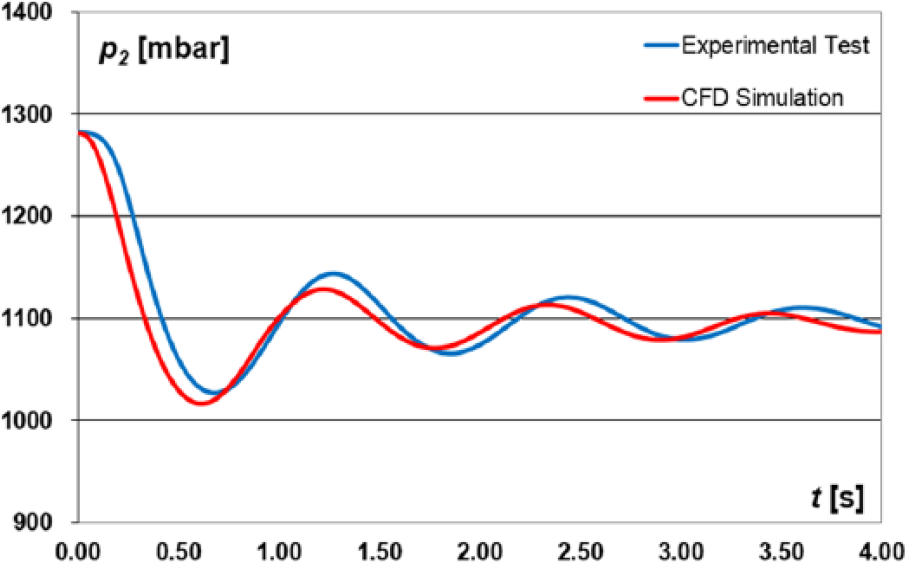
Values of
From both the experimental and the CFD analyses, the value of the undamped natural frequency,
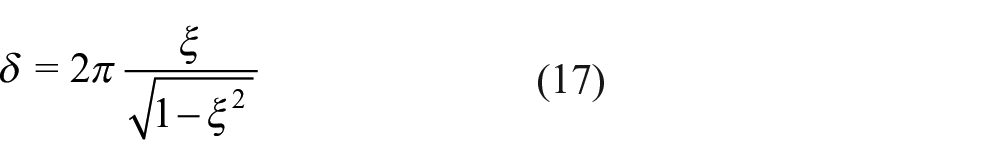
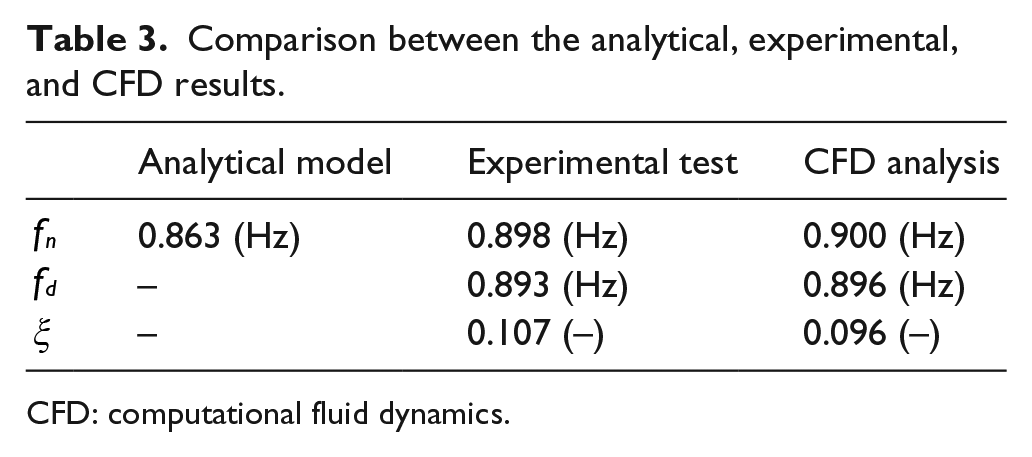
Table 3 summarizes the results derived from the analytical model, the experimental test, and the CFD simulation. Other CFD simulations have been carried out considering the same resting conditions and varying the initial ones (Table 4). From the registered value of
Comparison between the analytical, experimental, and CFD results.
CFD: computational fluid dynamics.
Initial and resting conditions of the CFD simulations.
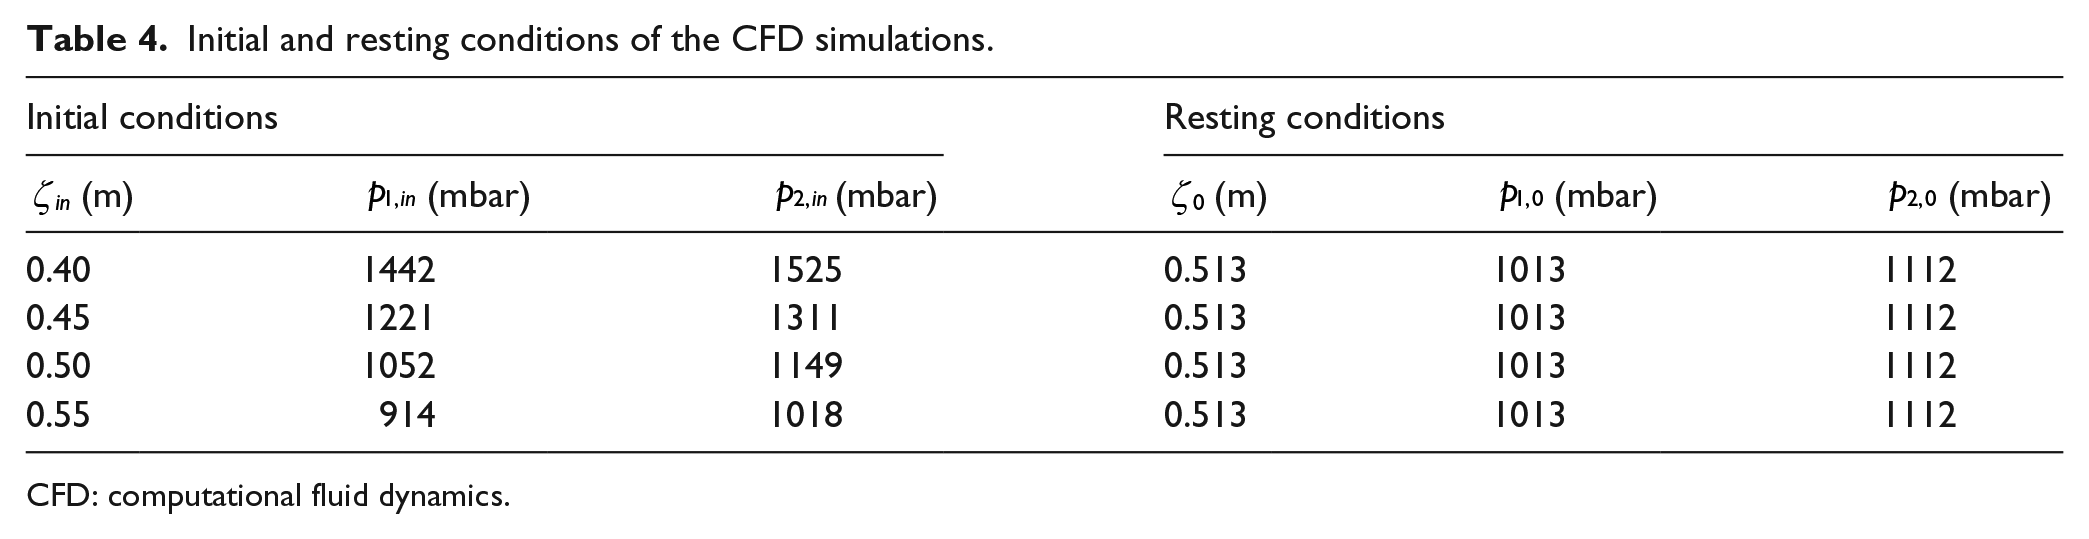
CFD: computational fluid dynamics.
The graph reported in Figure 5(a)) shows the values of
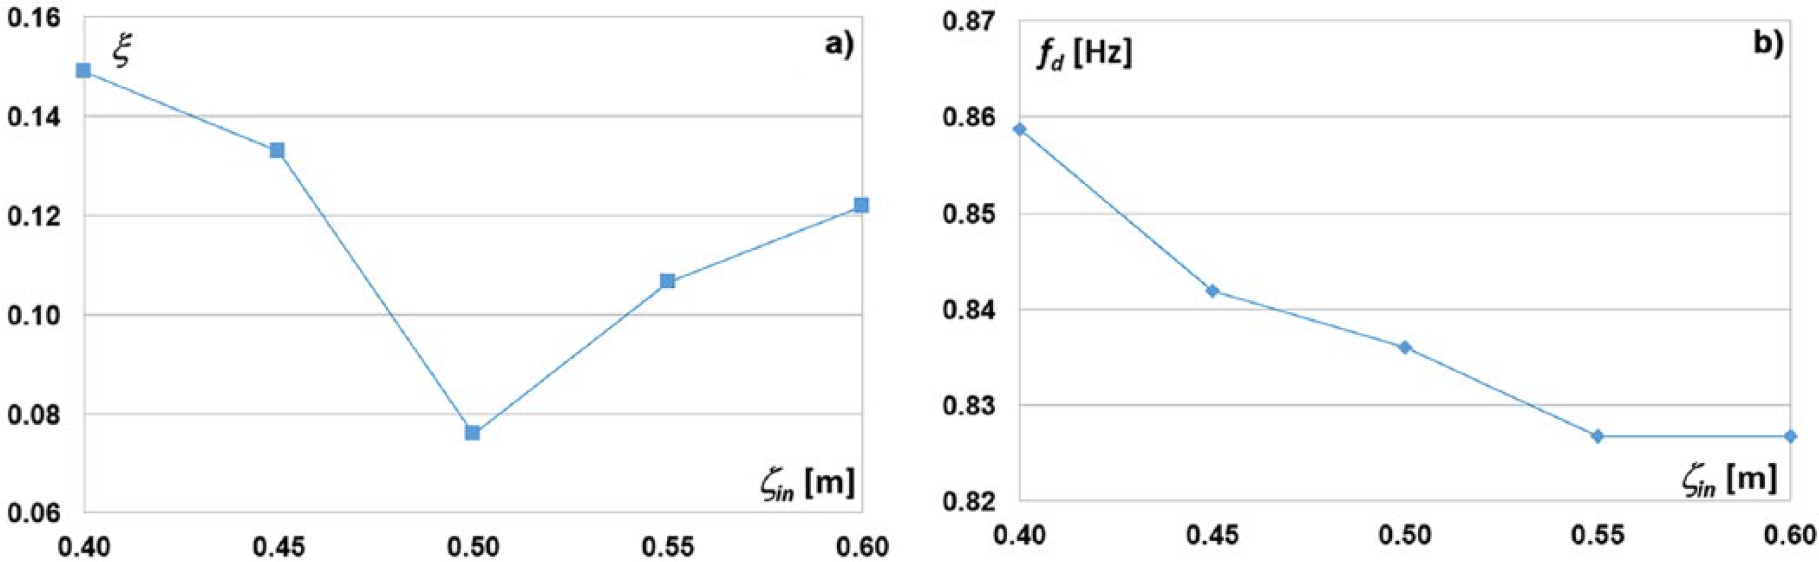
Values of (a)
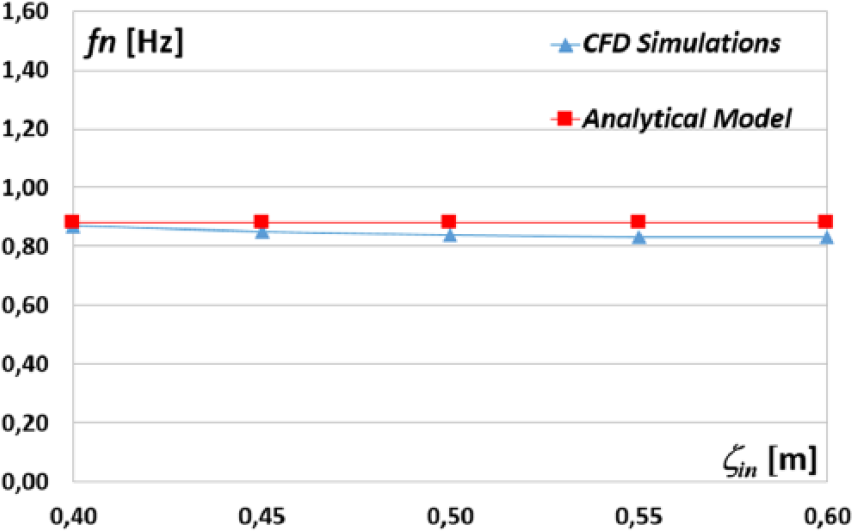
Comparison between the values of
Conclusion
The results derived from the CFD simulations are in good agreement with the experimental test ones, showing that the proposed 2D numerical model can be successfully used for the evaluation of both the damped,
Footnotes
Funding
The author(s) received no financial support for the research, authorship, and/or publication of this article.