
Abstract
Tsunami inundation model ‘TUNAMI-N2’ was set up for five different scenarios of earthquake (Sumatra 2004, Car Nicobar 1881, North Andaman 1941, Makran 1945 and Worst-case) to assess the potential risk of tsunami along Koodankulam coast. Bathymetry and land topography were extracted from the General Bathymetric Chart of the Oceans, C-MAP and CARTOSAT to set up a four-layered nested model, where the finest grid was set up for 93 m in non-linear mode. The aim of the study was to provide the potential run-up and inundation that could occur in worst situation along the Koodankulam coast. The sensitivity analysis was also carried out to assess the effects of various fault parameters. From sensitivity analysis, it is inferred that the tsunami wave height is directly proportionate to slip amount and inversely proportionate to focal depth. The potential tsunami run-up heights were found between 1.30 and 3.54 m and inundation was between 0 and 90 m at Koodankulam and surrounding regions. But, no horizontal inundation was observed for any scenarios around the Koodankulam plant area as the region. The highest run-up heights of five models were used to evaluate the possible vulnerability of power plant for tsunami hazards.
Introduction
The 26 December 2004 earthquake of Mw 9.3 occurred along the plate boundary marked by subduction zone between the Indian plate and the Burmese micro-plate near Sumatra Island of Indonesia. This earthquake had a rupture length of 1200 km propagating towards the north of the epicentre and created large-scale devastation and huge damage to the properties along the coastal cities of the Indian Ocean rim countries. In 2011, Japan earthquake generated the Tsunami wave of 40.5 m height, which completely damaged the coast of Japan and Fukushima nuclear power plant. This incident raised the question of nuclear plant safety in countries around the world. Considering this fact, India has established a Tsunami Early Warning Centre at Indian National Centre for Ocean Information Services (INCOIS), Hyderabad, with all the necessary computing and communication infrastructure to issue alarms/alerts in the event of a tsunami (Nayak and Kumar, 2008). Pacific Ocean reports at an average of about eight tsunamis per year, whereas Indian Ocean has one in 3 years or so (Rastogi and Jaiswal, 2006). In the 19th and 20th centuries, tsunamis have been much more frequent in the eastern Indian Ocean within a period of 3 years or so (Rastogi and Jaiswal, 2006).
There are several tsunami inundation models reported in the literature; all these models mainly deal with tsunami generation, propagation and coastal inundation aspects. Titov and Synolakis (1995, 1996) and Titov and Gonzalez (1997) describe the Method of Splitting Tsunami (MOST) model, developed at the Pacific Marine Environmental Laboratory (PMEL) of National Oceanic and Atmospheric Administration (NOAA) in Seattle, USA. Agarwal et al. (2005) mentioned about the Tidal Ocean Atmosphere Surge and Tsunami simulations (TOAST) model. Kowalik et al. (2005a, 2005b) applied a global tsunami model (GTM) to the Indian, Atlantic and Pacific Oceans. Jaiswal et al. (2008) made an attempt for a numerical simulation of the Arabian Sea tsunami generated due to 1945 Makran earthquake and its effect on Western parts of Gujarat (India) using TUNAMI-N2 model. Usha et al. (2009) studied the vulnerability of the Car Nicobar coast to tsunami hazard using TUNAMI-N2 numerical model for various past earthquake scenarios. Also, Yalciner et al. (2005) studied the generation, propagation and coastal amplification of 26 December 2004 Sumatra tsunami waves using TUNAMI-N2 model.
Historically, earthquake generated tsunami had occurred in past and affected Indian coast. An earthquake of magnitude Mw 7.9 occurred at Car Nicobar Island on 31 December 1881 in the Bay of Bengal. Even though the run-up of this tsunami was not so large, the impacts were visible at Andaman and Nicobar Islands and east coast of India. A run-up of 1 m was observed at Port Blair on South Andaman Island (Berninghausen, 1966), whereas about 0.75 m in the Nicobar Islands. The 26 June 1941 Andaman earthquake with a moment magnitude Mw 7.7 (Biham et al., 2005) had also triggered a tsunami in the Bay of Bengal. Sharma et al. (2005) carried out the numerical simulation of tsunami due to 1945 Makran earthquake in Arabian sea. The tsunami reached a height of 12–15 m in some parts of Makran and caused great damage to the entire coastal region. The tsunami had a run-up of 11.0–11.5 m in Kutch, Gujarat (Pendse, 1945). Tsunami models provide a useful tool in hand to simulate the past tsunamis and potential worst-case scenarios and their impact on nearby coast. The details of subduction zones, information about the seismic deformation and mechanism of earthquake faulting are needed as an input to determine the initial deformation at the source and then compute the tsunami propagation, run-up heights and inundation for each scenario. Information obtained from worst-case scenarios provides a basis for creating tsunami evacuation maps and procedures to deal with disaster.
In this study, TUNAMI-N2 numerical model was used to estimate the run-up height and inundation along the Koodankulam coast. The purpose of numerical modelling is to determine the travel times, potential run-ups and inundation from a local or distant tsunami to evaluate the risks. This model solves the shallow water equations by finite differences in an explicit rectangular staggered leap-frog scheme in a set of interconnected grids (Goto et al., 1997). The algorithm of Mansinha and Smylie (1971) was used to calculate the seafloor deformation. The Indian Tsunami Warning Centre at INCOIS, Hyderabad, also uses the same model for providing early warning. Five different earthquake events (Sumatra 2004, North Andaman 1941, Car Nicobar 1881, Makran 1945 and hypothetical worst-case) were taken into account to estimate the impact along Koodankulam coast.
Materials and methods
Tsunamis are long waves which are mainly generated by the movement of sea bottom due to earthquakes. Theory of tsunami waves has been discussed in the literature by several researchers (Imamura, 1996, 2006; Witham, 1974; Yalçıner et al., 2003). To obtain the initial surface wave, the initial sea bottom deformation is necessary. Mansinha and Smylie (1971) and Okada (1992) had given a complete set of closed form analytical expressions for a point and a rectangular source to obtain the internal as well as surface deformation and strains for a given volume. For this, one needs the information pertaining to the earthquake source parameters such as fault length, width of the fault, focal depth, fault angle, fault axis, dip angle, slip angle and displacement. Once the initial wave is generated, one of the wave fronts would start moving towards the deep ocean and the other towards the local shoreline.
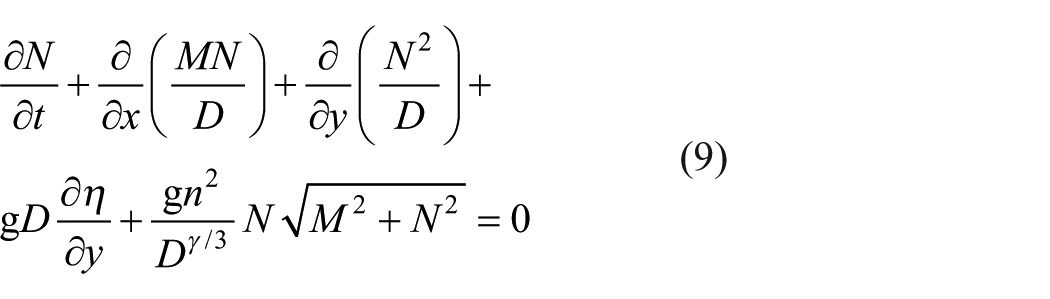
The code TUNAMI-N2 used in this article was originally formulated by Prof. Fumihiko Imamura in Disaster Control Research Centre in Tohoku University (Japan) through the Tsunami Inundation Modelling Exchange (TIME) program. TUNAMI-N2 is one of the key tools to study propagation and coastal amplification of tsunamis in relation to different initial conditions. The program can compute the water surface elevation and velocities due to tsunami across entire computational domain. TUNAMI-N2 code was implemented to simulate tsunami propagation and run-up in Pacific, Atlantic and Indian Oceans (Yalçıner et al., 2003). For the propagation of tsunami in the shallow water, the horizontal eddy turbulence is negligible as compared with the bottom friction. Since the vertical acceleration associated with tsunami waves is small compared with the gravity acceleration, tsunami waves are usually resolved using two-dimensional (2D) hydrostatic models. The governing 2D equations for tsunami modelling have been discussed in detail (Imamura, 1996, 2006; Yalçıner et al., 2003) and are mathematically expressed as
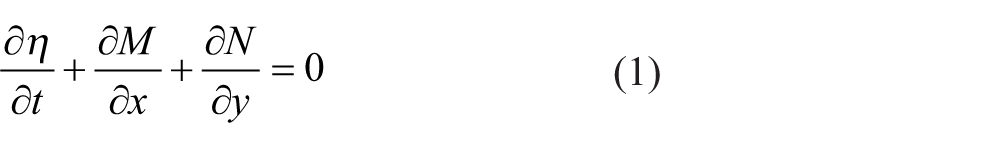
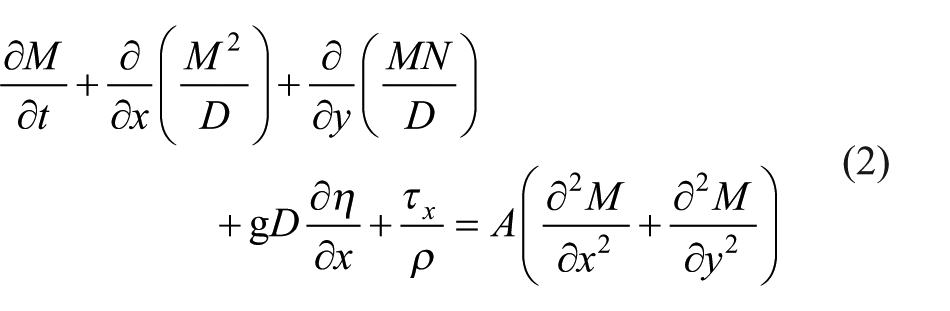
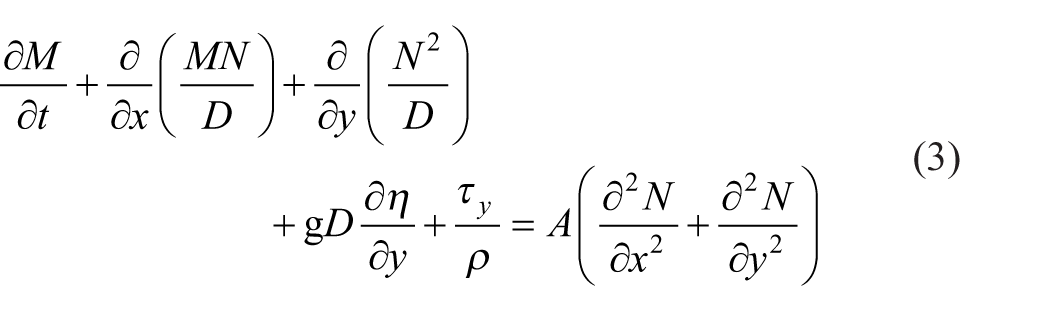
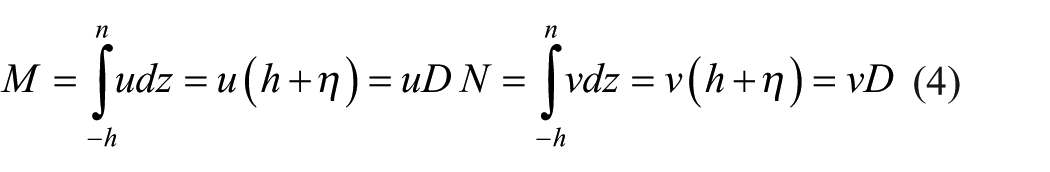
where D is the total water depth given by (h + η), sx and sy the bottom frictions in the x and y directions, A the horizontal eddy viscosity which is a constant in space and the shear stress on a surface wave is neglected and M and N are the discharge fluxes in the x and y directions, given by
The bottom friction is generally expressed as follows
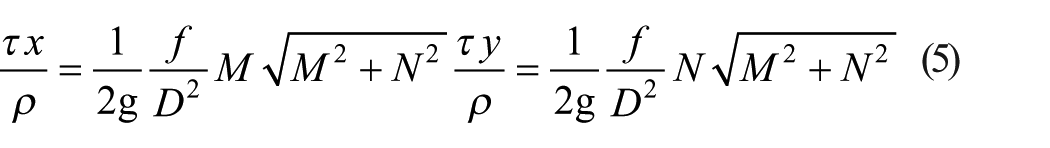
The above expression shows that the bottom friction increases with the fluxes and is inversely proportional to the depth. Thus, wave energy dissipates faster when it propagates in shallow water areas. The friction coefficient ‘f’ and Manning’s roughness ‘n’ are related by
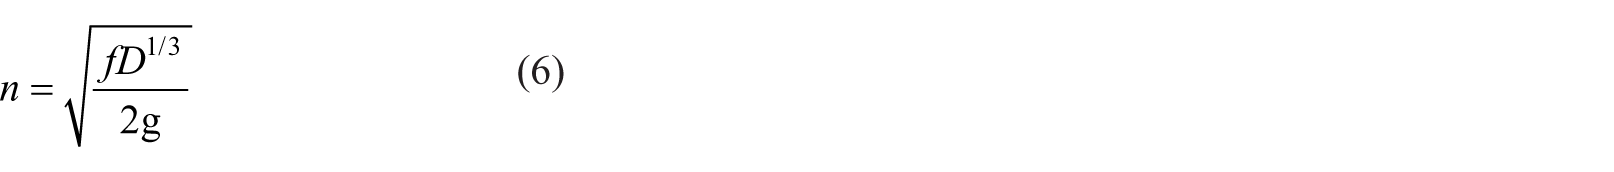
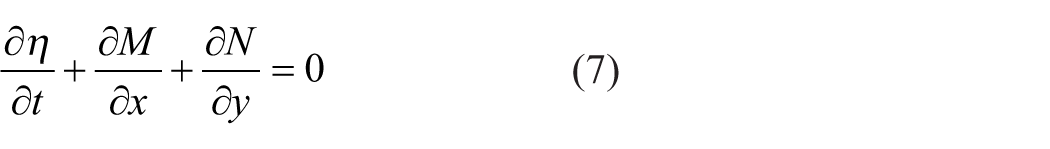
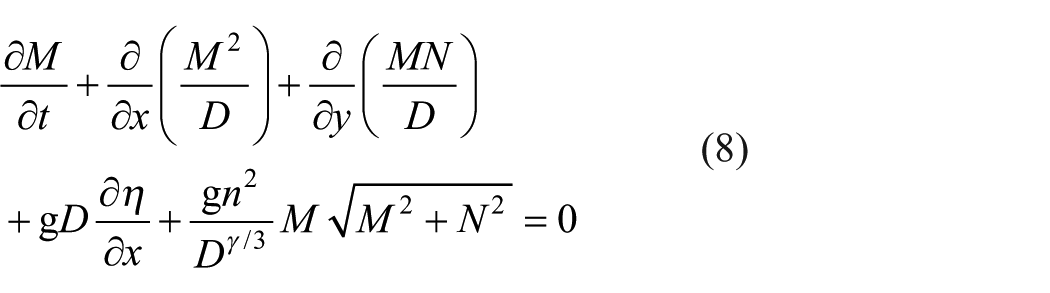
It is seen that when D is small and f becomes large, then n remains almost a constant. Substituting M, N and the above values in equations (1), (2) and (3), fundamental non-linear shallow water wave equations are obtained as
The associated boundary conditions used are initial conditions computed using Mansinha and Smylie (1971) method and open sea boundary conditions, that is, at the open sea, the boundary condition is free transmission and the boundary condition on land is assumed to be a perfect reflector. The hydrodynamic effect is often neglected since the horizontal size of the wave is sufficiently larger than the water depth at the source. The frictional coefficient used in this study is 0.025. The code is being used extensively by tsunami modellers to understand the tsunami propagation, arrival times at different location run-ups and inundation extents. Once the results using the TUNAMI-N2 code are obtained, codes are written to display the output like directivity maps, run-ups and inundation extent in MATLAB. This code neglects Earth’s curvature and Coriolis force, and the code is formulated in Cartesian coordinate system. This formulation had also been used to study similar tsunami propagation from the Andaman-Sumatra subduction zone (Srivastava and Dimri, 2007).
Bathymetry and land topography
High-quality and fine-resolution data of elevation and bathymetry are very vital to set up a nested inundation model. The information of land topography of the coastline and nearshore bathymetry plays a vital role in tsunami wave propagation and accurate prediction of run-up heights and inundation. The deep sea bathymetry data were extracted from the General Bathymetric Chart of the Oceans (GEBCO; 1.86 km) data from source to 150-m depth along coast. The coastal bathymetry, that is, from 150-m depth to coast, was extracted from C-MAP data. Land topography data were generated from the Cartosat – Digital Elevation Model (Cartosat-DEM). Cartosat-DEM is one of the fine resolution DEM available along the entire Indian coast which has 10-m horizontal resolution and about 2-m vertical accuracy.
Model domain and setup
The model is used in nested form, where the code has the option of switching to either a linear or a non-linear mode. The extent of grids is decided based on the region to be modelled and computational time. Four grids, namely, A, B, C and D, are nested to form an inundation grid (Figure 1). The switch for the grids A, B and C was set to linear mode and D grid to non-linear mode.
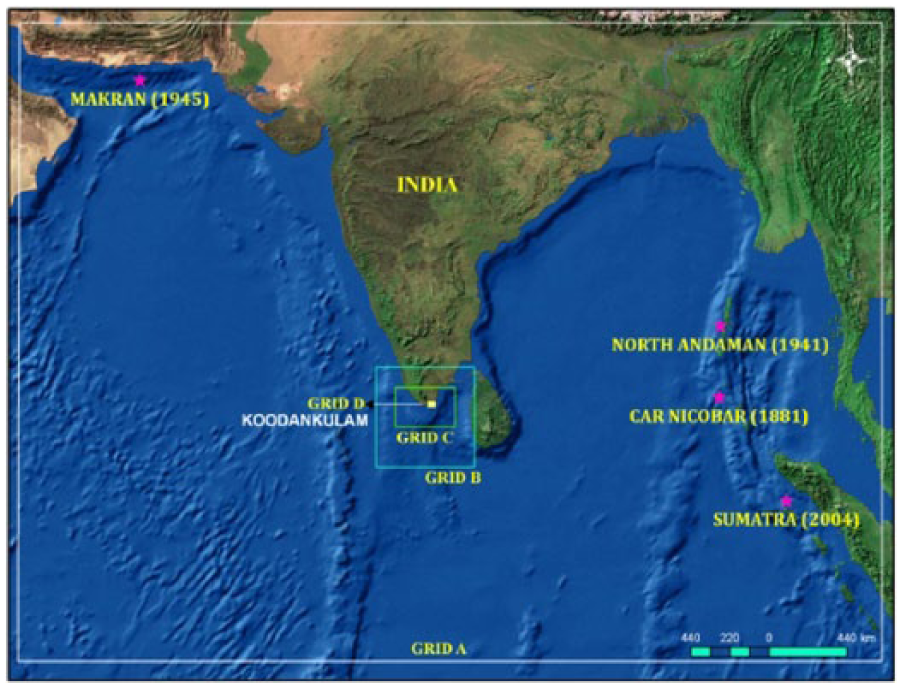
Nested grids used in numerical modelling and grid D represents the study area.
The spacing of the grids for A, B, C and D was decided based on Courant–Friedricks–Lewy (CFL) criteria (numerical stability). The spacing of grids adopted in the model for A, B, C and D is 81′ (2500 m), 27′ (833 m), 9′ (278 m) and 3′ (93 m), respectively. Grids A, B and C were set as linear mode, while grid D was set in a non-linear mode. The non-linear model considers the flooding/drying of land portion and amplification of the wave due to bathymetry.
Sensitivity analysis
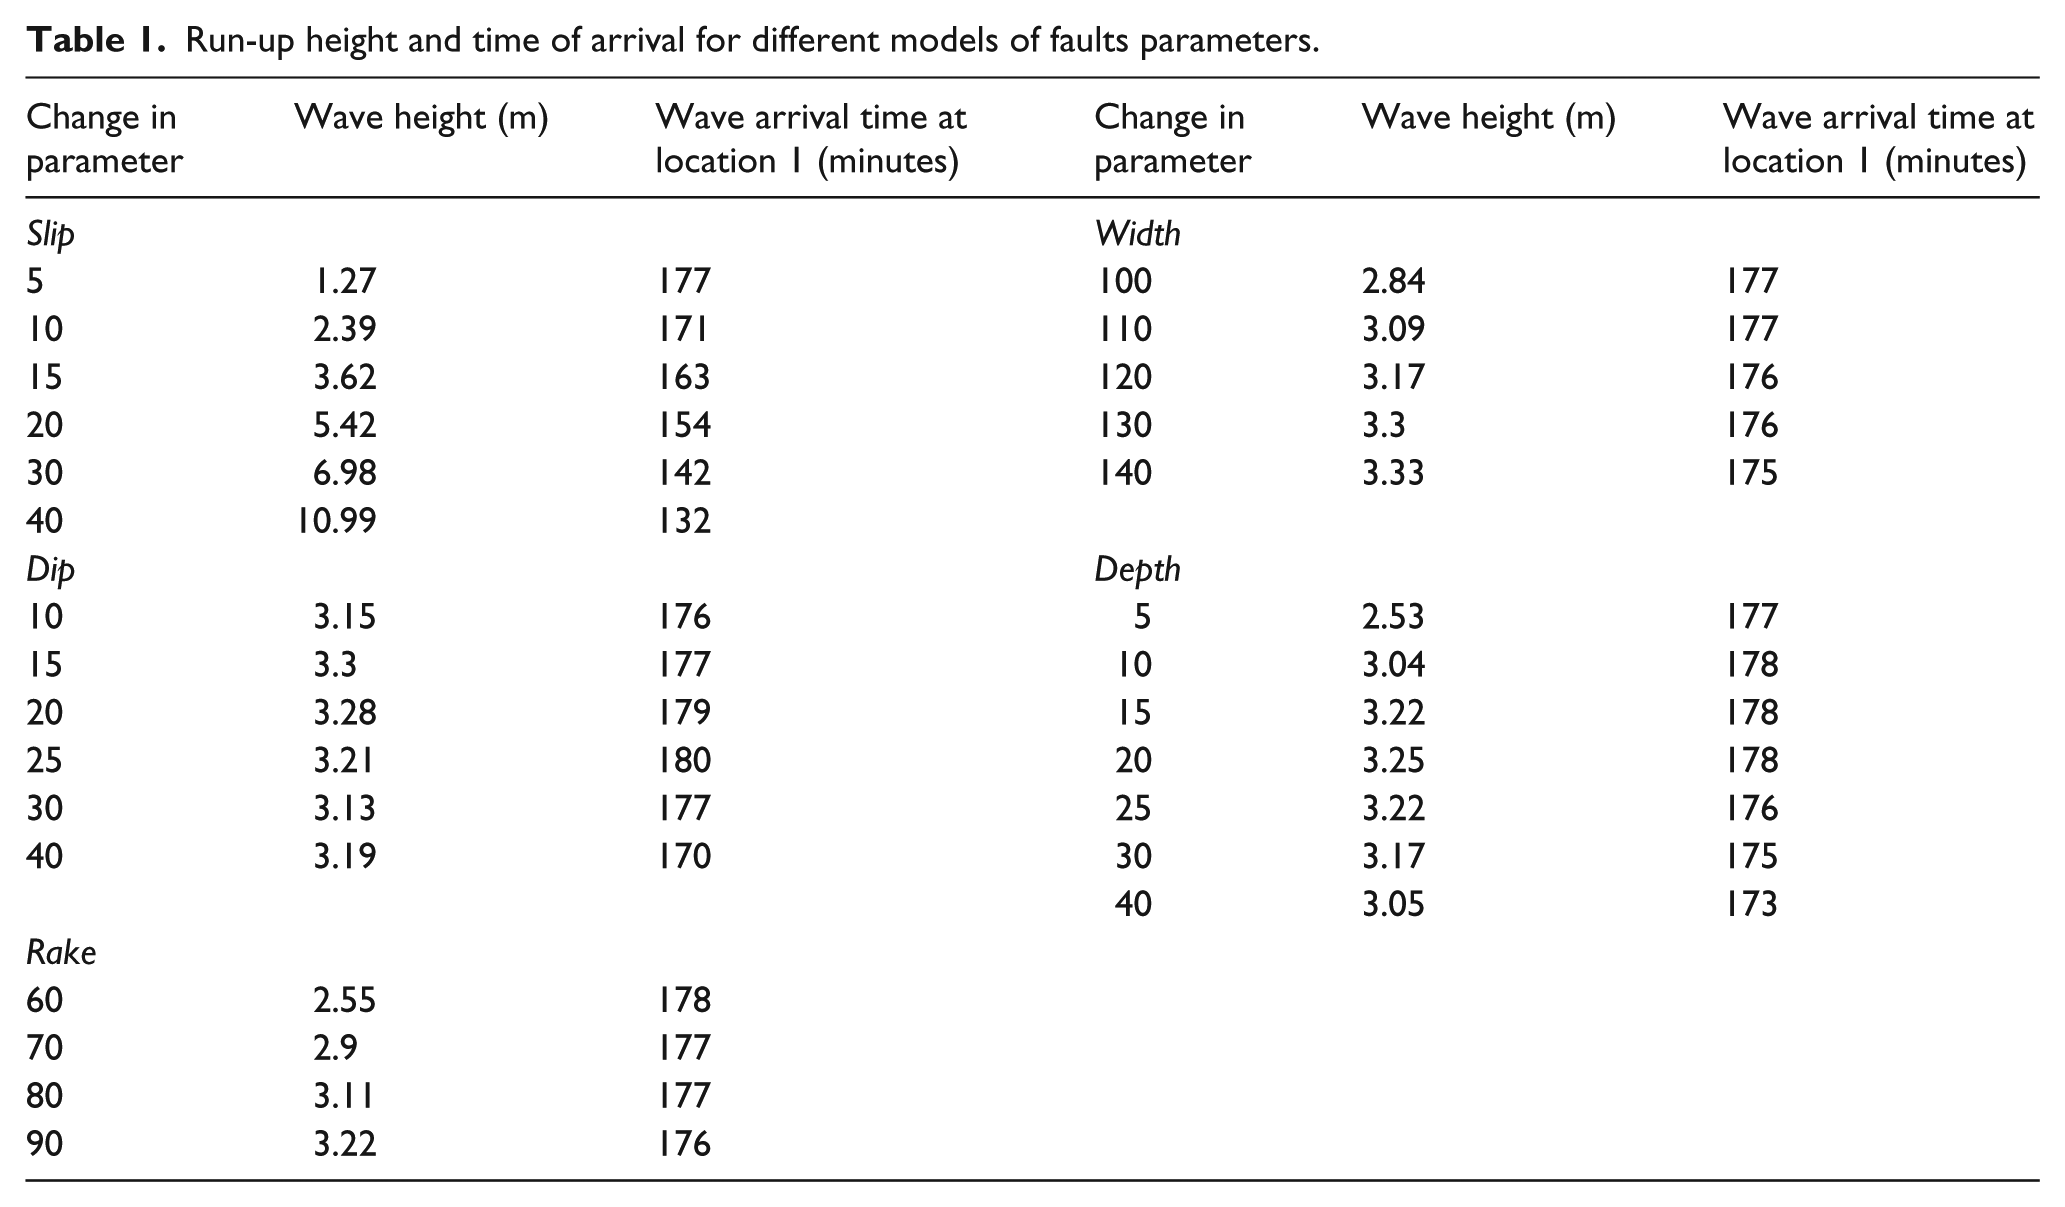
Sumatra epicentre was considered as source location to analyse the sensitivity of the tsunamigenic parameter, and different model scenarios were generated by changing the fault parameters. The tsunamigenic parameters like slip, dip, rake, depth and width are taken into consideration for analysis. The main purpose of the analysis is to understand the impact of different tsunamigenic parameters on the land. The original fault parameters were changed and the model was run to arrive at a decision for possible worst-case scenarios. A total of 28 different model runs were made to assess the sensitivity of each parameter. These run-up heights and inundation were compared at five locations between 30- and 40-m depth along the study from the D grid (Figure 2). Location 1 as highlighted in elliptical circle in Figure 2 was selected to determine the elevation and wave arrival time. The influence of each input parameter on tsunami wave height and tsunami arrival time is presented in Table 1. From the analysis, it was observed that
The wave height and arrival time of tsunami wave were directly proportionate to slip magnitude. If the slip was increased, then wave height and arrival time also increased gradually.
The impacts of dip parameter are analysed by increasing the dip by 5°. From the analysis, it was observed that the tsunami wave height was maximum for 30° dip angle, and finally, the wave height gradually decreased.
It was observed that the tsunami wave height was maximum at a rake angle of 90°.
The width parameter has influence on run-up height and travel time. It was observed that when the fault width increases, the wave height also increases, but the wave arrival time decreases.
Focal depth of earthquake is one of the major parameters which have major impacts on tsunami generation. From the model, it was found that the run-up heights are larger for shallower focal depths of about 10- to 15-km earthquakes than deeper focal depth, that is, 20 or 30 km.
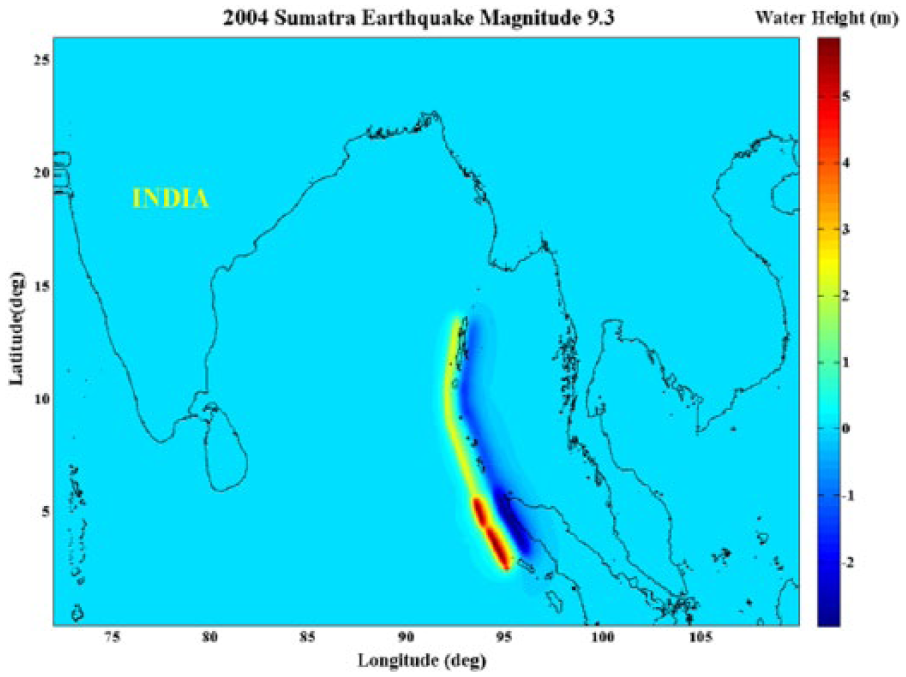
The initial sea surface elevation computed using Mansinha and Smylie theory for 2004 Sumatra.
Run-up height and time of arrival for different models of faults parameters.
Estimation of run-up and inundation along Koodankulam coast
The process of Tsunami modelling can be divided into three different stages such as generation, propagation and run-up (inundation). The generation stage of tsunami evolution includes the formation of initial disturbance of the ocean surface due to the earthquake-triggered deformation of the seafloor. This initial water surface disturbance evolves into a long gravity wave radiating from the earthquake source. Modelling of the initial stage of the tsunami generation is closely linked to studies of earthquake mechanisms. Indian continent is surrounded with subduction zones such as Sumatra Subduction on the eastern side and Makran Subduction in the west. In past, many tsunamis have been generated in these subduction zones. Hence, it is very much necessary to understand the impact on either side as Koodankulam is located in such a way that it can be affected by tsunami waves from either subduction zones. Therefore, five scenarios (three historical incidents, 2004 Sumatra and one worst case) were considered to assess the all possible potential run-up estimations. The basic parameters required for tsunami generation for five different tsunamigenic events are listed in Table 2. These seismic parameters were provided as input to construct the dislocation for determination of the static Tsunami source (initial wave) in the domain. Figure 3 shows the initial sea surface elevation computed using Mansinha and Smylie (1971) for Sumatra parameter.
Details of five different tsunamigenic events used in the model.
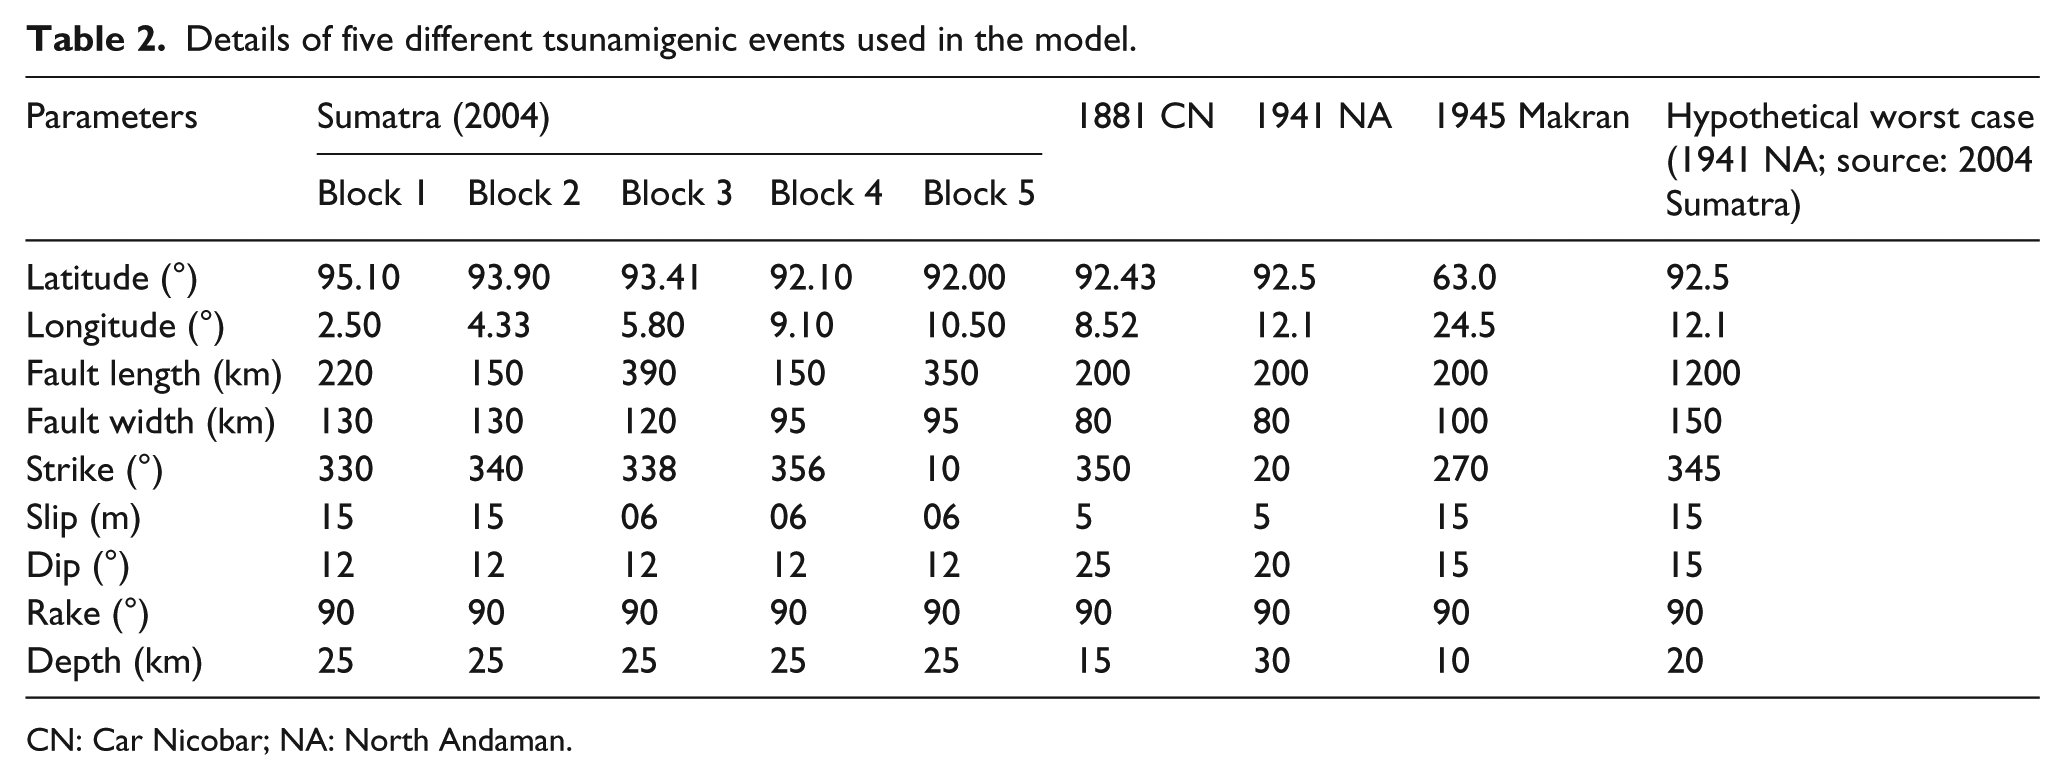
CN: Car Nicobar; NA: North Andaman.
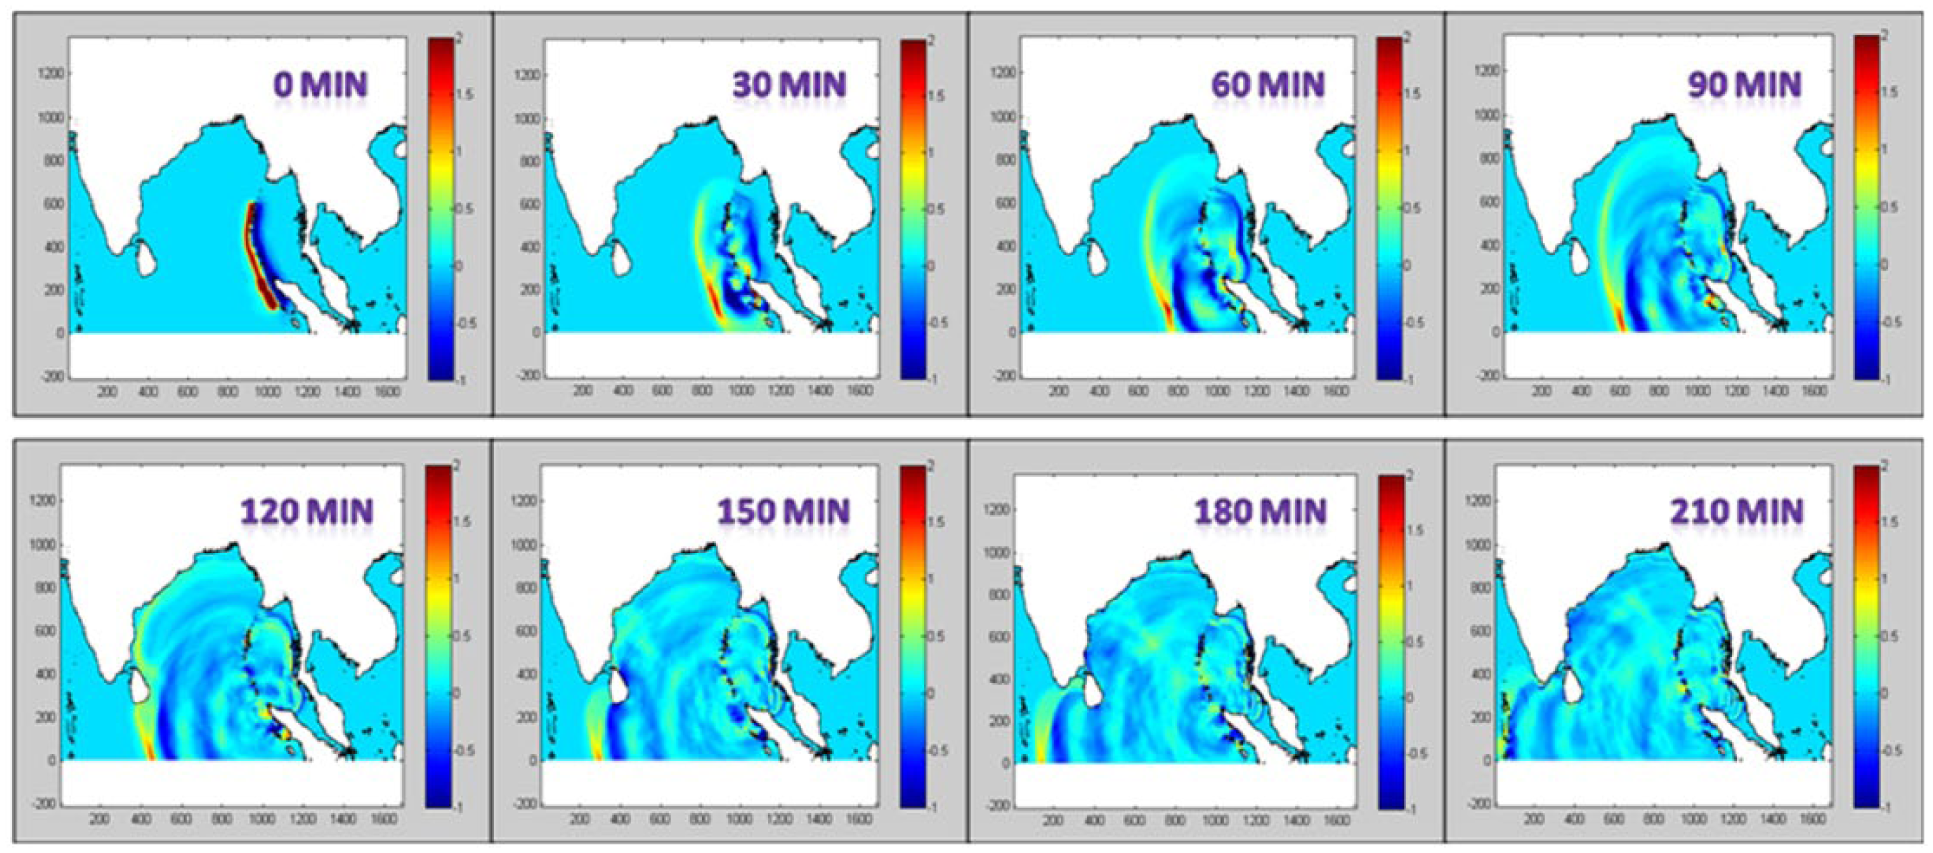
Tsunami propagation at every 30 minutes time steps for 2004 Sumatra.
Tsunamis travel outward in all directions from the generating area, with the direction of the main energy propagation generally being orthogonal to the direction of the earthquake fracture zone. Speed of the waves depends on the depth of water. In the deep and open ocean, they travel at speeds of 500–1000 km/hour (300–600 m/hour). Generally, the distance between the successive crests is 500–650 km. But in open ocean, the wave height is 30–40 cm. Figure 4 shows the tsunami propagation for every 30 minutes step for Sumatra parameter. The tsunami wave propagating from the deep water undergoes a change, and the wave height is increased at the coast due to the nearshore bathymetry and coastal morphology. The run-up of the tsunami on land is the final output of the tsunami model.
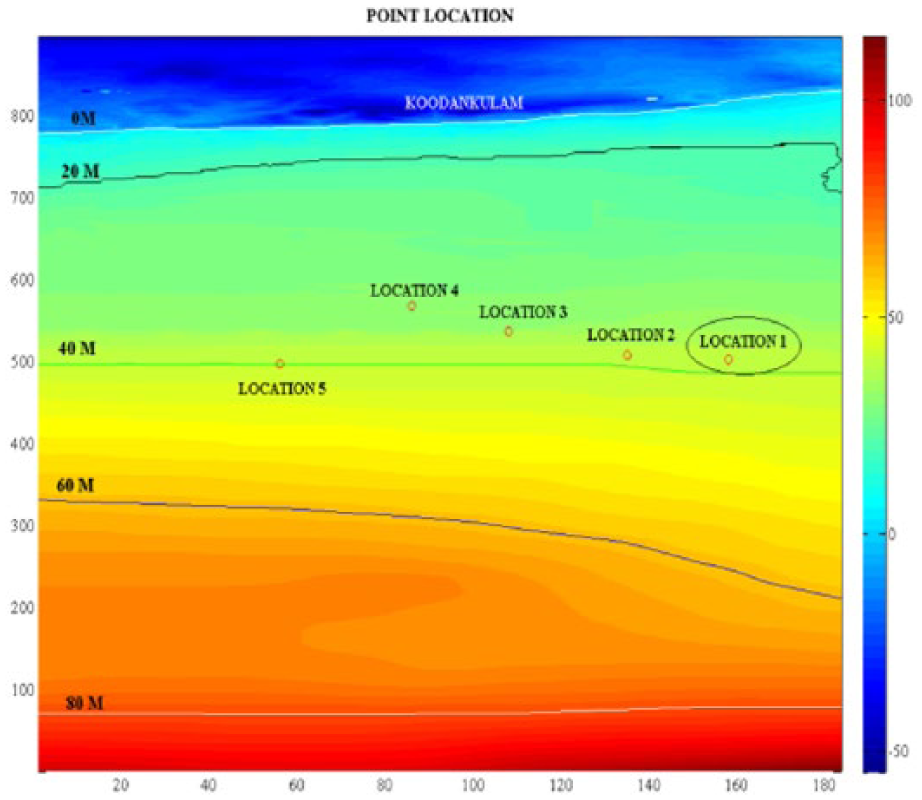
Point location to measure the time arrival and tsunami wave height.
Result and discussion
Run-up height and arrival time of the first tsunami wave were computed at various locations to identify the potential areas likely to inundate along Koodankulam region. Five locations were fixed at 0-m contour along the plant as shown in Figure 5 to explain the inundation. The tsunami wave height (maximum) at Koodankulam due to all source parameters is shown in Table 3, and the inundation limits at five locations are shown in Table 4:
The maximum run-up height was 2.3 m for 26 December 2004 Sumatra scenario. However, the horizontal inundation of 2004 scenario did not have any impacts on the Koodankulam coast.
The run-up height of 1.31 m for North Andaman (1941) scenario was the lowest wave height observed by the model. The horizontal inundation has no impacts on the Koodankulam coast.
1.49 m of run-up was generated by the Car Nicobar (1881) source with no inundation observed by the model.
The maximum wave height and inundation for Makran (1945) source were 2.20 m and less than a grid.
The hypothetical worst-case scenario was generated for North Andaman source. 2004 Sumatra fault parameters are taken as input and the model was generated since the fault parameter obtained by 2004 earthquake was one of the worst parameters in Sumatra Subduction zone. The maximum run-up height obtained due to hypothetical worst-case was 3.54 m and inundation was 90 m at few locations, and at most of the coast, tsunami waves had not reached.
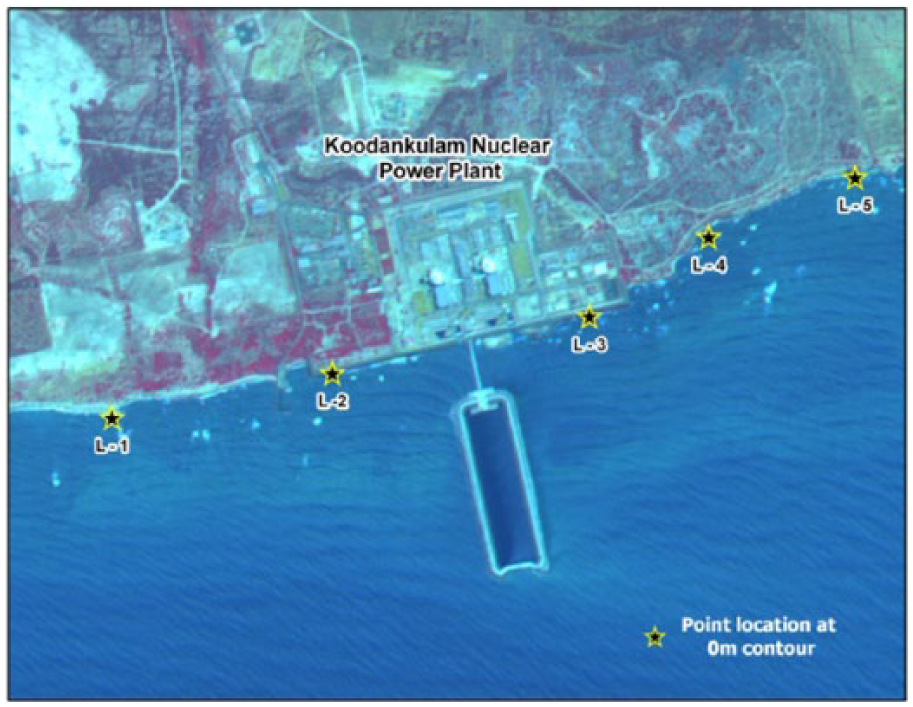
Point location along Koodankulam Nuclear Power Plant to measure the inundation limit.
Tsunami run-up height (maximum) for five different tsunamigenic sources for location 1.
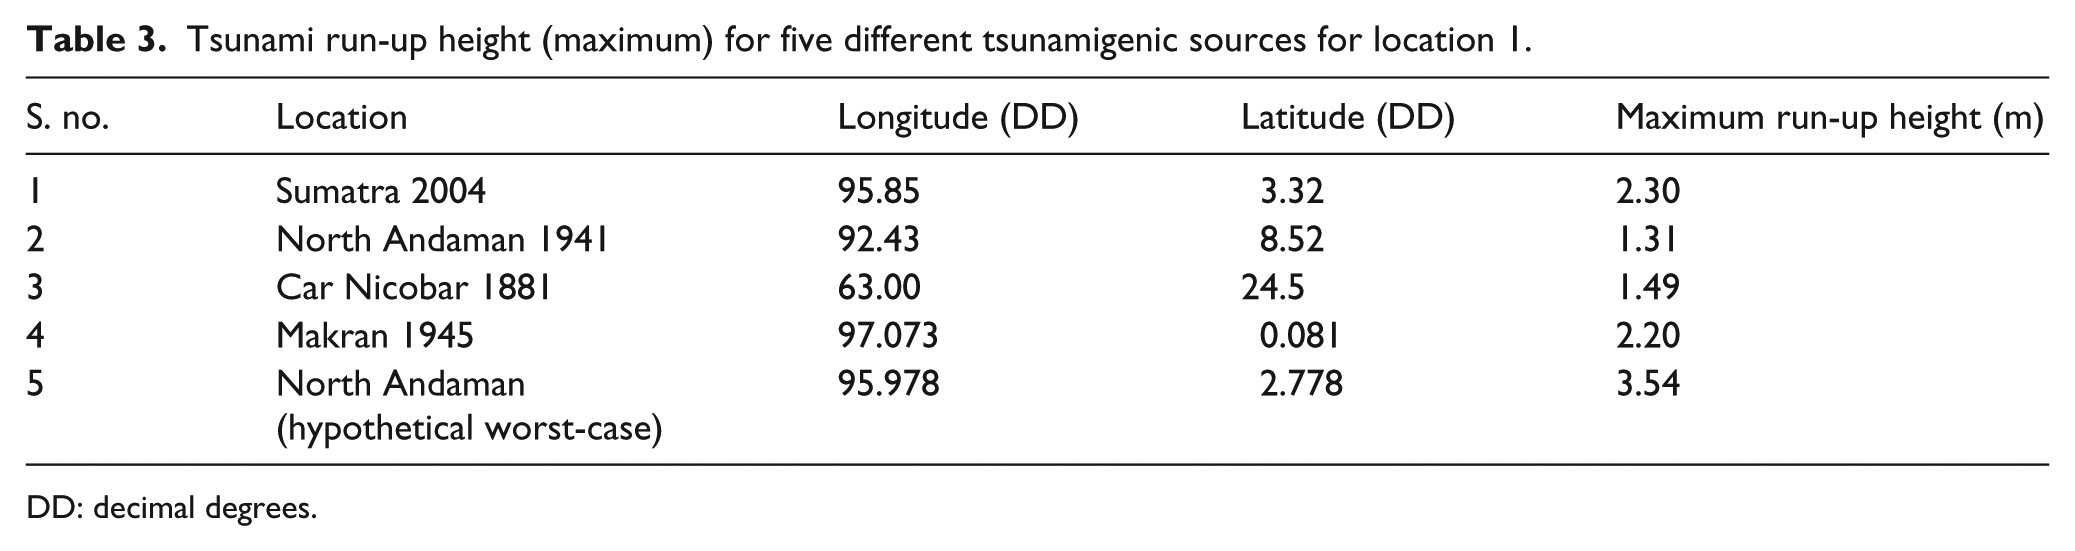
DD: decimal degrees.
Inundation distance (maximum) at five locations (L1–L5).
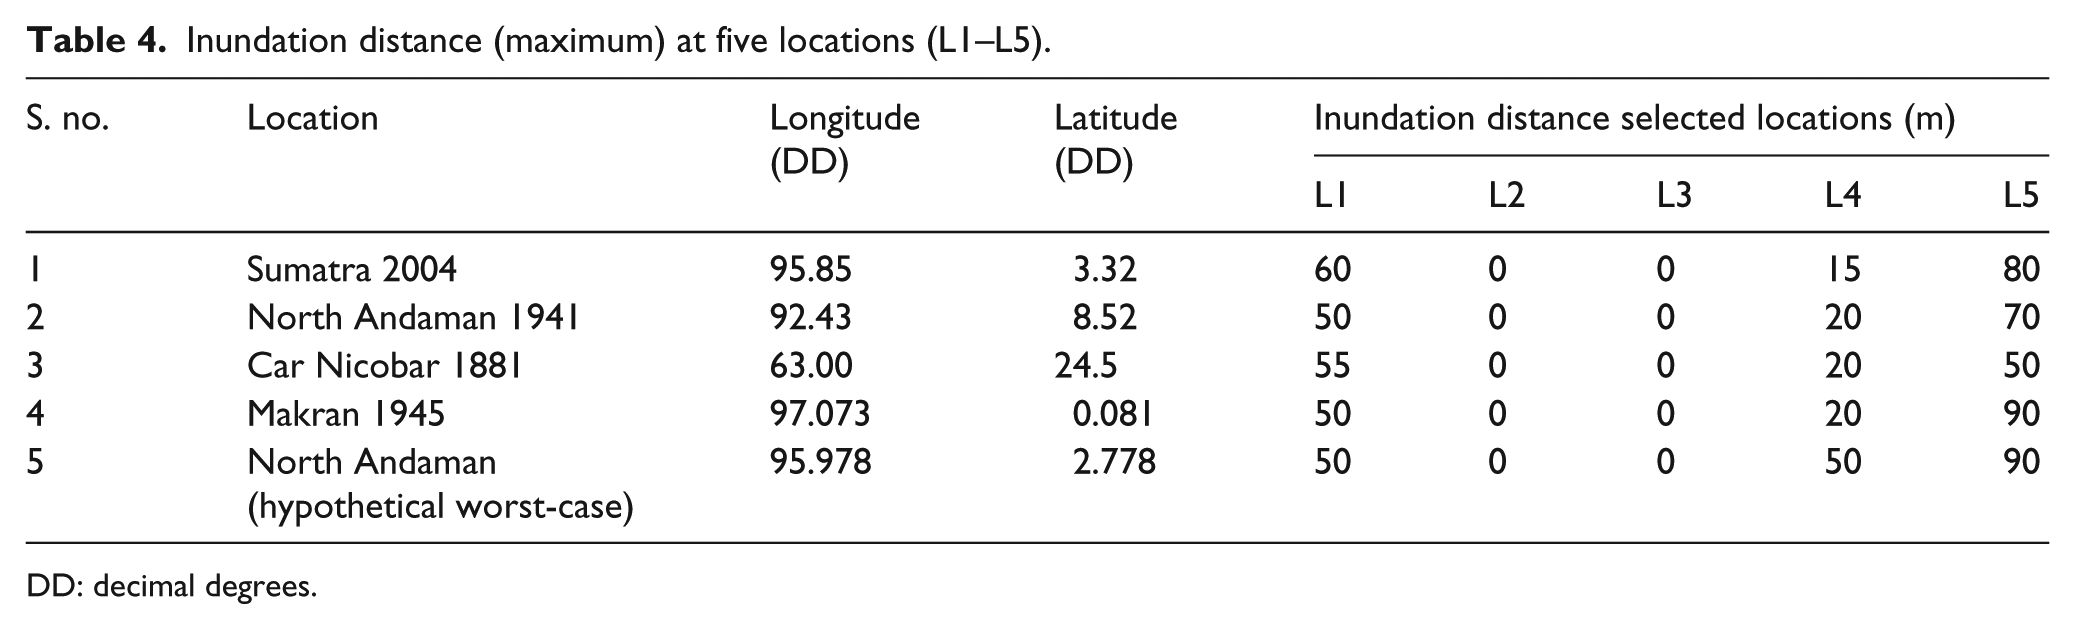
DD: decimal degrees.
Conclusion
Tsunami inundation model ‘TUNAMI-N2’ was applied for Koodankulam Nuclear Power Project to assess the potential risk from various tsunamigenic sources available in Indian Ocean. The model results suggested that the tsunami run-up height was found between 1.3 and 3.54 m and inundation was between 0 and 90 m (1 model grid) near the study area. The study also revealed that the impact of various tsunamigenic sources was very minimal on Koodankulam coast as the topography of the region was elevated and 5-m contour was very near, that is, within 50–70 m to the shoreline. The sensitivity analysis was also carried out to assess the sensitivity of present model to different fault parameters and to construct the worst-case scenario for estimating the potential impact along the coast. It was inferred that the slip amount and focal depth had vital role in generating the maximum tsunami wave height. Other parameters had minimal influence on tsunami generation. After careful analysis of the result, it is advised to consider the tsunami run height of 3.54 m for assessing the total vulnerability of power plant.
Footnotes
Declaration of conflicting interests
The author(s) declared no potential conflicts of interest with respect to the research, authorship and/or publication of this article.
Funding
The author(s) received no financial support for the research, authorship and/or publication of this article.