
Abstract
Probabilistic tsunami hazard and risk analyses are important decision support tools in developing tsunami risk reduction strategies and actions for coastal communities. A stochastic source modeling method facilitates the consideration of uncertainties associated with earthquake rupture processes. However, the computational costs are high when inland tsunami inundation and building damage need to be evaluated accurately. To develop a practical solution by keeping the computational requirements at a manageable level, probabilistic tsunami hazard analysis based on low-resolution tsunami simulations but considering a wide range of possible earthquake ruptures can be used to identify smaller sets of stochastic rupture models for target probability levels. These identified stochastic rupture models can be used to obtain the estimates of tsunami building loss by running high-resolution tsunami inundation simulations. A case study is set up for Tofino, British Columbia, Canada, under the potential tsunami threat from the Cascadia megathrust earthquakes to investigate the correlation between the maximum modeled tsunami wave amplitudes at offshore locations and the tsunami building loss. A practical solution is proposed to obtain the tsunami risk estimates based on a limited number of high-resolution tsunami inundation simulations, thus reducing the computational costs for the probabilistic tsunami risk analysis. The effectiveness of the approach is demonstrated by comparing the median value of the tsunami risk estimates from 20 stochastic rupture model simulations that are selected based on probabilistic tsunami hazard analysis for a representative offshore location using the low-resolution tsunami simulations (i.e. 270 m grids) with the full probabilistic tsunami risk analysis of the target building portfolio based on the 1200 high-resolution tsunami simulations (i.e. 5 m grids).
Introduction
Tsunami hazard and risk assessments for coastal communities in active subduction regions are essential for managing tsunami risks effectively. These assessments should consider uncertainties associated with earthquake sources, wave propagation and inundation, and tsunami damage-loss generation. This essentially necessitates probabilistic tsunami hazard and risk analyses. Conventionally, probabilistic tsunami hazard analysis has been conducted by considering uniform earthquake slip models and has been evaluated at offshore locations by using computational grid resolutions of several hundreds of meters (Horspool et al., 2014; Thio et al., 2007). These approaches were the state-of-the-art, because the probabilistic characterization of earthquake rupture processes was not well advanced at that time and tsunami inundation simulations required high-resolution bathymetry and elevation data at high computational costs.
Recent developments in probabilistic tsunami hazard and risk analyses have addressed the incorporation of numerous earthquake rupture scenarios through a stochastic source modeling approach (Becerra et al., 2020; Griffin et al., 2017; Mueller et al., 2015; Sepúlveda et al., 2019). It provides a method to capture a range of possible tsunamigenic earthquakes that have different geometrical characteristics and heterogeneous slip distributions and thus is useful for quantifying the uncertainty associated with tsunami hazard assessments. The underlying data and models that enabled the stochastic method were statistical scaling relationships of earthquake source parameters based on previous source inversion models (Goda et al., 2016; Melgar and Hayes, 2017) and synthesis of earthquake slip random fields (LeVeque et al., 2016; Mai and Beroza, 2002). Goda and De Risi (2017) extended this approach to probabilistic tsunami loss estimation of buildings in coastal communities and derived the exceedance probability (EP) curve of tsunami loss. This approach is the state-of-the-art in performance-based tsunami engineering, focusing on coastal communities as a whole (Park et al., 2017).
A bottleneck of the new probabilistic approach for regional tsunami risk assessments is the computational cost. To obtain reliable estimates of regional tsunami risk, hundreds to thousands of stochastic tsunami simulations are necessary (Goda and De Risi, 2017). When the focus is limited to offshore locations at relatively shallow depths (e.g. less than 30 m), probabilistic tsunami hazard analysis can be conducted by using computational grid resolutions of several hundred meters. Although such computational costs are not negligible, tsunami simulations can be implemented several hundred to thousand times, because each simulation, depending on various computational requirements, can be run in the time period of minutes to a few hours. On the contrary, when the grid resolutions are refined to less than several meters, as required for accurate inundation modeling, the computational burden increases significantly and each simulation may take a number of days due to shorter time steps required in solving the governing equations (e.g. nonlinear shallow water equations) stably. Therefore, it is essential to optimize the computational cost considering necessary rigor in tsunami hazard and risk assessments. It is noted that tsunami risk assessments for buildings are grossly inaccurate when the coarse grids are adopted, because the elevation data cannot represent the detailed features of local topography accurately. From tsunami risk management perspectives, critical scenarios that are considered for tsunami evacuation and land use planning are often determined based on a relatively small number of tsunami source scenarios. Typically, such scenarios are first selected from historical tsunami events or based on low-resolution tsunami hazard analyses (usually focusing upon offshore locations), and then more detailed inundation calculations are carried out for these specific scenarios only.
This study investigates the correlation between tsunami hazard parameters and tsunami building loss and examines the correspondence between hazard-based and risk-based rankings of stochastic rupture scenarios in the context of probabilistic tsunami hazard and risk analyses. This is important because if the correlation between tsunami hazard parameter and tsunami building loss is strong, tsunami simulation results using crude grid resolutions can be used as a substitute for those using refined grid resolutions. The correlation allows us to constrain the range of tsunami risk estimates based on more computationally amenable tsunami hazard estimates at an offshore location by considering a comprehensive set of earthquake rupture scenarios. Quantifying this correlation facilitates practical risk management decisions associated with tsunami loss and insurance. To tackle this problem, we present a case study for Tofino, British Columbia, which faces the Pacific on Vancouver Island and is under the potential threat from the Cascadia megathrust earthquakes in the Pacific Northwest. The Cascadia subduction zone can host megathrust subduction earthquakes with possible moment magnitudes (M) up to 9.3 and the most recent event occurred in 1700 (Satake et al., 2003). Geological and geophysical studies on the Cascadia subduction zone indicate that this subduction zone is accumulating strain toward a future megathrust earthquake (Walton et al., 2021). Recently, Goda (2022) has developed stochastic source models for the Cascadia megathrust earthquakes (in total, 5000 models having the magnitudes between M8.1 and M9.1) by combining the most up-to-date subduction interface geometry (Hayes et al., 2018) and key source characteristics that have been inferred based on geological and geophysical results in Cascadia (Gao et al., 2018; Goldfinger et al., 2012; Leonard et al., 2010). In Tofino, due to the imminent threat posed by the future Cascadia megathrust earthquakes, various data have been gathered, including high-resolution local bathymetry data, LiDAR-based elevation data, and building data (e.g. structural materials, occupancies, and economic values). We utilize these unique sets of available data to estimate the possible tsunami risks for buildings in Tofino subjected to 1200 stochastic source scenarios that have magnitudes between M8.7 and M9.1 (300 models per 0.1 magnitude bin). For these purposes, tsunami simulations are conducted using two different grid resolutions; the coarse case considers 270-m grids that cover the entire Vancouver Island (required time stepping interval of 1.0 s), whereas the refined case considers 5-m grids that cover the vicinity of Tofino (required time stepping interval of 0.05 s). Using the latter results, detailed tsunami inundation profiles and water depths at individual buildings in Tofino can be evaluated, and thus possible tsunami damage and loss to these buildings can be estimated more accurately by applying tsunami fragility functions (De Risi et al., 2017). This work eventually compares the maximum modeled tsunami wave amplitudes that are computed at 270 and 5-m grids with the estimated tsunami building loss in Tofino by considering a wide range of stochastic rupture scenarios. Note that this study does not assess seismic shaking risk to the buildings in Tofino, which can be very significant, because as long as empirical ground motion models are used for seismic intensity simulations, the computational issues, which are described above for tsunami risk assessments, are not applicable.
Cascadia megathrust tsunami risk model for Tofino
Cascadia megathrust earthquakes
The Cascadia subduction zone is one of the major sources of the seismic and tsunami hazard for the Pacific coast of British Columbia, Canada. The Cascadia subduction zone involves the eastward subduction of the Juan de Fuca, Gorda, and Explorer Plates beneath the North American Plate (DeMets et al., 2010; see Figure 1). The future occurrence of an M9-class megathrust earthquake in Cascadia is a major concern for coastal municipalities and communities on Vancouver Island. To develop effective tsunami risk mitigation measures, accurate performance assessments of buildings and infrastructures under catastrophic tsunami threat are necessary.
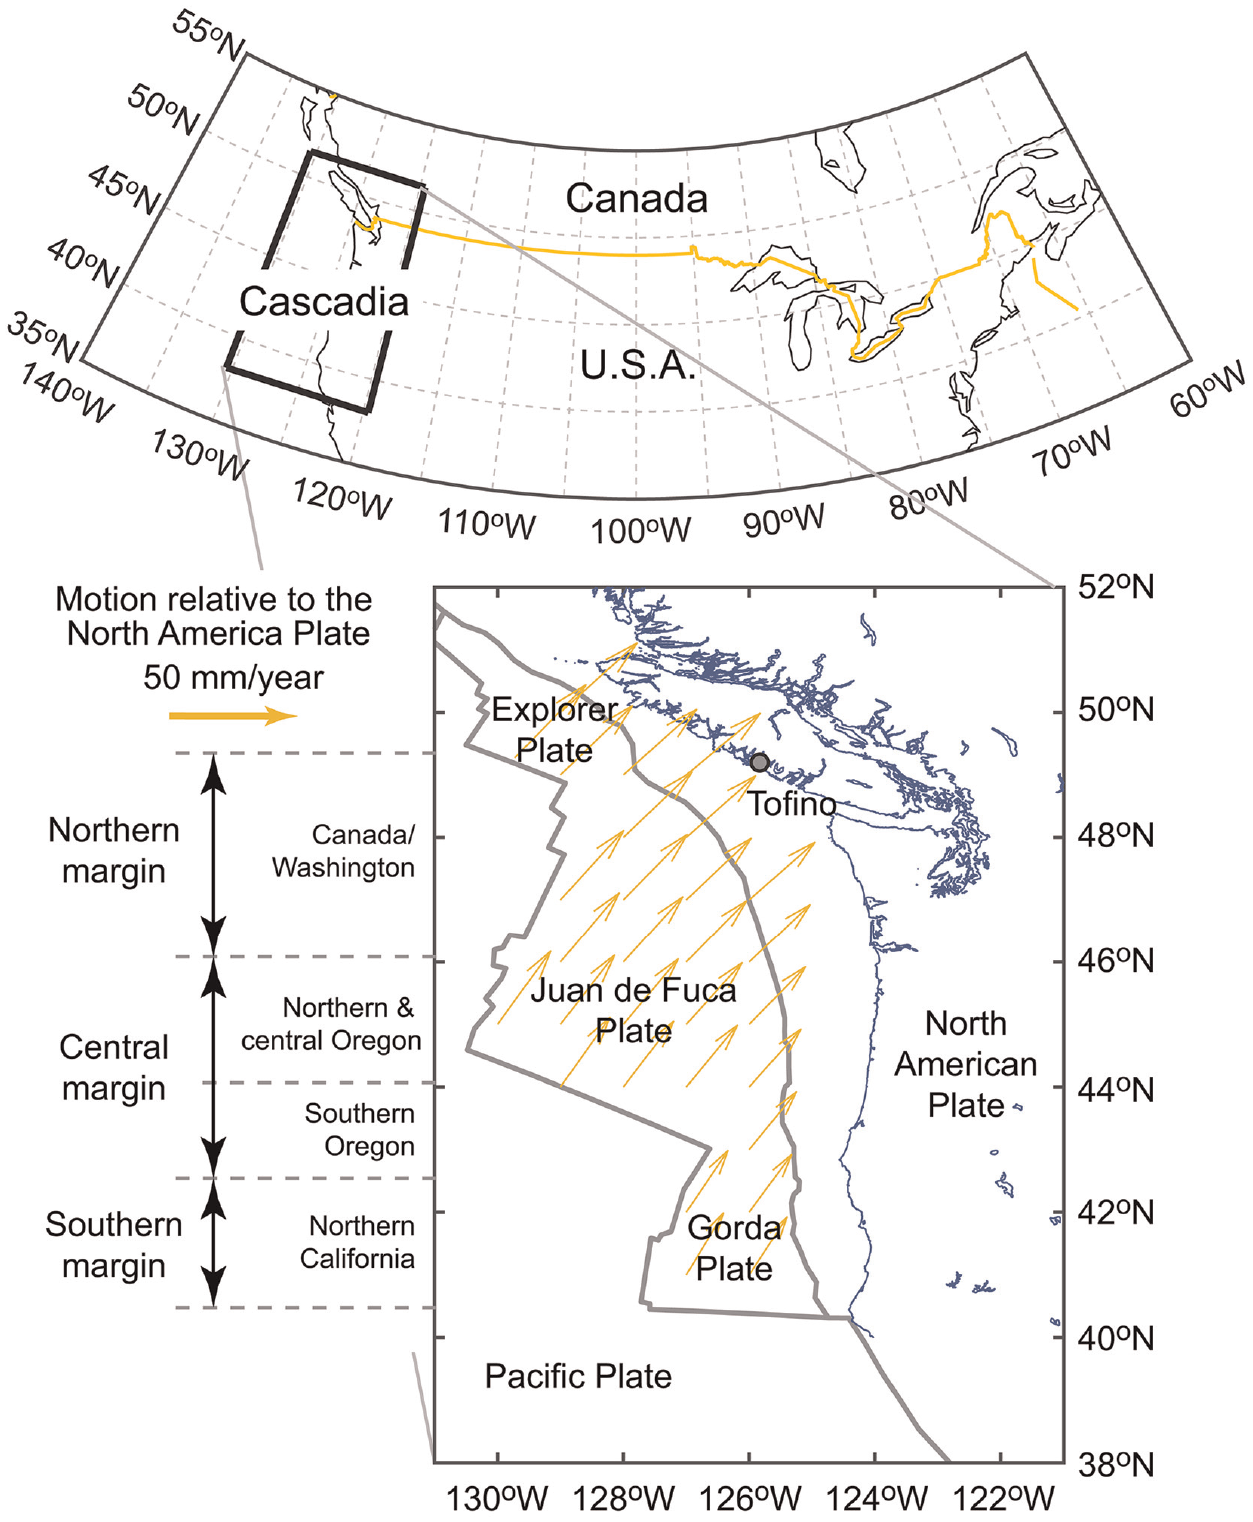
Tectonic plates surrounding the Cascadia subduction zone.
The earthquake rupture characterization of the Cascadia events has evolved over the last three decades (Walton et al., 2021). Early models of the subduction zone were constrained by geodetic deformation data and thermal models (Wang et al., 2003) and by seismic reflection/refraction data and deep seismicity data (McCrory et al., 2012). Moreover, numerous geological and geophysical evidence has been collected to constrain rupture patterns of the past Cascadia earthquakes, including onshore subsidence records (Leonard et al., 2010) and offshore marine turbidites (Goldfinger et al., 2012). The Slab2 model includes the most up-to-date fault interface geometry for the Cascadia subduction zone (Hayes et al., 2018).
Many studies have been conducted to assess the tsunami hazard along the Canadian coast due to the Cascadia megathrust earthquakes (AECOM, 2013; Cherniawsky et al., 2007; Gao et al., 2018; Stephenson and Rabinovich, 2009; Takabatake et al., 2019). The existing tsunami hazard studies for Canada lack the consideration of a variety of earthquake rupture scenarios that reflect the current understanding of the potential Cascadia megathrust behavior. The use of a limited set of simplified earthquake sources in tsunami hazard assessments could result in the underestimation of future tsunami hazards (Melgar et al., 2019) and is unable to capture the uncertainty associated with tsunami hazard and risk assessments, which are critical in developing emergency response plans for coastal municipalities and communities. To address this issue, Goda (2022) developed stochastic source models by considering different rupture patterns and magnitudes (e.g. a range of full-margin rupture versus southern-/central-margin ruptures; see Figure 1).
Cascadia megathrust stochastic tsunami inundation simulations for Tofino
To consider a wide range of possible earthquake rupture scenarios and patterns for the Cascadia megathrust earthquakes and to quantify the uncertainty of tsunami hazard and risk estimates for the Canadian coast, stochastic tsunami inundation simulations are conducted. For this purpose, 1200 stochastic rupture models equivalent to earthquake magnitudes between 8.7 and 9.1 are adopted from the study by Goda (2022). The stochastic tsunami inundation simulations involve a sequence of modeling and numerical analyses: (1) selection of a fault plane model, (2) use of statistical scaling relationships for earthquake source parameters, (3) random earthquake slip generation, (4) ground displacement estimation, and (5) tsunami inundation simulation. In this section, we describe the key features of the stochastic rupture models for the Cascadia megathrust earthquakes. Full details of the source models can be found in the study by Goda (2022). Figure 2 illustrates the main computational steps of stochastic tsunami hazard simulations for the Cascadia megathrust earthquakes.
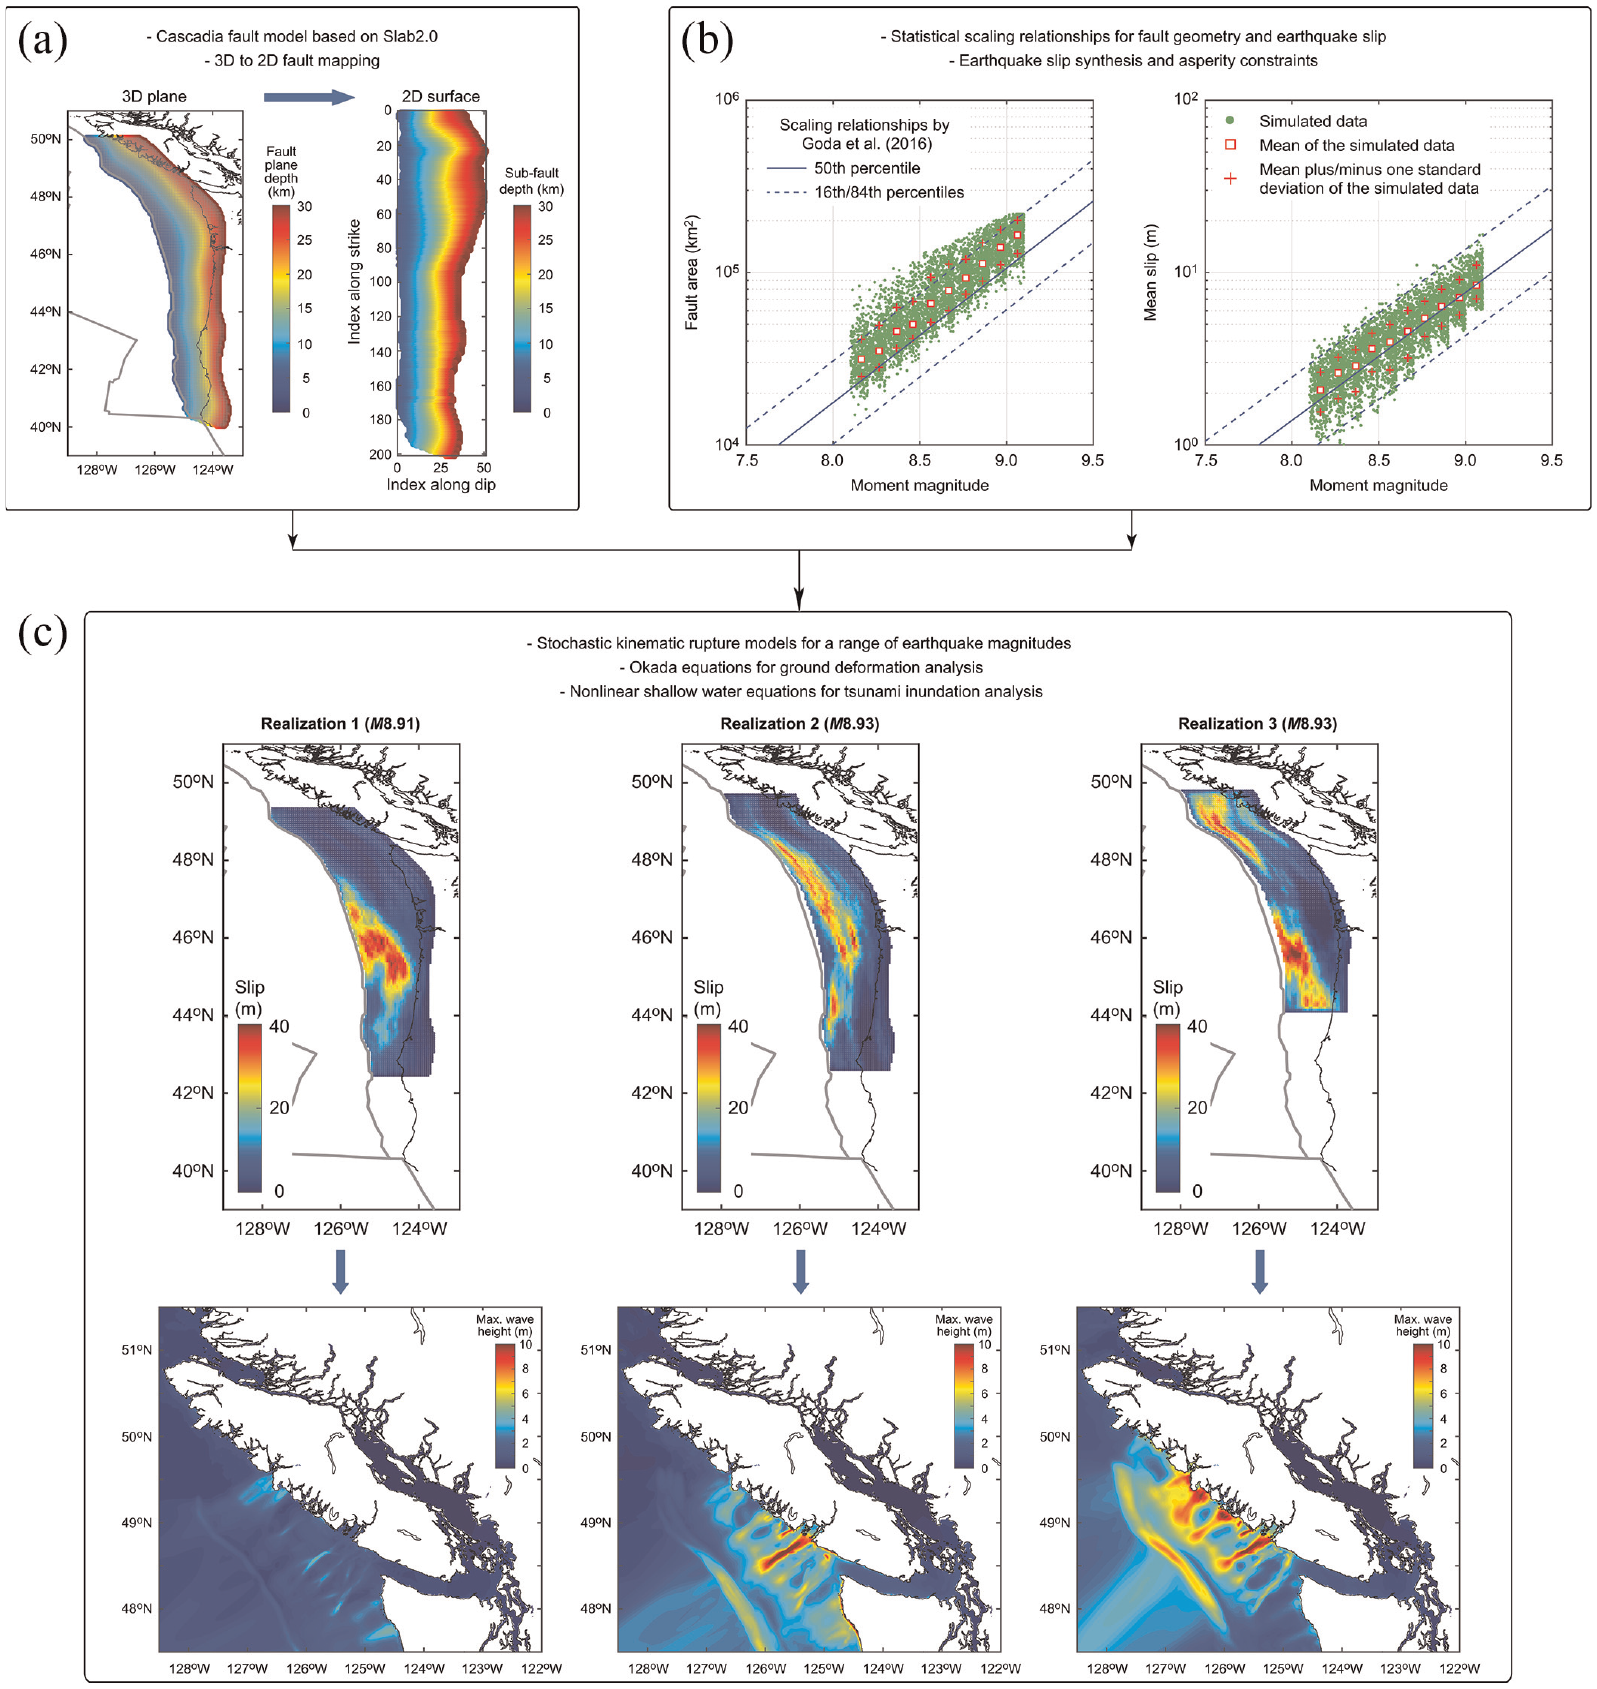
Stochastic tsunami simulations for the Cascadia megathrust earthquakes: (a) fault model, (b) scaling relationships for earthquake source parameters, and (c) stochastic rupture model and tsunami simulations.
The fault plane geometry for the Cascadia megathrust earthquakes is based on the Slab2 model (Hayes et al., 2018). The Slab2 model represents a complex curved feature of the Cascadia megathrust interface with variable strike and dip angles. This fault plane is approximated by a set of 7452 sub-faults that reach depths of 30 km (see Figure 2a). Each sub-fault has the size of 5.6 km along strike and 3.8 km along the dip direction. Because the stochastic source modeling method primarily works with a rectangular two-dimensional (2D) surface, the irregular three-dimensional (3D) sub-faults are mapped to a larger number of 2D sub-fault cells. The overall 2D fault plane is represented by 201 × 51 sub-fault cells. Since some portions of the 2D sub-faults are not associated with the 3D sub-faults, these unmatched sub-faults are masked when generating 2D stochastic source models. This mapping process is illustrated in Figure 2a.
To synthesize the earthquake slip distribution over the 2D sub-faults, a scenario magnitude is specified within a 0.1 magnitude bin (Goda, 2022), and the magnitude value is simulated from the uniform distribution (e.g. sampling a value between M8.9 and M9.0). Given this magnitude value, eight earthquake source parameters, that is, fault length L, fault width W, mean slip Da, maximum slip Dm, Box-Cox parameter λBC, along-strike correlation length CLL, along-dip correlation length CLW, and Hurst number H, are sampled from the statistical scaling relationships by Goda et al. (2016). These parameters are represented by the multivariate lognormal distribution with a correlation structure. In this step, several checks of the sampled source parameters are carried out by ensuring that the ratios of correlation lengths to fault dimensions are consistent with empirical ranges of 0.15–0.6 for the strike direction and 0.15–0.45 for the dip direction. Eventually, the simulated values of L, W, and Da must fall within the target magnitude range. Figure 2b shows the simulated fault area (i.e. L×W) and mean slip Da for 5000 stochastic source models having earthquake magnitudes between M8.1 and M9.1 (Goda, 2022). Once a suitable fault geometry is determined, the fault plane is placed randomly within the overall fault plane of the 201-by-51 rectangular matrix.
For a given fault plane geometry, a heterogeneous earthquake slip distribution is synthesized. A candidate slip distribution is first simulated from an anisotropic 2D von Kármán wavenumber spectrum with its amplitude spectrum being parametrized by along-strike correlation length CLL, along-dip correlation length CLW, and Hurst number H and its phase being randomly distributed between 0 and 2π (Mai and Beroza, 2002). The simulated slip distribution is modified via Box-Cox power transformation to achieve a desirable right-skewed feature of the marginal slip distribution (Goda et al., 2016). At this stage, the edge tapers are implemented on the northern, southern, and eastern boundaries of the stochastic earthquake source models to avoid abrupt changes of the earthquake slip values near the along-dip edges of the fault model. Subsequently, slip values of the sub-faults that are within the masked sub-faults are set to zero, and all eligible slip values are scaled to match the mean slip. To ensure that the simulated earthquake slip distribution has realistic characteristics for the target Cascadia megathrust earthquakes, several constraints on the simulated slip distribution are implemented. For instance, an asperity zone (i.e. earthquake slip concentration within the specified area of the fault plane) is defined by reflecting different rupture patterns (i.e. southern-, central-, and full-margin ruptures; see Figure 1) identified in the paleo-seismic data by Goldfinger et al. (2012). Major asperities are also constrained to occur in the shallow part of the subduction interface to broadly coincide with the outer wedge of the accretionary prism (Watt and Brothers, 2021). If the candidate slip distribution does not meet all criteria, this realization is discarded, and another earthquake rupture model is generated. This process is repeated until an acceptable model is obtained.
Finally, by repeating the above-mentioned procedure for earthquake rupture modeling 500 times for each of the 10 magnitude bins between M8.1 and M9.1, a set of 5000 earthquake rupture models was generated (Goda, 2022). Among these stochastic rupture models, 1200 models with earthquake magnitudes between M8.7 and M9.1 (300 models per 0.1 magnitude bin) are used in this study. Only the full-margin rupture pattern is considered because the southern-margin and central-margin rupture patterns generate significantly smaller tsunamis along the Canadian coast due to the directivity effects of the generated waves. The full-margin rupture cases permit the earthquake slip to be concentrated across all three major segments (i.e. southern, central, and northern; see Figure 1). More details can be found in the study by Goda (2022). Three realizations of the M8.9–M9.0 scenario are shown in Figure 2c. Different stochastic rupture models can exhibit variations in fault plane geometry, position within the overall megathrust fault plane of the Cascadia subduction zone, and earthquake slip distribution.
To effectively perform numerous tsunami simulations for different spatial domains and at specified spatial resolutions, various bathymetry and elevation data are merged to develop nesting grid data sets. Deep water bathymetry data are collected from the 2021 GEBCO (General Bathymetric Chart of the Oceans) data set (≈ 450 m resolution), while shallow water bathymetry data around Vancouver Island are obtained from the CHS (Canadian Hydrographic Service) data set (10 m resolution). For land areas, the CDEM (Canadian Digital Elevation Model) data (≈ 20 m resolution) are used. For the District of Tofino, local bathymetry and elevation data, that is, 1 m bathymetry data in the Templar Channel and 0.5 m LiDAR-derived topographic contours, are available. These high-resolution data are critical for running accurate tsunami inundation simulations. The merged bathymetry-elevation data are then arranged into nested grid systems that are shown in Figure 3. Because the tsunami simulations are run in Cartesian coordinates (Goto et al., 1997), all grids are specified in terms of UTM (Universal Transverse Mercator). The largest grid system has a resolution of 810 m, covering the entire Pacific Northwest, and the smallest grid system has a resolution of 5 m, covering Tofino. The vertical reference datum is at the mean sea level. The local high tide variation can be plus 2.0 m or more.
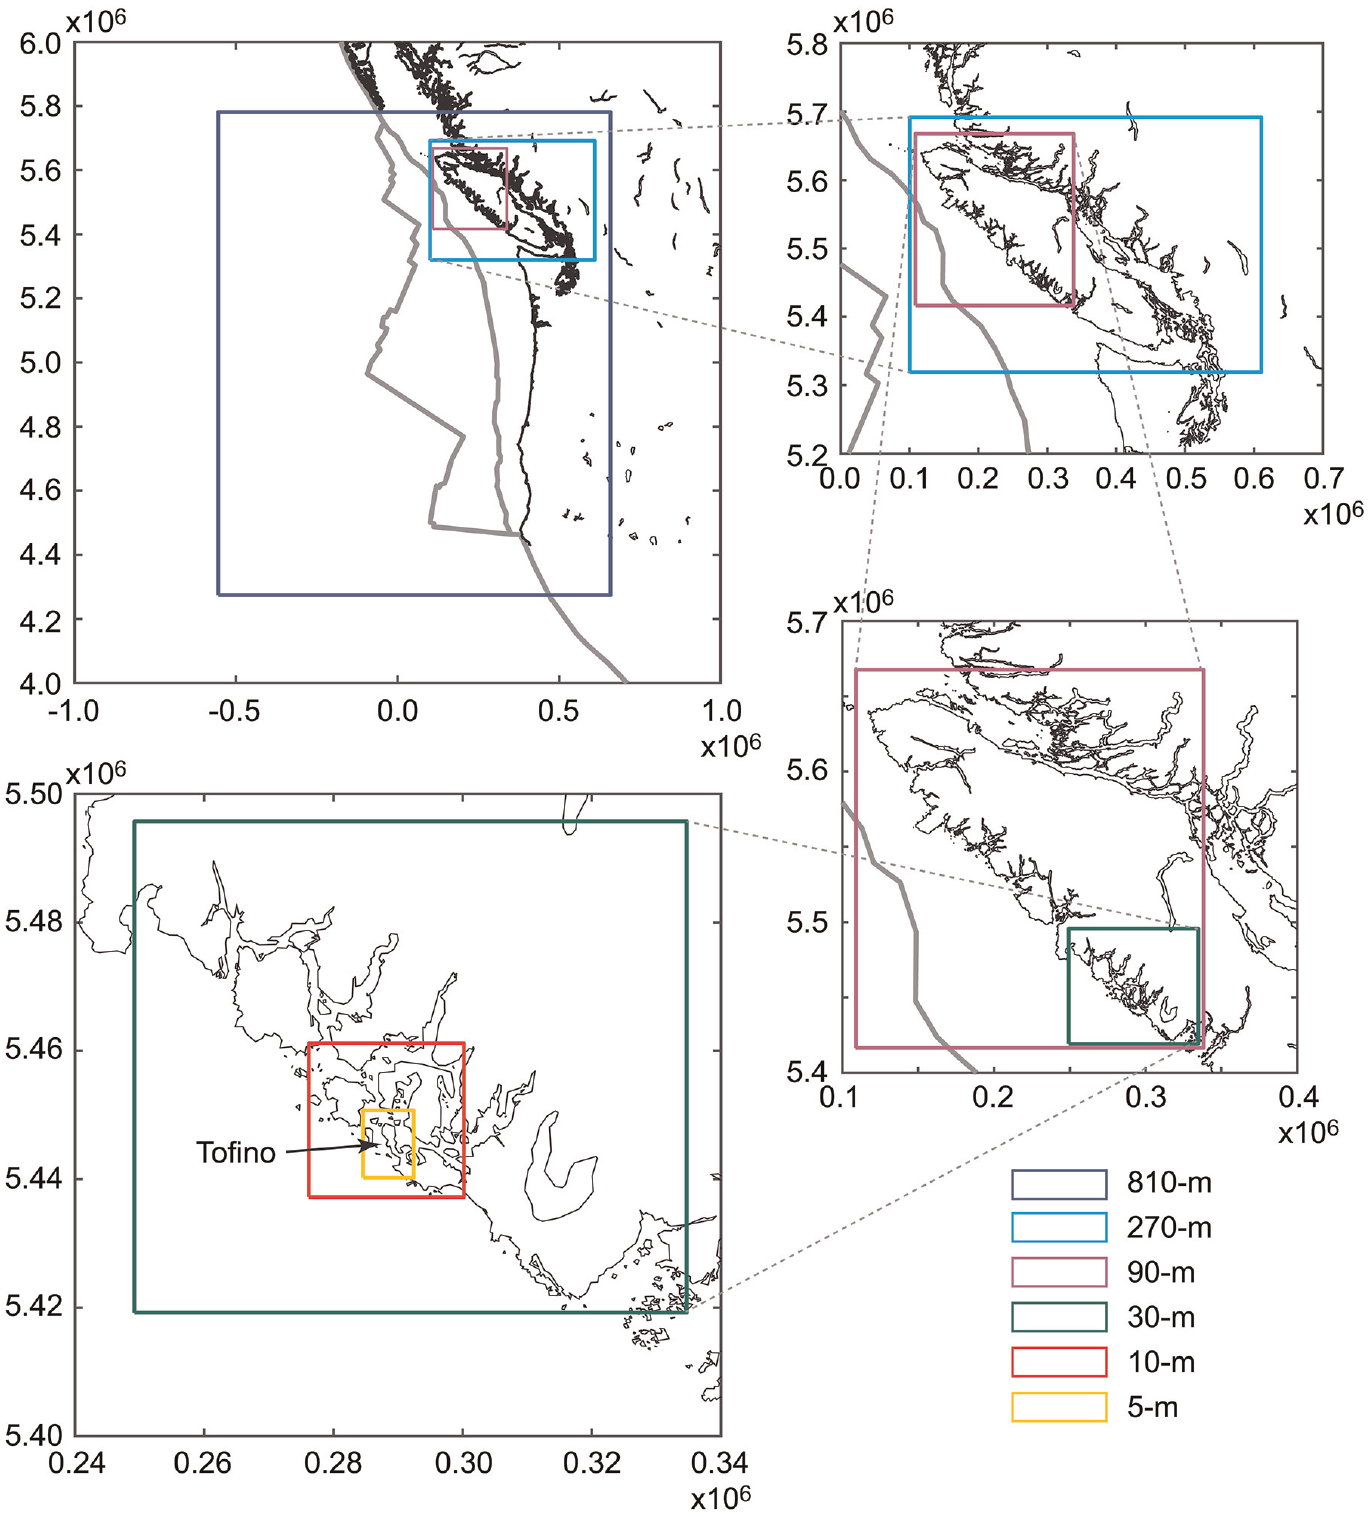
Grids for tsunami simulations (810, 270, 90, 30, 10, and 5 m resolution).
For a given earthquake rupture model, the vertical dislocation profile of seawater due to an earthquake rupture is computed using Okada (1985) equations, evaluated at 810 m grid resolution. To account for the effects of horizontal movements of seafloor slopes on the vertical dislocation of seawater, a method proposed by Tanioka and Satake (1996) is implemented, which is important for the ground deformation of the outer wedge that has greater slope angles than other parts of the bathymetry in the Cascadia subduction zone. To alleviate the abrupt changes of the vertical dislocation of seawater, a spatial smoothing filter of 9-by-9 cells is employed.
The tsunami modeling is carried out using a well-tested TUNAMI code (Goto et al., 1997) that solves the nonlinear shallow water equations using a leap-frog staggered-grid finite difference scheme and is capable of generating offshore tsunami propagation and onshore run-up. For all computational cells, the bottom friction and surface roughness are represented by a uniform value of Manning’s coefficient equal to 0.025s/m1/3, which is often used for agricultural land and ocean/water (Japan Society of Civil Engineers (JSCE), 2002). The run-up calculation is based on a moving boundary approach (JSCE, 2002), where a dry/wet condition of a computational cell is determined based on total water depth relative to its elevation. Moreover, the effects of coseismic ground deformation are considered by adjusting the elevation data prior to the tsunami simulation run. Illustrations of three regional tsunami simulations of the M8.9–M9.0 scenario are shown in Figure 2c, exhibiting the significant effects of the earthquake rupture characteristics on the generated tsunami waves. Each tsunami simulation is performed for a 3 h, duration which is sufficient to model the most critical phase of tsunami waves for the Cascadia tsunami scenarios. To investigate the correlation between the tsunami hazard and risk parameters, two grid resolutions are considered. For near-shore locations, the grid resolution of 270 m is suitable, resulting in the required time-stepping interval of 1.0 s to satisfy the Courant–Friedrichs–Lewy condition. On the contrary, to evaluate tsunami loss to buildings in Tofino, the grid resolution of 5 m is necessary, and this results in a significantly shorter time-stepping interval of 0.05 s. Two sets of tsunami inundation simulations by considering the 270 m grids and the 5 m grids are carried out for the 1200 stochastic rupture models of the Cascadia full-margin scenarios (M8.7 to M9.1).
Building exposure and vulnerability models for Tofino
Tofino is located at the tip of Esowista Peninsula and is exposed to the Pacific to its west. To carry out earthquake-tsunami and coastal hazard and risk assessments for its coastal communities (residents and visitors), the District of Tofino developed a comprehensive inventory of buildings (e.g. residential, commercial, industrial, and civic), cultural/historical sites, water sanitation facilities, potential environmental contamination sites, and infrastructures (roads and power lines). In particular, the District of Tofino commissioned Nanometrics to develop a complete building inventory for Tofino by inspecting individual properties on site and by recording key structural features of the buildings (e.g. material, number of stories, basement, and occupancy). These available data are used in developing a high-quality tsunami risk model for Tofino.
A map of Tofino is shown in Figure 4a. In the map, building locations and roads are included, and the background contours show the bathymetry-elevation data gathered by the District of Tofino. Most buildings in Tofino Town are at relatively high elevations (typically above 10 m) and are protected from the direct tsunami waves (see Figure 4a). This topographical factor is crucial in reducing the tsunami exposure of Tofino Town. On the contrary, buildings in beach areas (Mackenzie Beach, Chesterman Beach, and Cox Bay) face the Pacific Ocean directly and are at low elevations (less than 10 m). Consequently, these areas are exposed to significant tsunami hazards (Takabatake et al., 2019).
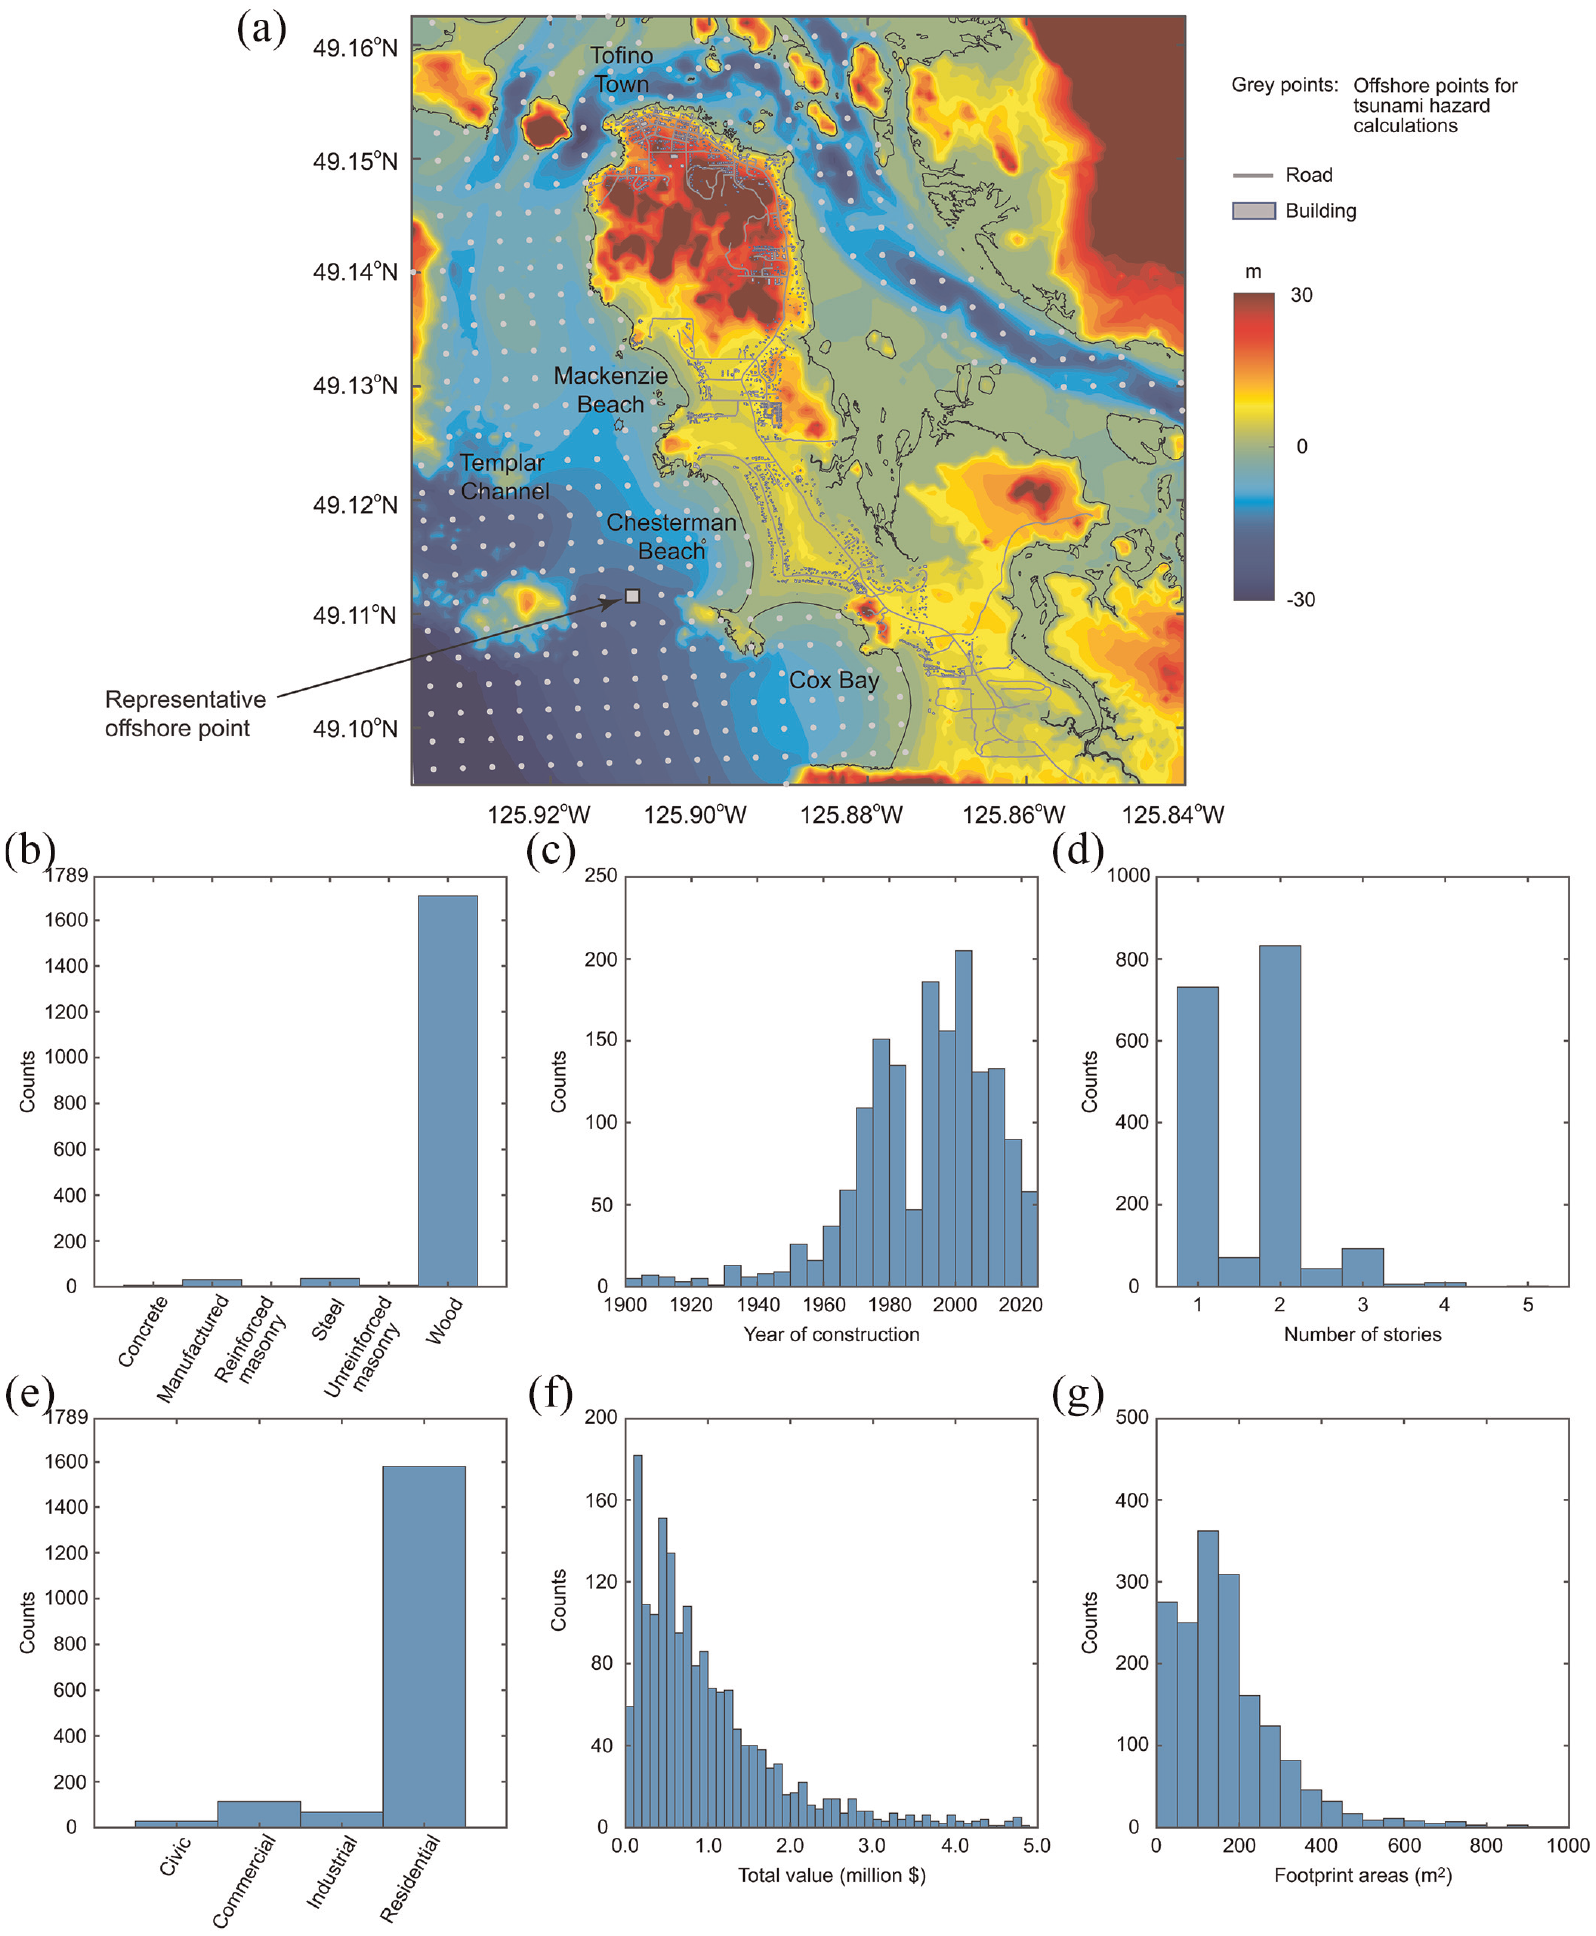
Characteristics of buildings in Tofino: (a) map of Tofino (bathymetry-elevation, buildings, and roads), and histograms of (b) structural material, (c) year of construction, (d) number of stories, (e) occupancy, (f) total value (replacement cost), and (g) footprint areas.
The building inventory that was compiled by Nanometrics contains 2001 properties. Some of them are campsites and marina docks and are not permanent buildings. In this study, these data are excluded from tsunami risk assessments, and the final building portfolio for the tsunami risk assessment consists of 1789 buildings. Their key building characteristics in terms of structural material, occupancy, year of construction, number of stories, total value, and footprint areas are shown in Figure 4b to g. Most buildings are 1- to 2-story wooden houses and were constructed in 1960s or afterwards. The total replacement cost of a building, which consists of structural elements, non-structural elements, and building contents, is typically less than 2 million Canadian dollars with the average value of 1.27 million Canadian dollars. The source data of the building replacement cost information are the BC Assessment Roll reports and the 2022 Canadian Cost Guide Report (Altus Group, 2022). The total asset value of the 1789 buildings is 2.27 billion Canadian dollars. The average footprint area of the 1789 buildings is 181.8 m2. The cost information of the individual buildings is used in the tsunami loss estimation.
In performing quantitative tsunami risk assessments for buildings, a vulnerability model is used to relate a tsunami hazard parameter to a building damage severity (e.g. damage ratio). In this study, an empirical tsunami fragility model by De Risi et al. (2017) is adopted, which was developed based on the tsunami damage data from the 2011 Tohoku event in Japan, containing more than 200,000 observations. The tsunami fragility model is characterized using multinomial logistic regression analysis by taking the structural typology (i.e. wood, concrete, steel, and masonry and others), number of stories, and topographical indicators (i.e. coastal plain and ria) as explanatory variables. In this study, the tsunami fragility model based on inundation depth that differentiates structural typologies is employed because of its robustness. It is noteworthy that the tsunami fragility model by De Risi et al. (2017) is developed for a different region and may not be applicable to buildings in Tofino directly. The effects of the flow velocity are not included in the adopted tsunami fragility model, because it is not entirely clear which coastal topography is applicable to Tofino and underlying flow velocity observations were relatively limited and uncertain. Some useful discussions on the choice of the tsunami fragility model in conducting tsunami risk assessments can be found in the study by Park et al. (2017).
Figure 5 shows four sets of tsunami fragility functions for five tsunami damage levels, that is, minor, moderate, extensive, complete, and collapse. For tsunami loss estimation purposes, these tsunami damage levels are related to building damage ratio ranges of 0.03–0.1, 0.1–0.3, 0.3–0.5, 0.5–1.0, and 1.0, respectively (http://www.mlit.go.jp/toshi/toshi-hukkou-arkaibu.html). It is important to note that with the inundation depth of 2.0 m or greater, the majority of wooden buildings will be washed away or destroyed. Although (low-rise) concrete and steel buildings are more resistant against tsunami loading, extensive inundation exceeding 5 m depth will cause complete destruction. During the tsunami damage and loss analyses, the tsunami fragility functions can be applied using inundation depth values at individual buildings. For a given inundation depth, the EPs for different damage states can be obtained (see Figure 5). By taking the differences of the EPs, the probabilities of experiencing these damage states can be calculated, noting that the sum of the probabilities of experiencing the damage states is 1. Subsequently, a damage state can be assigned probabilistically by comparing a uniform random number between 0 and 1 with the corresponding tsunami damage probabilities. If the random number falls between the range of tsunami damage probabilities for a specific damage level, the tsunami damage state is selected, and then, the tsunami damage ratio is sampled between the suggested ranges.
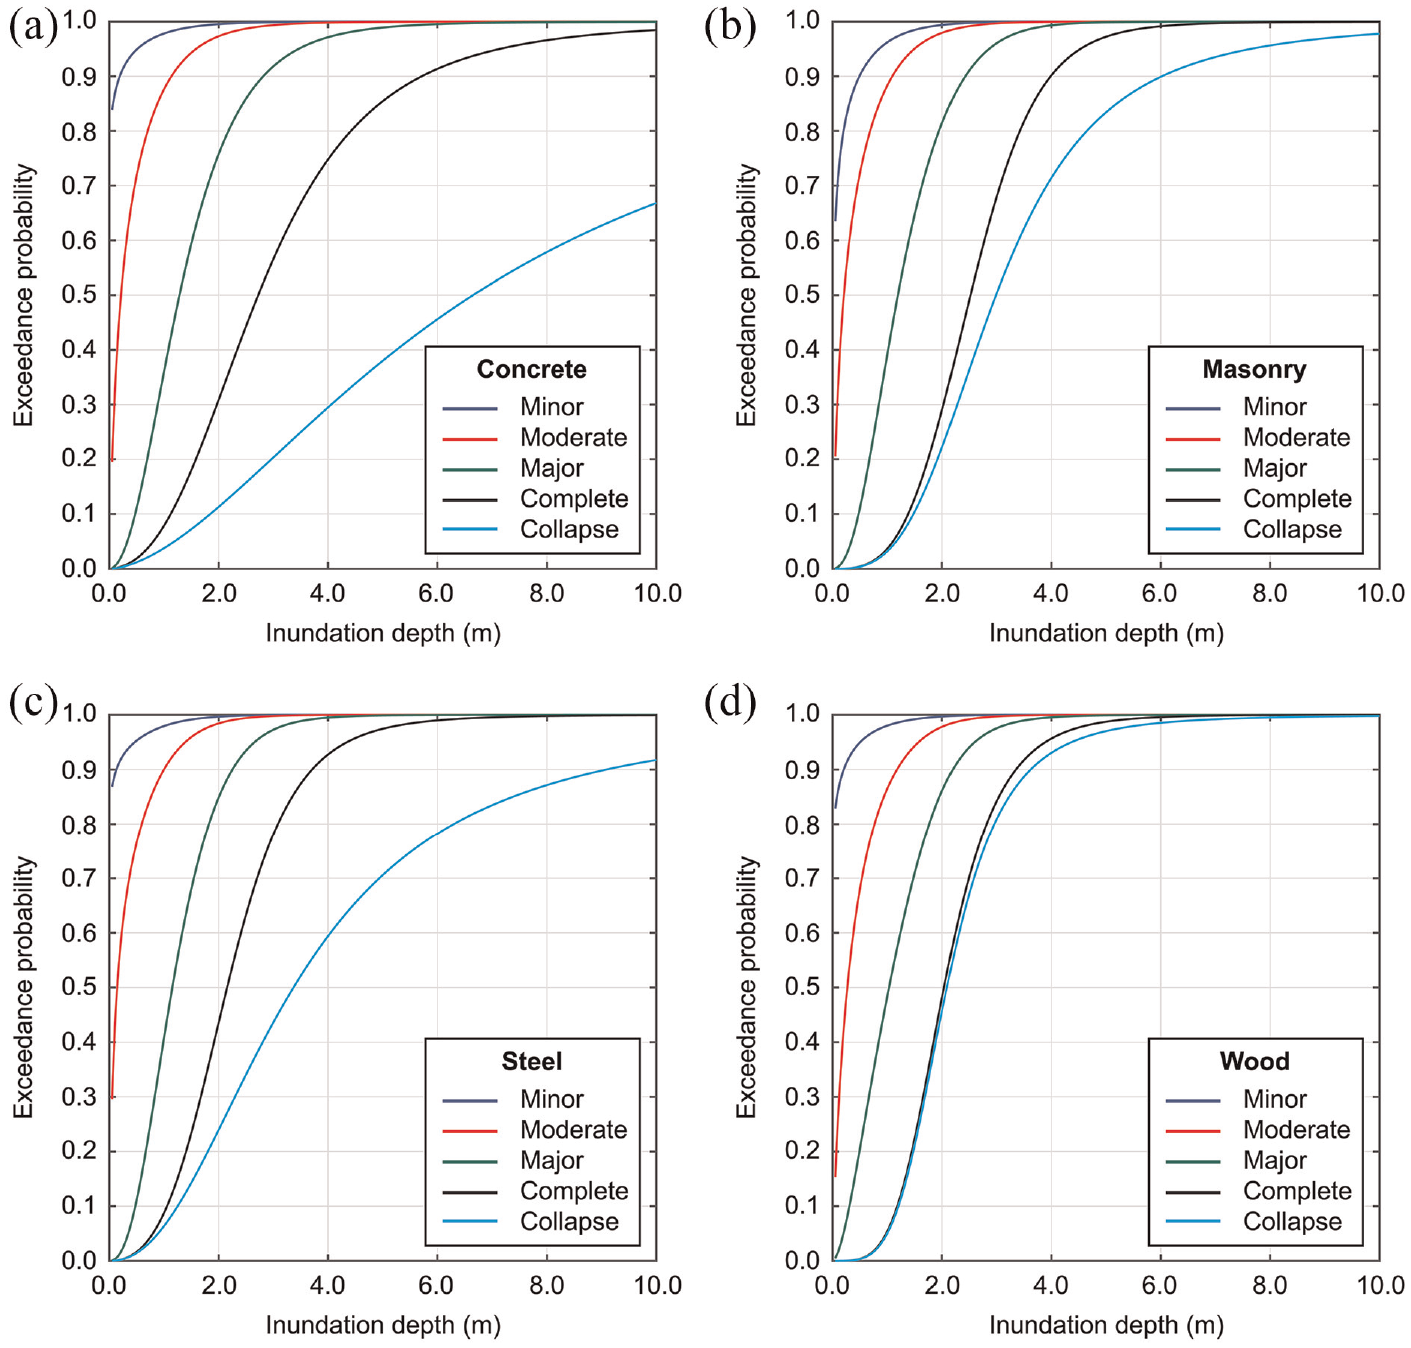
Tsunami vulnerability functions by De Risi et al. (2017): (a) concrete buildings, (b) masonry and other buildings, (c) steel buildings, and (d) wood buildings.
Finally, the tsunami loss value is determined by multiplying the total replacement cost of the building and contents and the sampled damage ratio. By repeating the same analyses, tsunami loss maps for specific tsunami scenarios are obtained, and these results can be aggregated to the town- and community-level. To illustrate the tsunami loss estimation phase, inundation depth maps for Tofino due to three example stochastic rupture models of the M8.9–M9.0 scenario (see Figure 2c) are shown in the top row of Figure 6. When the large tsunami waves hit Tofino directly, the beach areas will be completely inundated in some scenarios (e.g. realization 3). To inspect the building damage distributions for these three rupture models, the building loss distribution is displayed in the bottom row of Figure 6. By aggregating the tsunami losses to all buildings in Tofino, the portfolio loss for each rupture model can be evaluated and these data are used for the correlation analysis between the tsunami hazard and risk parameters.
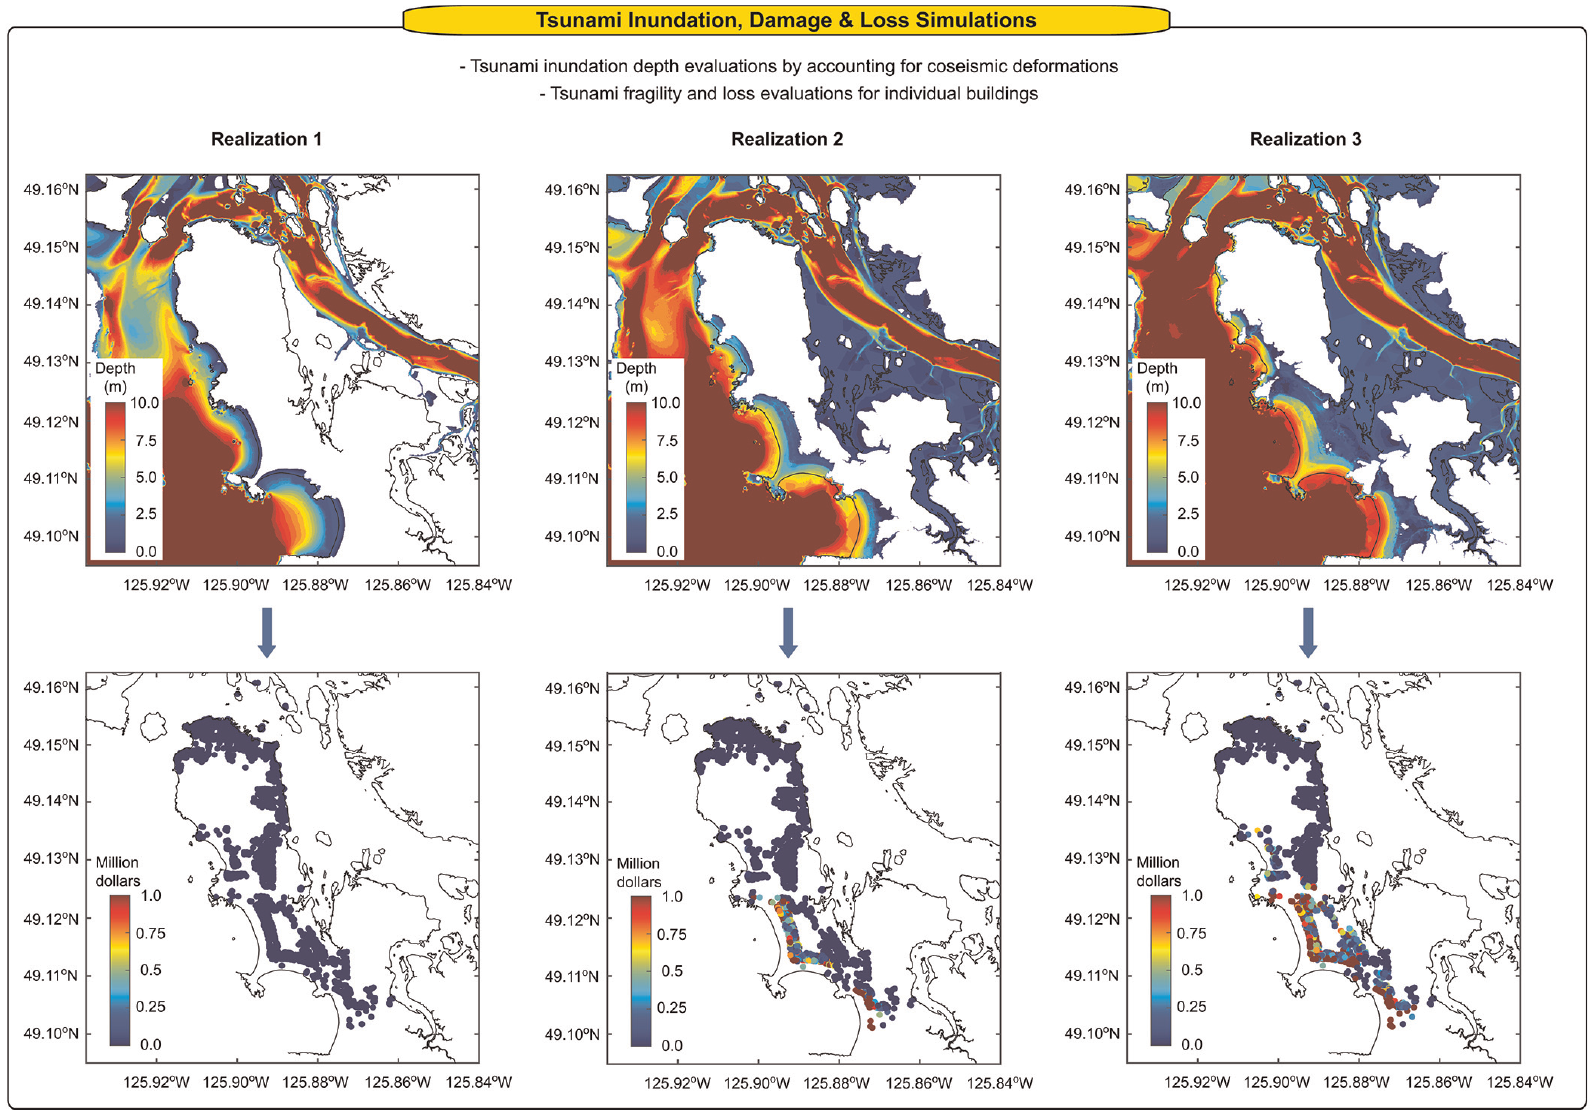
Stochastic inundation simulations (top) and tsunami loss estimation results (bottom) for the three example stochastic rupture models shown in Figure 2.
Correlation of offshore maximum modeled tsunami amplitude and estimated tsunami building loss for Tofino
This section presents the correlation analysis for the tsunami hazard and risk parameters. The maximum tsunami amplitudes at offshore locations that are calculated based on the 270 m grids and the 5 m grids are adopted as the tsunami hazard parameters, whereas the tsunami loss for the building portfolio in Tofino is adopted as the tsunami risk parameter. For all cases, the tsunami loss is estimated based on 5 m grid inundation simulation results. The maximum tsunami amplitude at an offshore location refers to the peak wave height measured with respect to the baseline vertical datum (i.e. mean sea level). The offshore points are defined based on the 270 m grid system and coincide with some of the locations based on the 5 m grid system. In other words, the maximum tsunami wave amplitudes for the two grid systems only differ in the computational grids.
Prior to the correlation analysis, it is useful to show the variability/stability of the estimated tsunami loss for the buildings in Tofino with respect to the number of stochastic rupture models. Figure 7 plots the three tsunami loss percentiles (i.e. 50th, 75th, and 95th) as a function of the number of tsunami simulations. The results are shown for individual earthquake magnitude ranges. It can be observed that when the number of simulations is relatively small, the three loss percentile values vary significantly. With the increase in the number of simulations, the percentile values become stable. Because of the aggregated nature of the total tsunami loss for Tofino, the stability of the tsunami loss distribution is attained with a smaller number of simulations than individual buildings. Other factors that affect the stability of the tsunami loss percentiles (or more broadly the probability distribution of tsunami loss) include the chosen earthquake magnitude range and the size of the fault plane. For instance, when a smaller scenario magnitude is considered (e.g. M8.5), the simulated earthquake source model can “float” more freely within the overall fault plane, thereby a larger number of stochastic rupture models is necessary. Figure 8 compares the conditional tsunami loss distributions, together with the 95% confidence interval, for the four magnitude ranges based on the number of simulations equal to 300. It can be observed that with the increase of earthquake magnitude, the tsunami loss becomes severer (i.e. the distribution shifts toward right).
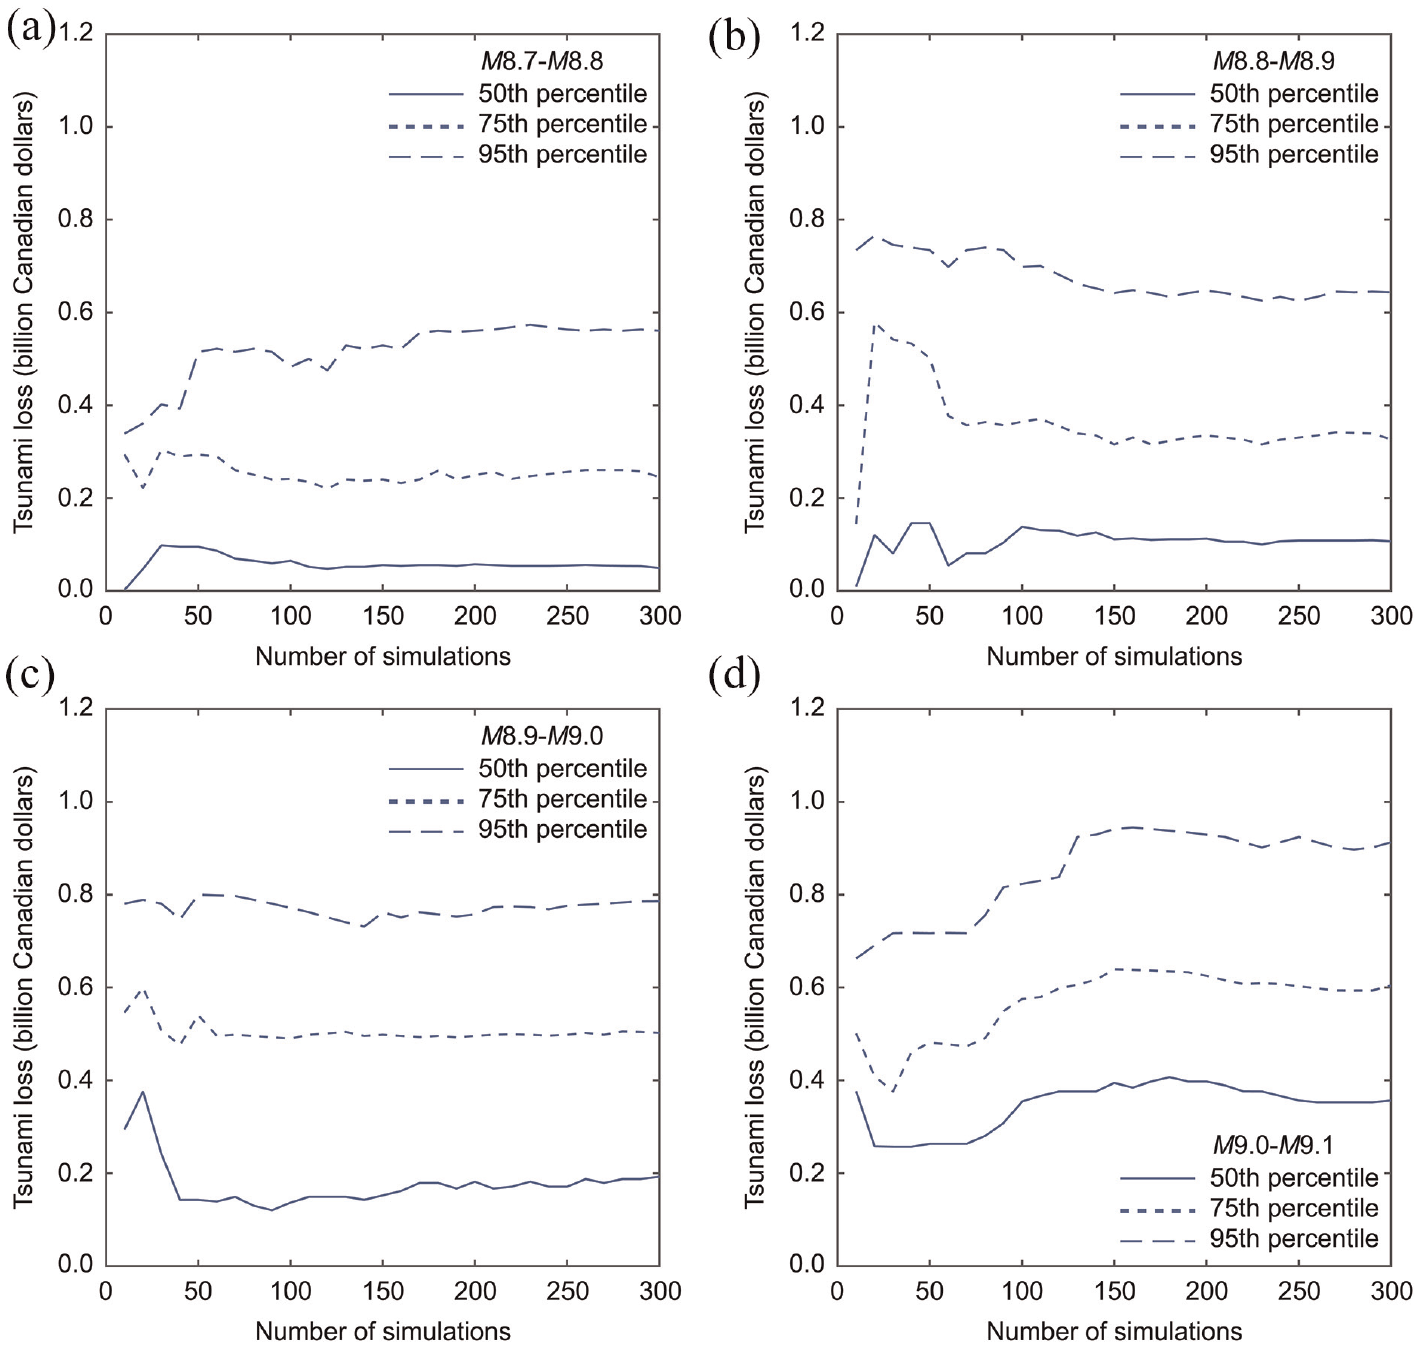
Convergence of tsunami building loss in terms of the number of simulations: (a) M8.7–M8.8, (b) M8.8–M8.9, (c) M8.9–M9.0, and (d) M9.0–M9.1.
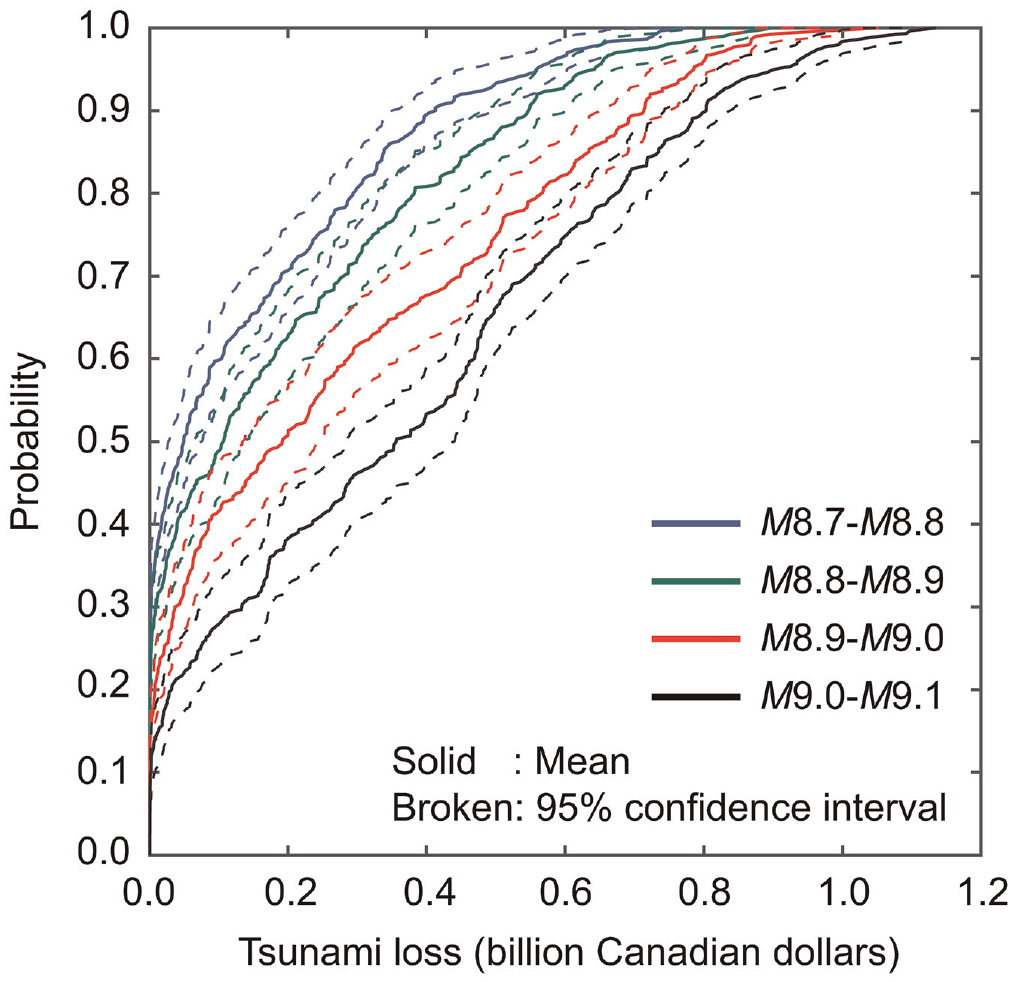
Conditional probability distributions of tsunami building loss for Tofino by considering four magnitude ranges. The number of simulations for each magnitude range is 300.
To investigate the correlation between the tsunami hazard and risk parameters, we select a representative offshore point that is shown as a square symbol in Figure 4. Figure 9 shows three sets of scatter plots, which are based on the 1200 stochastic rupture models. The first scatter plot (see Figure 9a) compares the maximum tsunami wave amplitudes that are computed at the representative offshore point using the 270 m grids with those computed using the 5 m grids. The two hazard parameters are highly correlated with the linear correlation coefficient of 0.98, indicating that the near-shore tsunami simulation results based on crude and fine grid resolutions are similar. Additional scatter plots of the relationship between the maximum wave amplitude (270 or 5 m grids) and the tsunami building loss are provided in Figure 9b and c. The results show overall similar trends of the correlation between the hazard and risk parameters but exhibiting slightly wider variability of the data points for the 270 m grids. The linear correlation coefficients for these hazard-risk parameters are 0.90 approximately. The results shown in Figure 9b and c indicate that the tsunami hazard parameter at the representative offshore point is highly correlated with the tsunami building loss and it may be possible to take advantages of this correlation to reduce the computational burdens in estimating the tsunami loss values that correspond to specified probability levels (e.g. value at risk on an EP curve for tsunami loss).
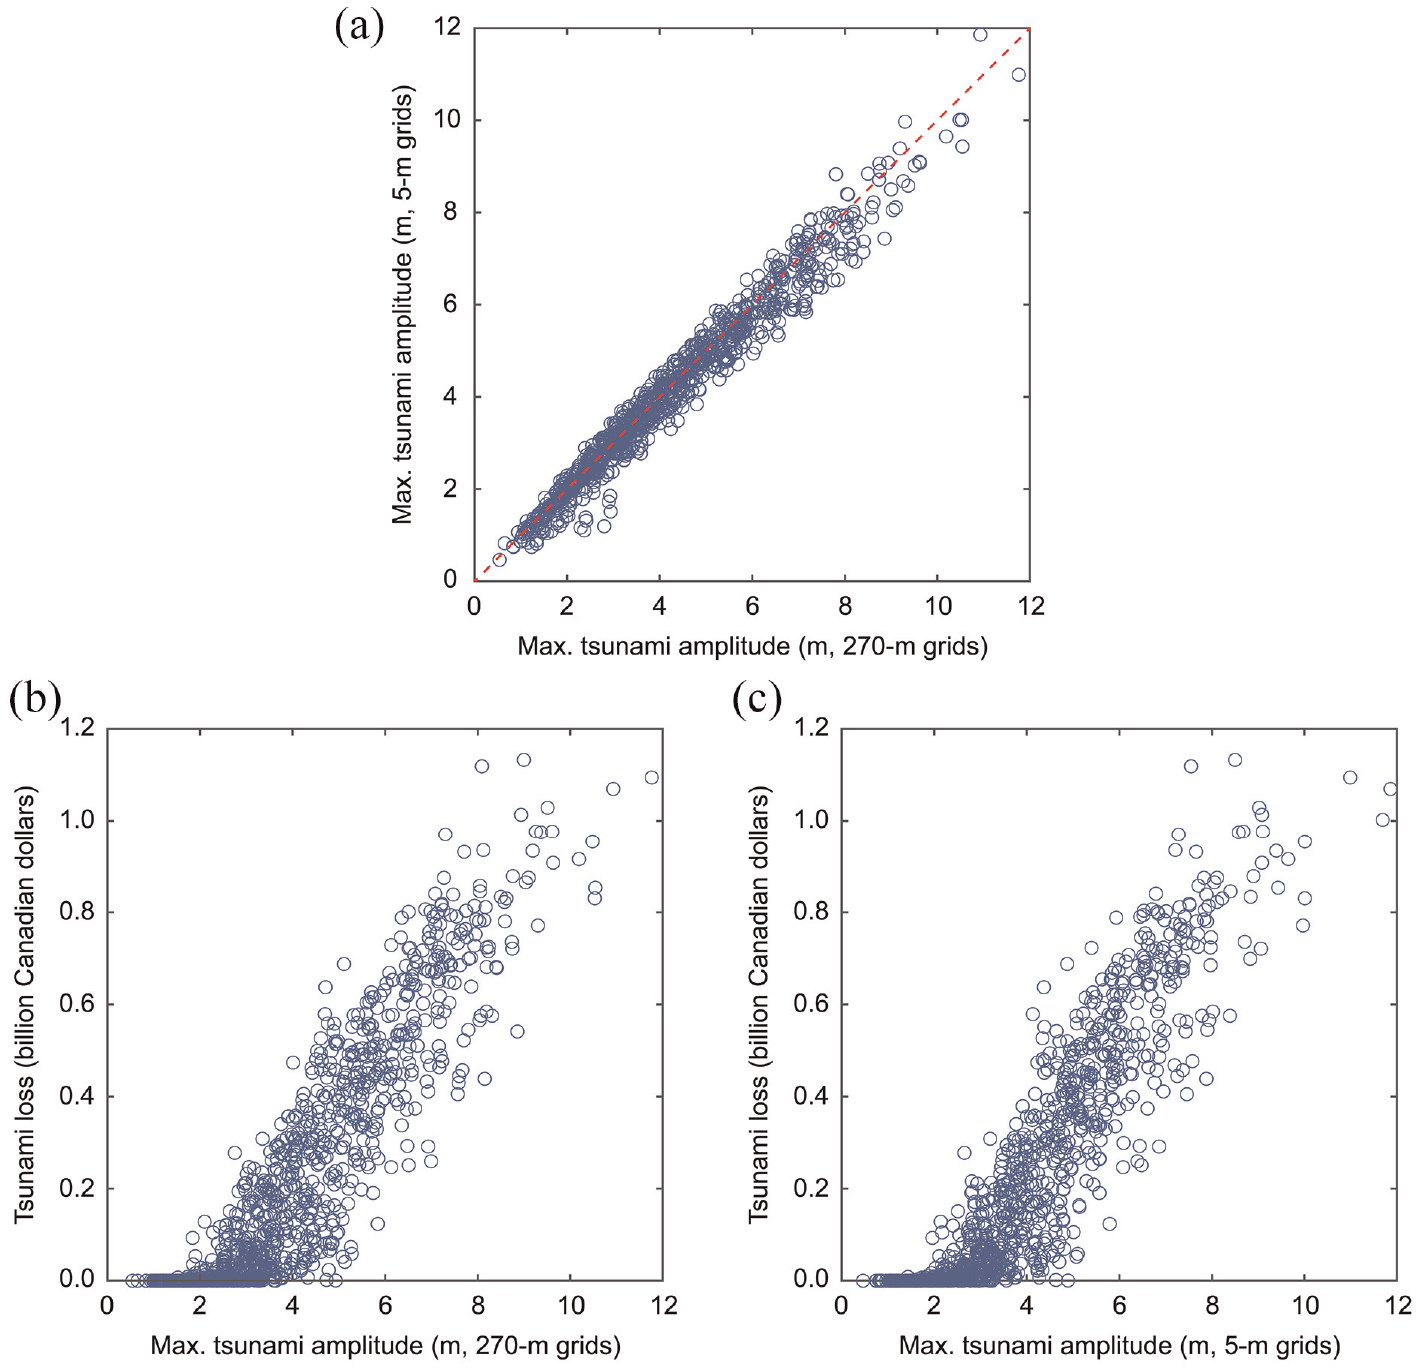
Scatter plots of the tsunami hazard and risk parameters: (a) maximum tsunami amplitude (270 m grids) at the representative offshore point versus maximum tsunami amplitude (5 m grids) at the representative offshore point, (b) maximum tsunami amplitude (270 m grids) at the representative offshore point versus tsunami building loss for Tofino, and (c) maximum tsunami amplitude (5 m grids) at the representative offshore point versus tsunami building loss for Tofino.
To examine whether similar correlation is observed for different locations, the correlation analysis is extended to other offshore points that are indicated in Figure 4 (see gray dots). The results of the correlation analysis are shown in Figure 10. Figure 10a suggests that the maximum tsunami wave amplitudes based on the crude and fine grids are highly correlated (correlation coefficient above 0.9) for most offshore points. High correlations can be seen even for points behind Esowista Peninsula (i.e. locations that are not hit by tsunami waves directly). This is because tsunami waves flow along the river channel (Browning Passage) behind Esowista Peninsula that has relatively deep riverbed (+10 m; see Figure 4a), without being affected by the grid resolutions. On the contrary, Figure 10b and c, which plot the maximum modeled amplitude against the estimated tsunami loss, show higher correlations for points that are on the Pacific side of Esowista Peninsula (correlation coefficient 0.8 to 0.9), whereas lower correlations are obtained for points that are behind Esowista Peninsula (correlation coefficient less than 0.5). The differences of the linear correlation coefficients depending on the locations can be explained by pointing out that the tsunami damage occurs to buildings that are in the beach areas and directly face the Pacific Ocean (see Figure 6).
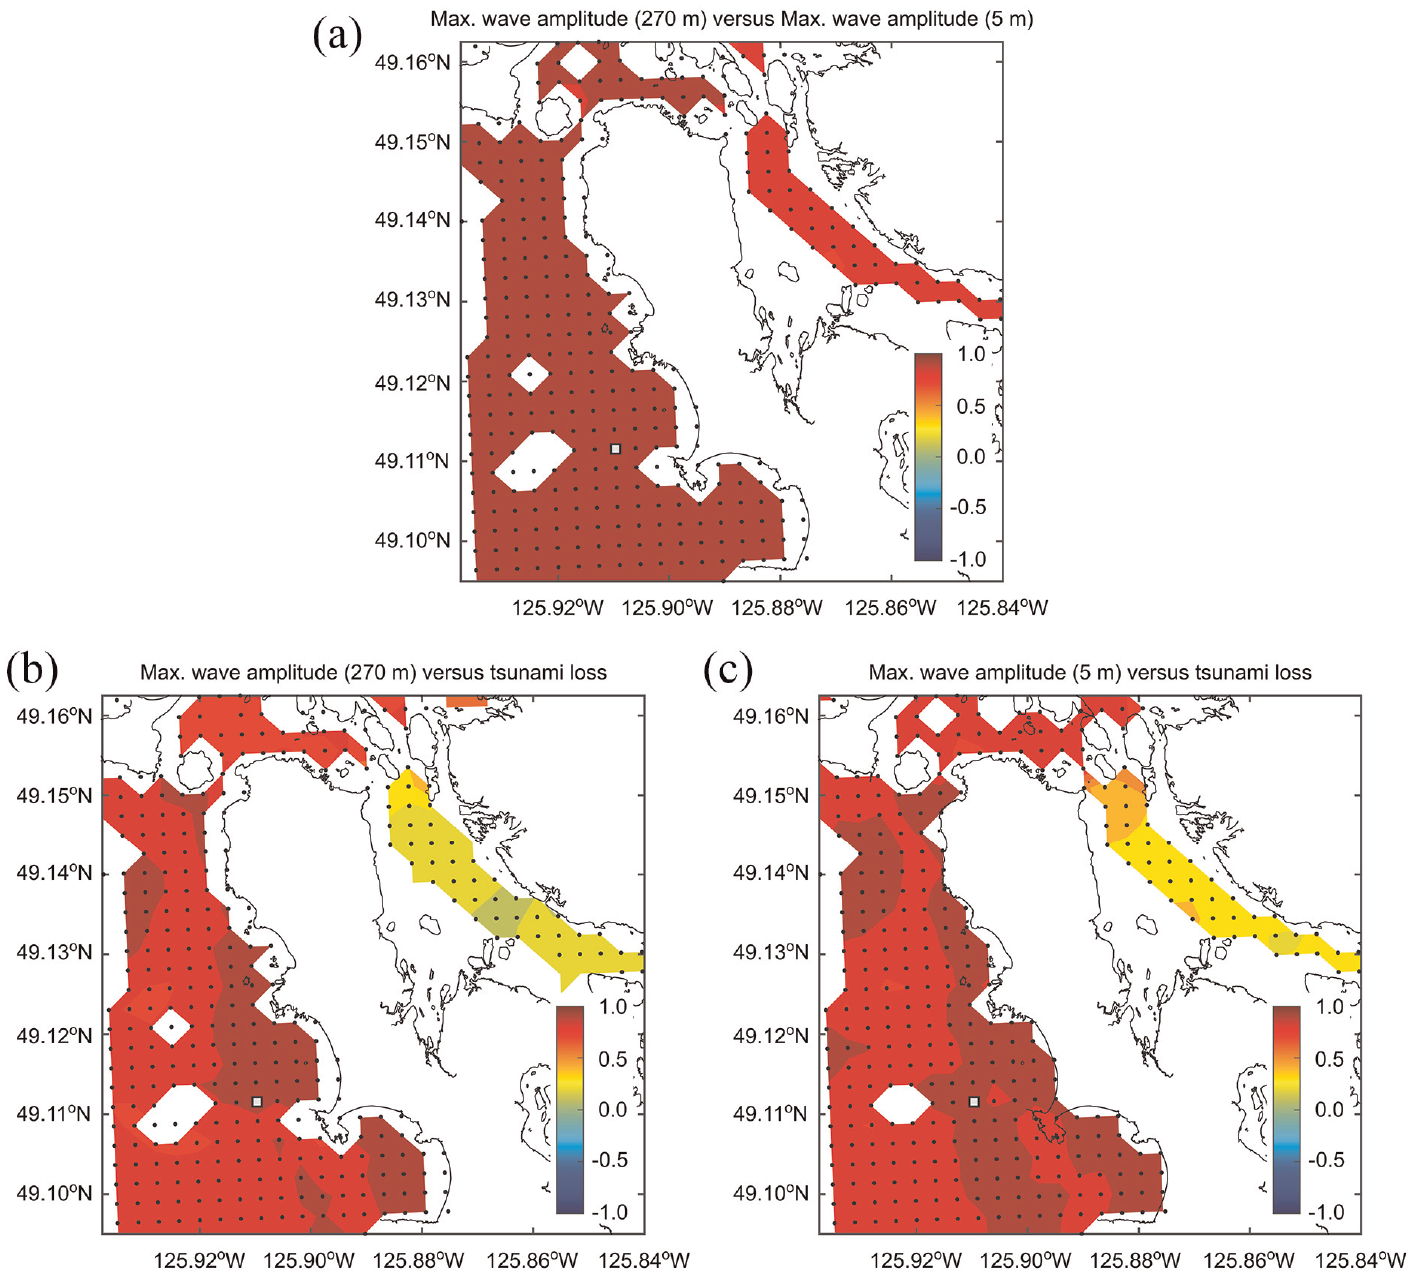
Correlation maps of the tsunami hazard and risk parameters: (a) maximum tsunami amplitude (270 m grids) versus maximum tsunami amplitude (5 m grids), (b) maximum tsunami amplitude (270 m grids) versus tsunami building loss for Tofino, and (c) maximum tsunami amplitude (5 m grids) versus tsunami building loss for Tofino.
Illustration for probabilistic tsunami hazard and risk analyses
The main motivation of the correlation analysis between the tsunami hazard and risk parameters is to investigate the correspondence between hazard-based and risk-based rankings of stochastic rupture scenarios in the context of probabilistic tsunami hazard and risk analyses. An illustration of these analyses is given by focusing on Tofino. It is noted that the earthquake occurrence model that is used for this illustration is based on a time-independent Poisson process and is simplistic. More elaborated earthquake occurrence models can be implemented by considering time-dependent recurrence of the Cascadia megathrust earthquakes and by combining multiple earthquake occurrence models via a logic tree (Goda, 2019; Kulkarni et al., 2013).
Illustrative probabilistic tsunami hazard and risk analyses for Tofino are set up. For tsunami hazard, the maximum tsunami wave amplitude at the representative offshore point is considered, whereas for tsunami risk, the tsunami building loss for Tofino is considered. Only the whole rupture Cascadia megathrust scenarios are considered, and the annual occurrence rate is 1/530 (Goldfinger et al., 2012). The magnitude distribution of the whole rupture scenarios is based on the truncated Gutenberg–Richter relationship with the b-value = 1.0. With this set-up, the annual occurrence rates of the M8.7–8.8, M8.8–8.9, M8.9–9.0, and M9.0–9.1 scenarios are calculated as 0.00064, 0.00051, 0.00041, and 0.00032, respectively (which sums to 0.0019 = 1/530). Tsunami hazard contributions from other distant seismic sources are not included in this example. An empirical tsunami hazard assessment by Leonard et al. (2014) suggests that the Cascadia megathrust earthquakes are the main contributors of tsunami hazard in Tofino when the tsunami amplitude is larger than a few meters.
The annual exceedance curves of the tsunami hazard and risk parameters are obtained via Monte Carlo simulations. More specifically, the total number of simulations is set to 10 million, and for each trial, earthquake occurrence over 1 year is evaluated by sampling the occurrence time of an event. When the simulated occurrence time is less than 1 year, an earthquake magnitude value is sampled from the truncated Gutenberg–Richter relationship to determine which magnitude bin is suitable for the triggered Cascadia event. Once the earthquake magnitude bin is determined, a maximum tsunami wave amplitude and a tsunami building loss for Tofino are sampled from the corresponding empirical probability distribution of the tsunami hazard/risk parameter (see Figure 9). Although the chance of experiencing more than one Cascadia event within a year is very small, the simulations of the tsunami hazard and risk parameters for the current trial are continued until the simulation time exceeds 1 year. This simulation is repeated 10 million times and the annual maximum tsunami hazard/risk parameter can be plotted as annual EP curves (note: there are many sampled hazard/risk values with zero).
Now, let us consider the tsunami hazard parameters that are determined at some specific probability levels. Based on practical considerations of tsunami hazard and risk analyses, annual EPs of 0.001, 0.0004, and 0.0002 are selected (approximately corresponding to return periods of 1000, 2500, and 5000 years). Because the tsunami hazard and risk analyses are conducted based on stochastic Monte Carlo simulations, multiple earthquake rupture models will produce similar tsunami hazard and risk estimates. Our focus is to minimize the number of high-resolution tsunami inundation simulations (i.e. tsunami building damage-loss assessment) but allows numerous runs of low-resolution tsunami simulations to account for a comprehensive set of possible earthquake ruptures. To select possible earthquake rupture scenarios based on hazard ranking, 20 earthquake source models that produce the maximum tsunami wave amplitudes at the specified annual probabilities of 0.001, 0.0004, and 0.0002 with plus and minus 0.1 m differences are randomly selected. For instance, for the case of annual EP of 0.001, the maximum tsunami wave amplitude at the representative offshore point is estimated to be 3.55 m, and then, 20 models that have the maximum tsunami wave amplitudes between 3.45 and 3.65 m are selected. In the above-mentioned analysis set-up, the margin of error of 0.1 m is selected arbitrarily (note: the estimated tsunami hazard parameters have some variability, depending on the grid resolutions and other sources of uncertainty, such as errors in elevation data). On the contrary, the number of trial models of 20 is selected such that 20 runs of high-resolution tsunami inundation simulations are practical and affordable, which is significantly less than 1200 runs (note: different values of the margin of error and numbers of high-resolution tsunami inundation simulation runs can be considered, and several preliminary sensitivity analyses were conducted to ensure that the proposed method works for other cases).
Due to the variability of the tsunami hazard parameter based on the crude resolution with respect to the tsunami hazard and risk parameters based on the fine resolution (see Figure 9), stochastic source models that are selected based on the low-resolution tsunami hazard parameter are not ranked in the same way as those selected based on the high-resolution tsunami hazard/risk parameter. To visualize the correspondence of the hazard-based and risk-based rankings of stochastic source models, Figure 11 shows variability of the annual probability of exceedance of the 20 hazard-ranked scenarios using the 270 m grids with respect to the maximum wave amplitude based on the 5 m grids and the tsunami building loss for Tofino by considering different annual EP levels. The gray lines that are connected for different hazard and risk parameters are for the same stochastic source models. As expected, the correspondence of the annual probabilities of exceedance becomes less (i.e. more scattered) as the metric of interest is changed from the low-resolution tsunami hazard parameter (i.e. maximum tsunami wave amplitude based on the 270 m grids) to the high-resolution tsunami risk parameter (i.e. tsunami building loss for Tofino). The assigned annual EPs for the same stochastic scenarios can differ by a factor of two when the tsunami risk parameter is of interest (e.g. at the annual EP of 0.0004, shown in Figure 11b, the end points of the gray lines range between 0.0002 and 0.0008). In other words, a single run of the high-resolution tsunami simulation could result in a tsunami risk estimate, which could differ significantly from the target annual EP. The cause of this variability is the partial correlation between the tsunami hazard and risk parameters, shown in Figure 9c. Although the maximum tsunami wave amplitude at the representative offshore point is well correlated with the building tsunami loss for Tofino, there is still a large scatter of the tsunami building loss for a given maximum tsunami wave amplitude value. A simple approach to estimate the tsunami risk parameter at the target annual EP level more reliably is to adopt a statistic for central tendency of a distribution, such as median and mean. In Figure 11, the median values of the 20 annual EPs for different tsunami hazard and risk parameters are indicated with red squares. The median values are consistently scattered close to the target annual exceedance provability levels.
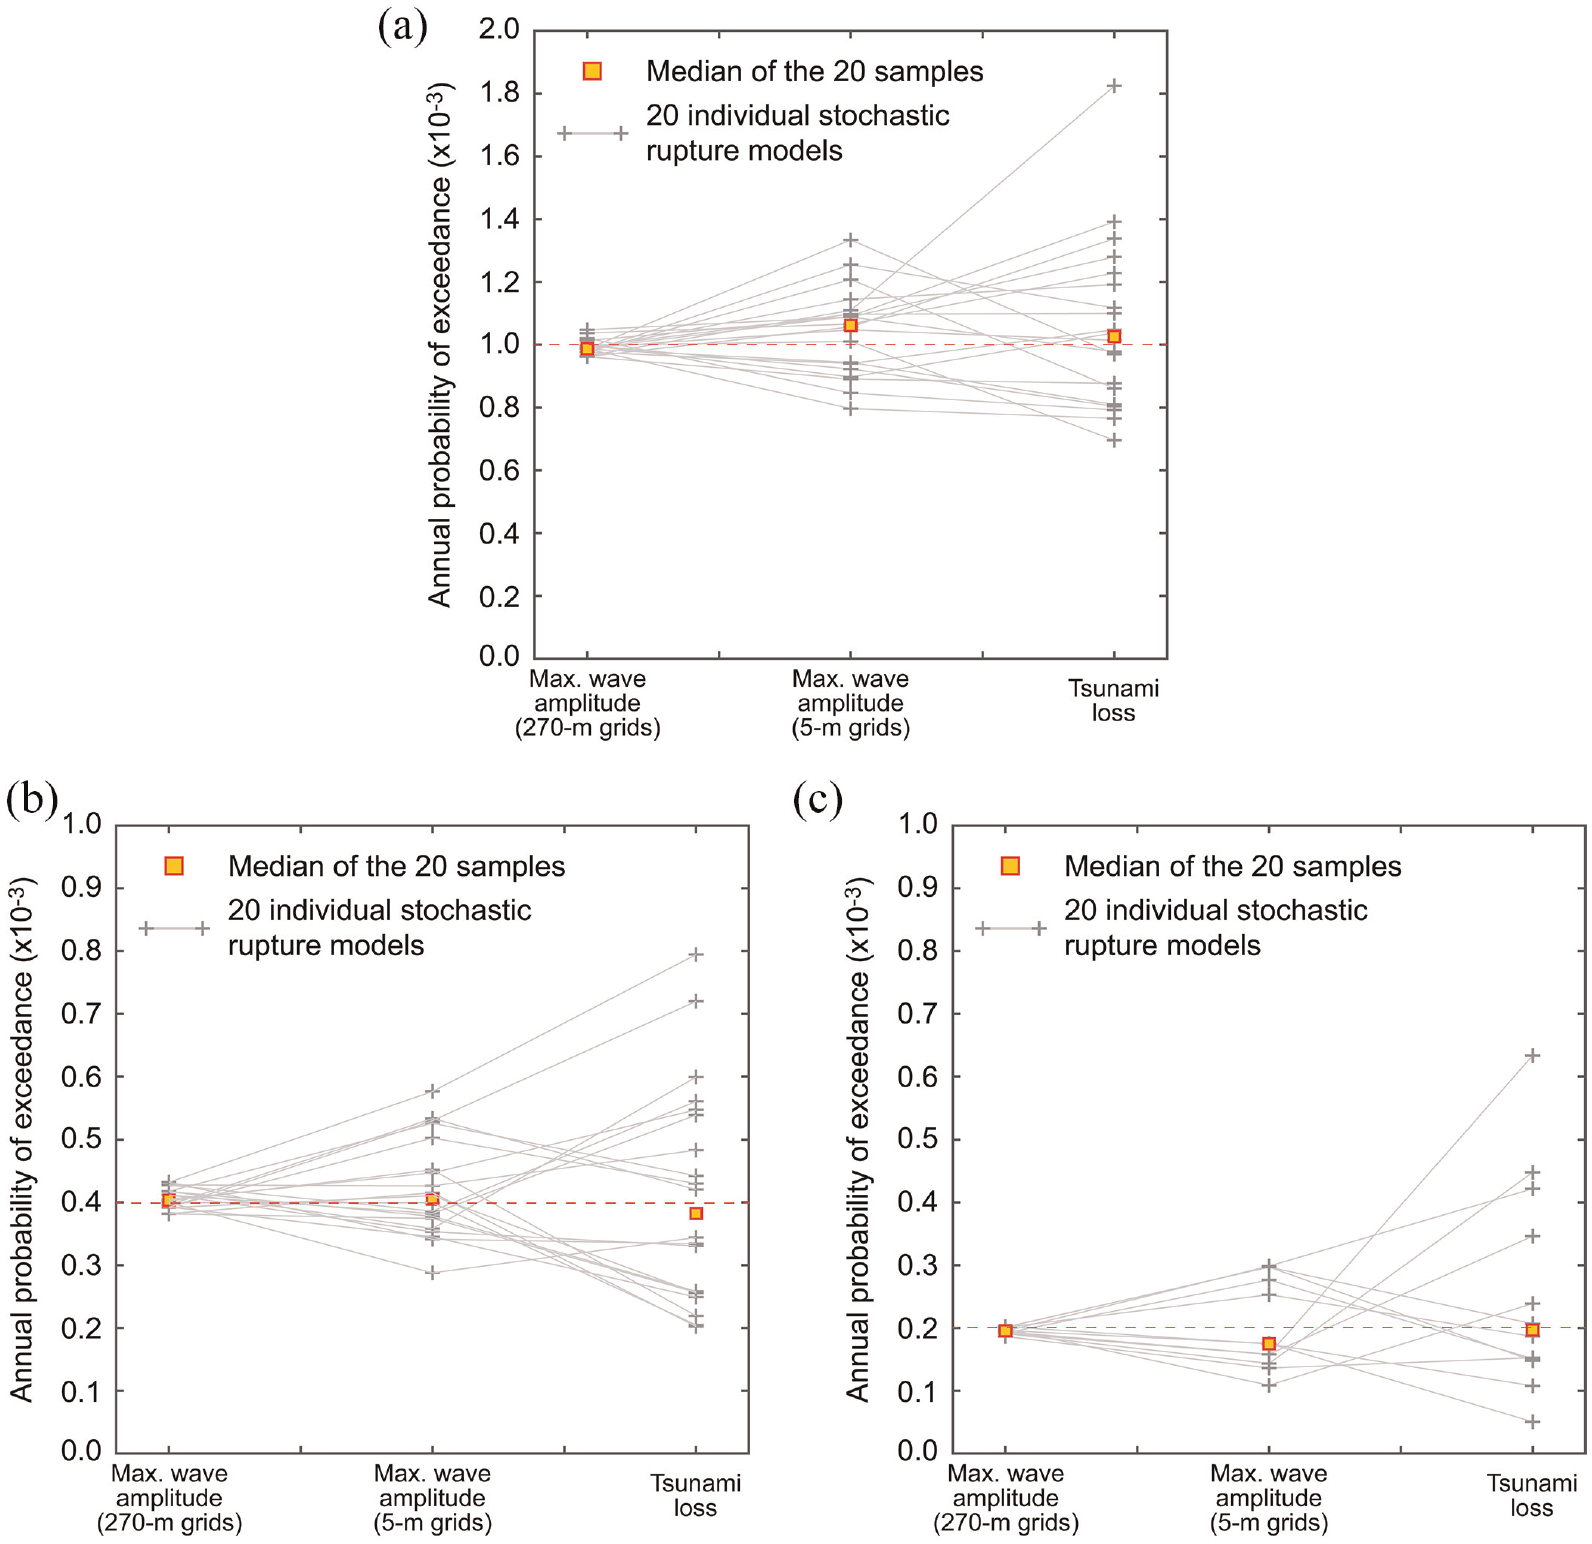
Variability of the annual probability of exceedance of the 20 hazard-ranked scenarios based on the 270 m grids in terms of the maximum wave amplitude based on the 5 m grids and the tsunami building loss for Tofino by considering different annual exceedance probability levels: (a) annual exceedance probability of 0.001, (b) annual exceedance probability of 0.0004, and (c) annual exceedance probability of 0.0002.
It is of interest to investigate the robustness of the above procedure in estimating the annual EPs of the high-resolution tsunami hazard and risk parameters based on the comprehensive hazard-based rankings of stochastic rupture models using the low-resolution tsunami simulation results. For this purpose, probabilistic tsunami hazard analysis based on the low-resolution tsunami simulations is repeated 10 times and for each analysis, 20 stochastic source models that correspond to the target annual EP level are selected and their median estimates of the high-resolution tsunami hazard and risk parameters are obtained. These results are shown in Figure 12. For all three target probability levels and for all three hazard and risk parameters, the median estimates are close to the corresponding EP curves that are computed based on the 1200 stochastic source models (i.e. black curve), demonstrating stable performances of this simple procedure.
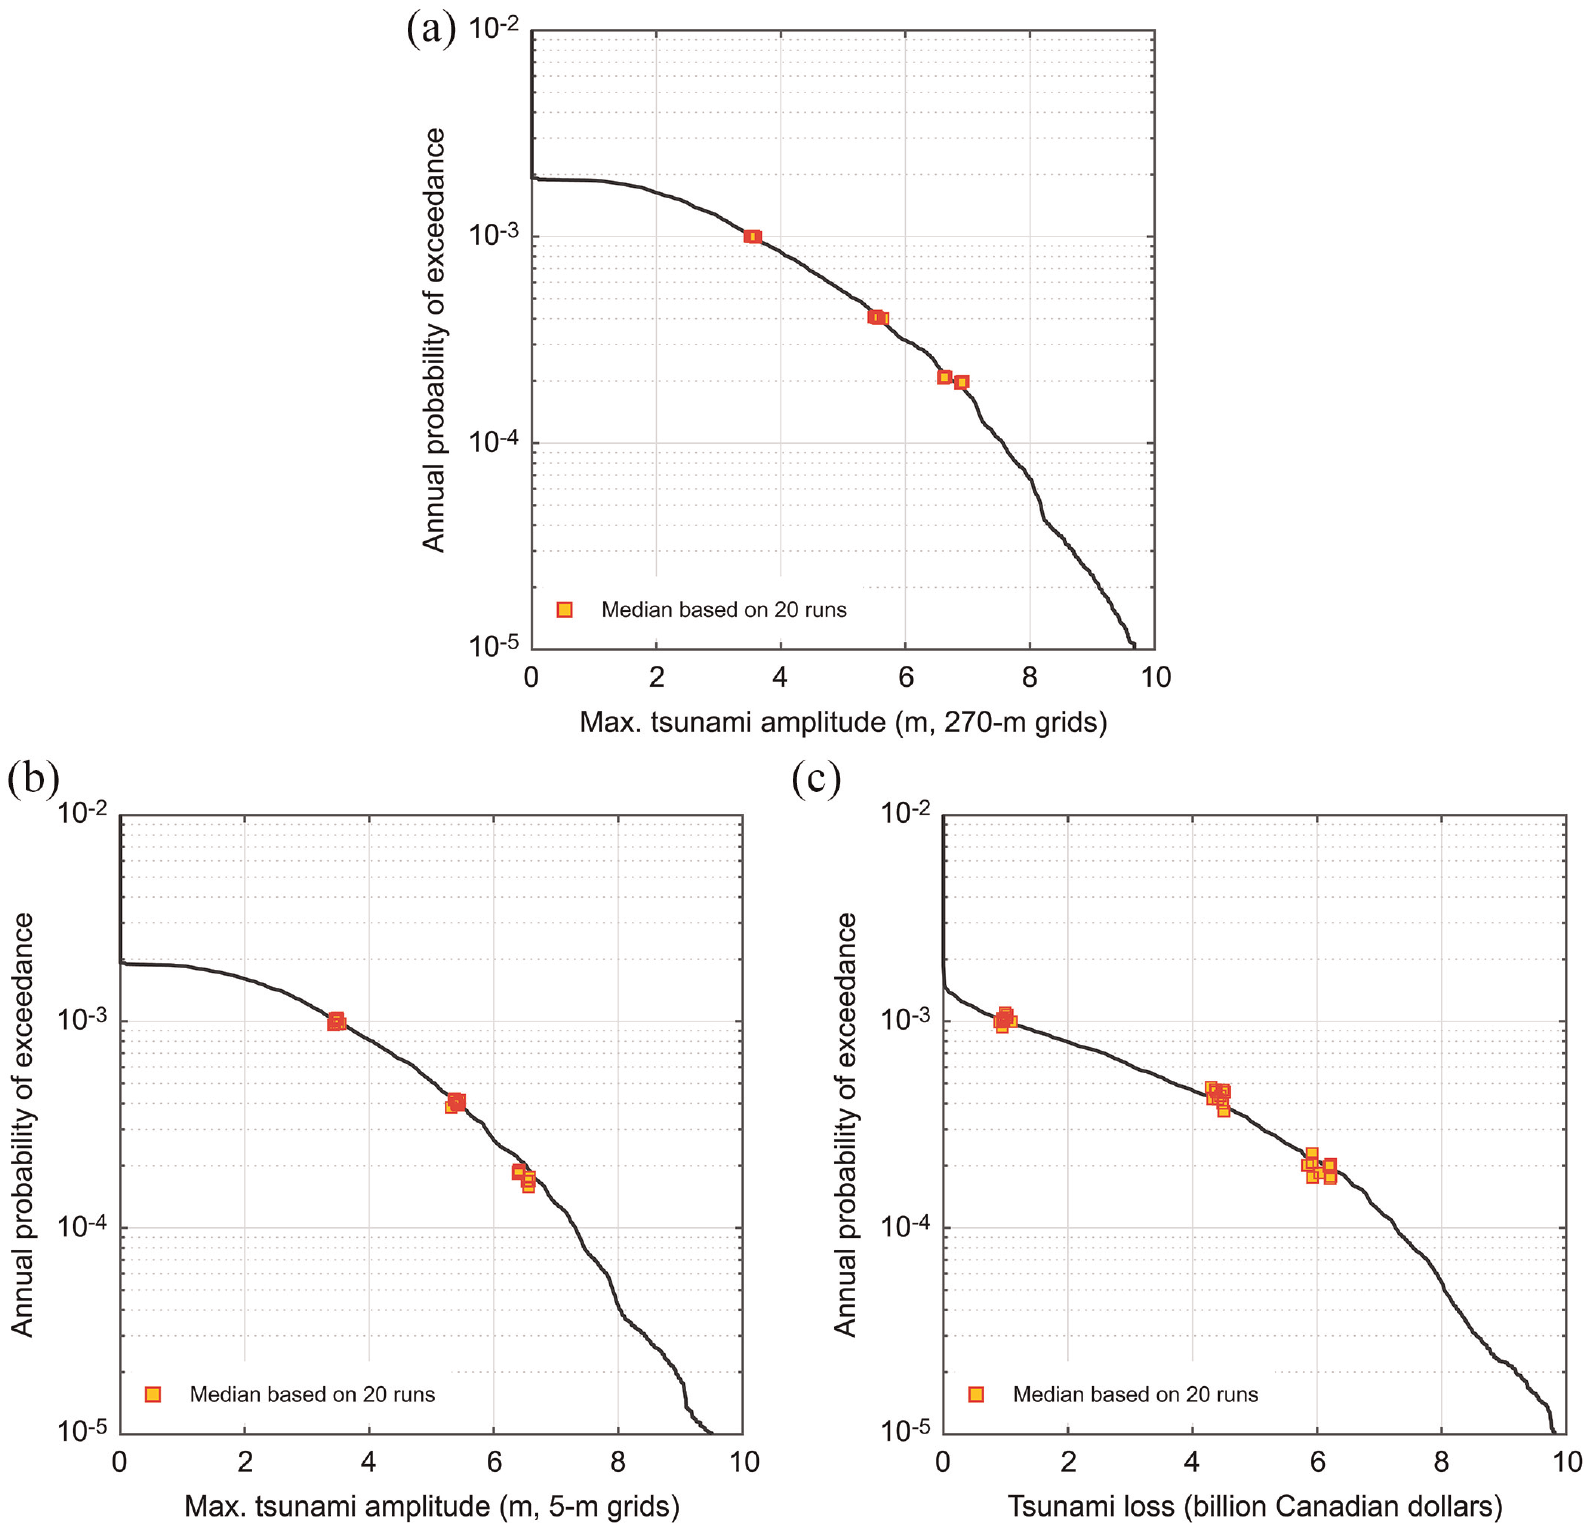
(a) Tsunami hazard curve and estimated median estimates based on 20 tsunami simulation runs (270 m grids), (b) tsunami hazard curve and estimated median estimates based on 20 tsunami simulation runs (5 m grids), and (c) tsunami loss curve and estimated median estimates based on 20 tsunami simulation runs.
Finally, it is also of interest to investigate how the entire EP curves for the hazard and risk parameters can be obtained with a limited number of high-resolution tsunami inundation simulations. A practical approach is to select a set of target annual EPs and to select several stochastic source models for each target probability level. Here, we consider a range of nine annual EP levels from 0.00004 to 0.0016; these probability values are selected in the logarithmic space (base 10) with 0.2-unit interval. For each probability level, five stochastic rupture models are selected and the median of the tsunami hazard/risk parameter values of the five stochastic models is adopted. Subsequently, when the representative hazard and risk estimates are not in the ascending order, these values are sorted. For evaluating the robustness of the procedure, the results are shown in Figure 13. When the tsunami inundation simulations with the 5 m grids are carried out (see Figure 13b), the approximated tsunami hazard curve follows the target tsunami hazard curve that is derived based on 1200 stochastic source models. The correspondence of the approximated and rigorous tsunami hazard curves is generally satisfactory. Figure 13c shows a similar comparison for the tsunami building loss for Tofino. The approximated tsunami risk curves are more variable than the approximated tsunami hazard curves, but generally follow the target tsunami risk curve that is derived based on 1200 stochastic source models. The cause of the larger variability of the approximated tsunami risk curves than the variability of the approximated tsunami hazard curves is the partial correlation/correspondence of these tsunami hazard and risk parameters (see Figure 11). Given that only 45 tsunami inundation simulation results with the 5 m grids are employed to obtain each approximated hazard or risk curve, the correspondence is judged to be satisfactory. Note that different numbers of the target probability levels and different numbers of stochastic rupture models per probability level can be considered for different problems and computational resource constraints.
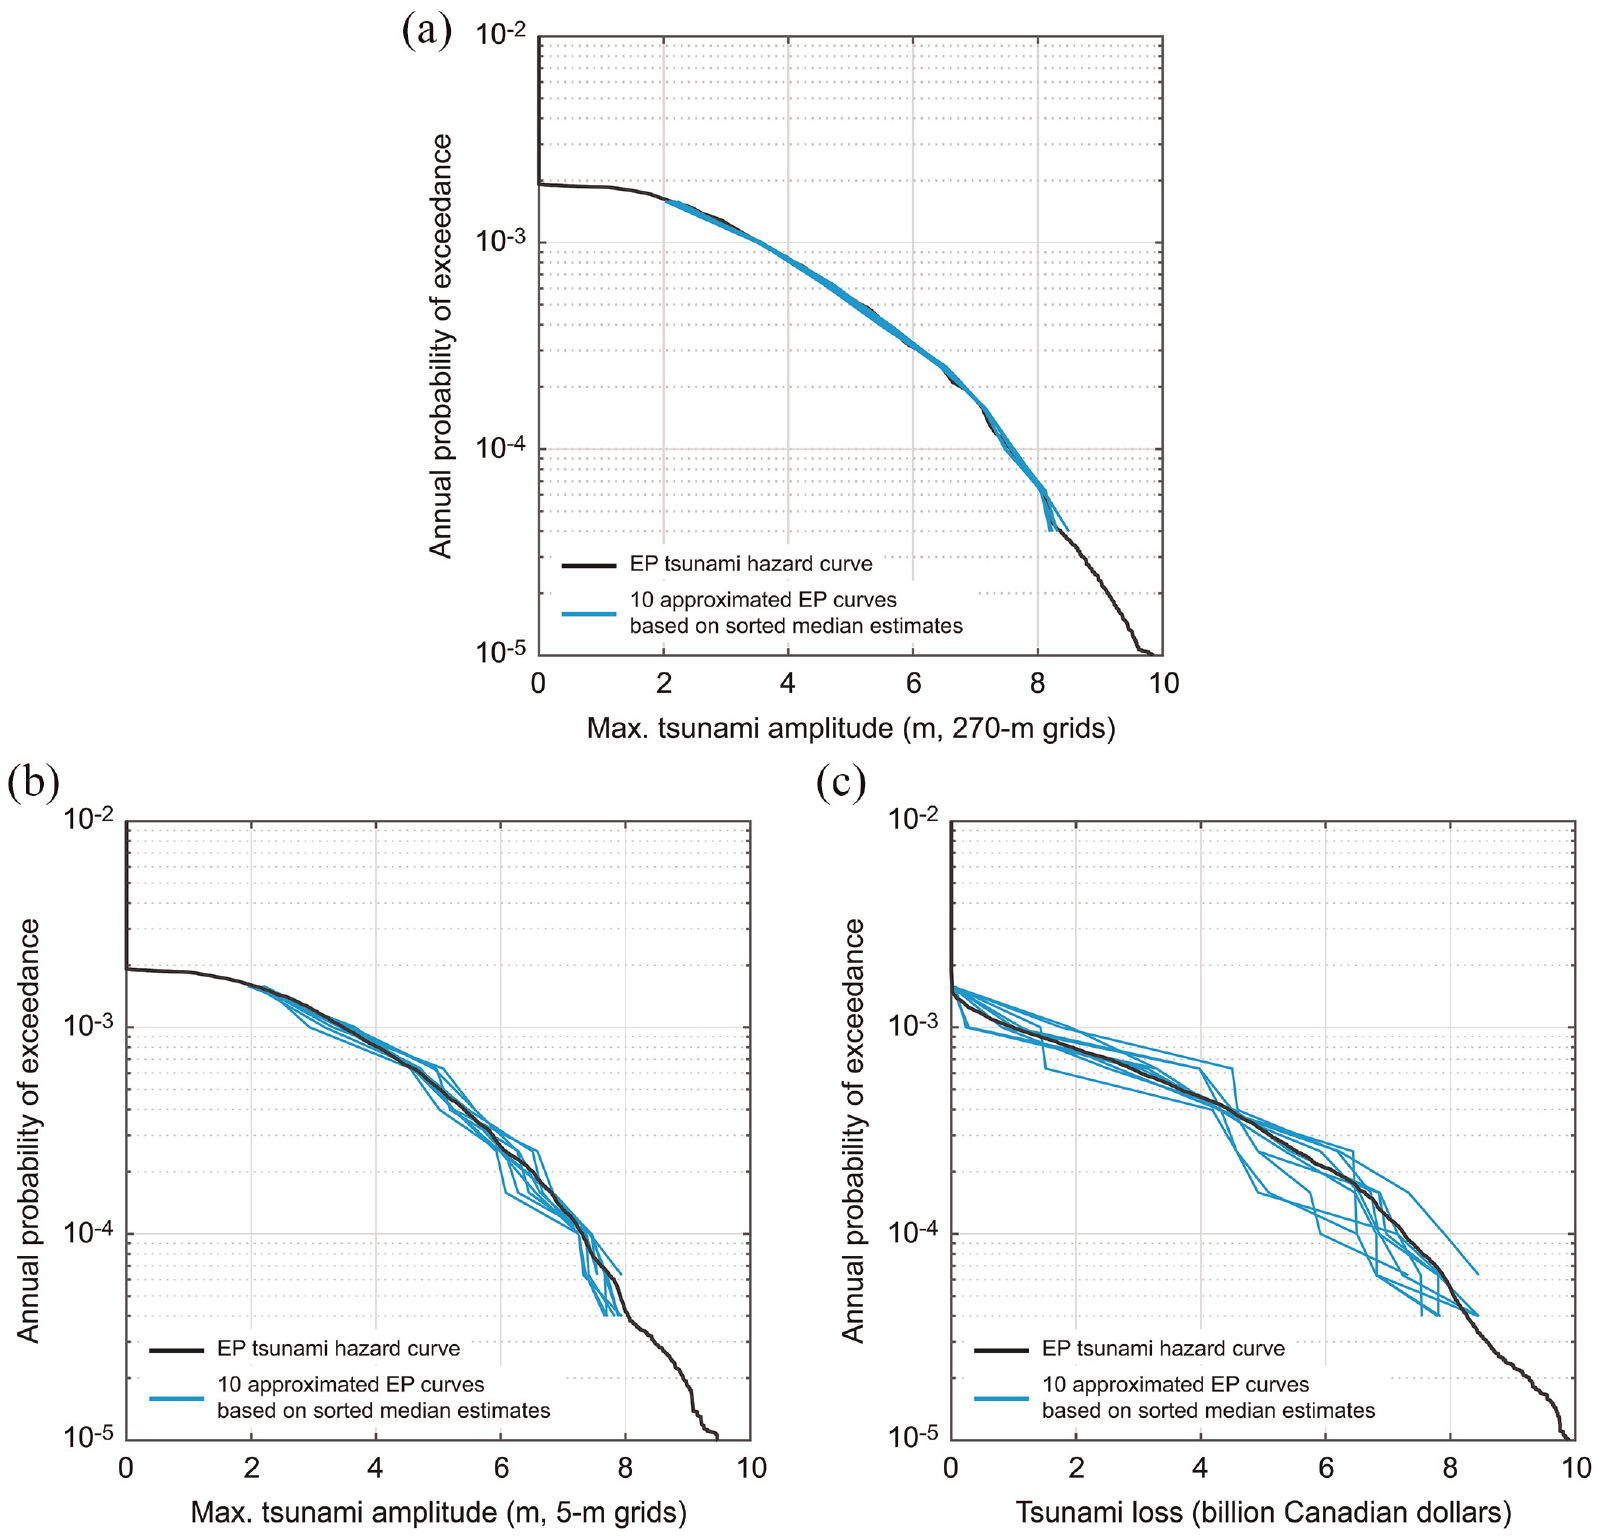
(a) Tsunami hazard curve and 10 approximated tsunami hazard curves based on sorted median data (270 m grids), (b) tsunami hazard curve and 10 approximated tsunami hazard curves based on sorted median data (5 m grids), and (c) tsunami loss curve and 10 approximated tsunami loss curves based on sorted median data.
Conclusion
This study investigated the correspondence between hazard-based and risk-based rankings of stochastic rupture scenarios in the context of probabilistic tsunami hazard and risk analyses. The main motivations were to identify critical earthquake scenarios from a wide range of possible rupture patterns and to estimate a tsunami risk parameter for coastal communities efficiently with a small number of high-resolution tsunami simulations. In other words, the study aimed at finding a practical approach to mitigate the effect of the computational bottleneck of probabilistic tsunami risk analysis based on stochastic tsunami simulations. For this purpose, a case study is set up for Tofino, British Columbia, which is subjected to potential tsunami hazards from the Cascadia megathrust earthquakes. Upon development of the stochastic tsunami simulation models and the exposure-vulnerability models for Tofino, the correlation between the maximum modeled tsunami wave amplitudes at nearshore locations off Tofino and the estimated tsunami building loss for Tofino was evaluated. The offshore maximum tsunami amplitudes based on the crude computational grids (270 m) were well correlated with the offshore maximum tsunami amplitudes based on the fine computational grids (5 m) at the same location and with the aggregated tsunami building loss for Tofino. Note that tsunami affects other types of facilities (e.g. docks, campsites, and cultural heritage sites), and infrastructure (e.g. roads, powerlines, and water sanitation plants) were not included in the tsunami loss estimation.
Subsequently, the variability of the annual probability of exceedance of 20 hazard-ranked scenarios based on the 270 m grid simulations was investigated in terms of the maximum tsunami wave amplitude based on the 5 m grid simulations and the tsunami building loss for Tofino. Due to the variability of the tsunami hazard parameter based on the crude resolution grids with respect to the tsunami hazard and risk parameters based on the fine resolution grids, stochastic source models that were selected based on the low-resolution tsunami hazard parameter were ranked differently, compared to those selected based on the high-resolution tsunami hazard/risk parameter. The assigned annual EPs for the same stochastic scenarios can differ by a factor of two. A practical approach to estimate the tsunami risk parameter at the target annual EP level reliably was to adopt the median value of the tsunami risk parameters from multiple stochastic rupture model simulations. This simple approach was also extended to estimate the entire EP curve of the tsunami risk parameter by selecting a set of target probability levels and selecting a small number of stochastic rupture models per probability level. For this case study, with less than 50 high-resolution tsunami inundation simulations, stable and satisfactory performances of this simple procedure were demonstrated, in comparison with more comprehensive high-resolution tsunami simulation results based on 1200 stochastic rupture models.
Footnotes
Declaration of conflicting interests
The author(s) declared no potential conflicts of interest with respect to the research, authorship, and/or publication of this article.
Funding
The author(s) disclosed receipt of the following financial support for the research, authorship, and/or publication of this article: The work is funded by the Canada Research Chair program (950-232015) and the NSERC Discovery Grant (RGPIN-2019-05898).
Data availability statements
The relative plate motion velocities shown in Figure 1 was obtained from https://www.unavco.org/software/geodetic-utilities/plate-motion-calculator/plate-motion-calculator.html. The GEBCO 2021 data were obtained from https://www.gebco.net/. The CHS data were obtained from https://www.charts.gc.ca/data-gestion/index-eng.html. The CDEM data were obtained from ![]() . The local bathymetry and elevation data and the building exposure data for the District of Tofino are proprietary.
. The local bathymetry and elevation data and the building exposure data for the District of Tofino are proprietary.