
Abstract
Background:
Monocarboxylate transporters (MCTs) facilitate lactate transfer and support cancer cell survival and metastasis. MCT1 and MCT4 expression has been associated with poor prognosis and resistance to therapy with tyrosine kinase inhibitors.
Objectives:
This pilot study examined the relevance of MCT1 and MCT4 expression in circulating tumour cells (CTCs) isolated from non-small cell lung cancer (NSCLC) patients during osimertinib treatment through single-cell analysis.
Design:
Fifty-three NSCLC patients were enrolled at three different time points: baseline (n = 53), post-first cycle (n = 20) and progressive disease (PD; n = 21), to evaluate MCT1 and MCT4 expression in patients’ samples.
Methods:
CTCs were isolated with the ISET platform. MCT1/MCT4 expression was assessed using immunofluorescence triple staining experiments and confocal laser scanning microscopy.
Results:
CTCs were detected in 75% (40/53), 40% (8/20) and 29% (6/21) of patients at baseline, post-first cycle and PD, respectively. Among cytokeratin (CK)-positive patients, MCT1 was overexpressed at all time points in a significant percentage: 67% (18/27) at baseline, 57% (4/7) at post-first cycle and 50% (2/4) at PD. Similarly, MCT4 was overexpressed in 55% (16/29), 50% (2/4) and 60% (3/5) of cases, respectively. Statistical analysis revealed that the (CK+MCT1−CD45−) phenotype was associated with worse progression-free survival [PFS; log rank, p = 0.041, hazard ratio (HR) = 1.971] and overall survival (log rank, p = 0.028; HR = 2.288) of the patients. Conversely, the presence of ⩾3 MCT4+ CTCs was correlated with poorer PFS (log rank, p = 0.042, HR = 4.189). Significant inverse correlations were observed between MCT1 and MCT4 expression, implying their distinct biological roles.
Conclusion:
MCT1 and MCT4 are overexpressed in CTCs from NSCLC patients, supporting their potential as prognostic biomarkers and therapeutic targets.
Plain language summary
During cancer development, a subset of tumour cells, known as circulating tumour cells (CTCs), can detach from the primary tumour and enter the bloodstream. These cells are widely recognized as key contributors to disease progression, metastasis, and resistance to therapy. This pilot study investigated new prognostic biomarkers expressed in CTCs. Particularly, two monocarboxylate transporters (MCTs), MCT1 and MCT4, were evaluated in CTCs from non-small cell lung cancer (NSCLC) patients, undergoing osimertinib (anti-EGFR tyrosine kinase inhibitor) treatment. These transporters are involved in cancer cell metabolism and are associated with cancer invasion and resistance to therapy. Blood samples were collected from 53 patients at three time points: before treatment (baseline), after the first cycle of therapy, and at the time of disease progression. CTCs were isolated and analyzed using immunofluorescence experiments and confocal laser scanning microscopy. The current study demonstrated that both MCT1 and MCT4 are overexpressed in CTCs and their expression was significantly and inversely correlated with disease prognosis. Specifically, the absence of MCT1 expression and the presence of MCT4-positive CTCs were associated with worse clinical outcome. A reverse correlation between MCT1 and MCT4 expression was also observed, implying that these transporters contribute to cancer progression through distinct biological roles. These findings underscore the prognostic relevance of MCT1 and MCT4 and further support their potential as therapeutic targets for NSCLC patients.
Keywords
Introduction
Despite significant advancements in lung cancer treatment, the management of non-small cell lung cancer (NSCLC) remains challenging, particularly for patients with epidermal growth factor receptor (EGFR) mutations. 1 Approximately, 15% of NSCLC patients bear mutations in the tyrosine kinase domain of EGFR, and tyrosine kinase inhibitors (TKIs) represent the recommended standard of care. 2 However, 60% of patients develop resistance to these treatments because of the T790M mutation in EGFR exon 20. 3 Osimertinib, a third-generation EGFR TKI, has shown clinical efficacy in NSCLC patients who develop resistance to first- and second-generation TKIs.
Over the years, liquid biopsy has strengthened its position in the fight against cancer, including lung cancer. Due to its non-invasive nature, it provides a wide range of real-time information regarding early detection, tumour progression, minimal residual disease, response to treatment and detection of resistance. 4 Particularly, it has been suggested to overcome tissue biopsy limitations, mainly due to a repertoire of analytical tools, including circulating tumour cells (CTCs), circulating tumour DNA or extracellular vesicles isolated from peripheral blood and other body fluids. 5 CTCs are crucial players in lung cancer progression, particularly during the metastatic cascade, thereby harbouring an evident role in clinical application. 6 Notably, CTCs disseminate from the primary tumour into the bloodstream, undergo epithelial-to-mesenchymal transition, infiltrate distant organs and ultimately form metastatic lesions. 7
CTCs have shown a profound prognostic value for various tumour types, including NSCLC.8–10 They represent a rare cell population, with metastatic patients harbouring 0–10 CTCs/mL of blood. 11 Despite their low abundance, new techniques have been developed for their isolation and enrichment. It is worth noting that enumeration of CTCs can provide important information on disease progression, response to treatment and prediction of metastasis.12,13 Furthermore, CTCs usually encompass different tumoural clones, reflecting the heterogeneity of the primary tumours; hence, phenotypic characterization of these cells and identification of novel biomarkers further extend their utility.6,14
Metabolic reprogramming is characterized as an emerging hallmark of cancer. 15 Adjustments in various metabolic pathways, including glycolysis, enhance the rapid proliferation of cancer cells, contributing to their more aggressive phenotype. 16 Cancer cells produce energy through aerobic glycolysis, in which lactate is secreted, even in the presence of oxygen, a phenomenon known as the ‘Warburg effect’. 17 Monocarboxylate transporters (MCTs) are responsible for transporting lactate, pyruvate and other monocarboxylic acids across cell plasma membrane. 18 Among this family, MCT1 and MCT4 have been intensively studied. These transporters regulate lactate levels within the tumour microenvironment (TME), thus mediating cell survival, angiogenesis and metastasis; while MCT1 holds an important role in both lactate influx and efflux under homeostatic conditions, MCT4 only participates in the latter.19,20
MCT1 and MCT4 have been implicated in lung cancer cell invasion and, therefore, have been portrayed as potential therapeutic targets. 21 Particularly, their overexpression has been reported in various cancer types, including NSCLC, while several studies have further associated their expression with disease prognosis.16,22–25 Additional evidence suggests that MCTs, particularly MCT1, exhibit a pivotal role in the development of resistance to TKI therapies, indicating metabolic adaptations in response to therapy.26,27
We have previously reported, using RT-qPCR analysis, that MCT1 and MCT4 mRNA levels are increased in CTCs isolated from early-stage NSCLC patients, while MCT4 overexpression has been correlated with poor survival in these patients.28,29 The current study aimed to investigate the expression of MCT1 and MCT4 at the single-cell protein level in CTCs derived from EGFR-mutant NSCLC patients treated with osimertinib, to determine their role in treatment resistance and assess their potential prognostic clinical significance.
Materials and methods
Patients and clinical samples
Fifty-three NSCLC patients (median age 67 years old, range 39–87) were enrolled in the current study. Patients with histologically confirmed EGFR-mutant NSCLC exhibiting disease progression after first- or second-generation EGFR TKI therapy were subsequently treated with osimertinib. Patients had to fulfil the standard clinical study inclusion and exclusion eligibility criteria, as shown in Supplemental Data 1. Patients’ characteristics, including clinical and pathological data, are summarized in Supplemental Table 1. Peripheral blood samples (20 mL in EDTA tubes) were collected in the middle of the vein puncture, following the discard of the first 5 mL, to avoid contamination from skin epithelial cells during sample collection. Blood was collected at baseline (n = 53 patients), following the first cycle of therapy (n = 20 patients), and at the time of progressive disease (PD; n = 21 patients). Fewer patient samples were available at post-first cycle and PD compared to baseline, due to withdrawal of consent, loss to follow-up, early treatment discontinuation and/or patient death.
Cancer cell lines and cytospins’ preparation
Control experiments were performed using H1299 cells, a metastatic lymph node-derived NSCLC cell line. H1299 were obtained from the American Type Culture Collection (Manassas, VA, USA). H1299 cells were cultured in Dulbecco’s modified Eagle medium (Thermo Fisher Scientific, Waltham, MA, USA), supplemented with 10% fetal bovine serum (FBS; PAN-Biotech, Aidenbach, Germany) and 50 U/mL penicillin and 50 μg/mL streptomycin. Cells were maintained at 37°C in a humidified atmosphere of 5% CO2. Sub-cultivation was performed with 0.25% trypsin and 5 mM EDTA (Thermo Fisher Scientific, Waltham, MA, USA). In order to mimic the CTC microenvironment in the control samples, H1299 cells were spiked with healthy donors’ peripheral blood mononuclear cells (PBMCs) at a ratio of 1,000:100,000.
Isolation of CTCs
CTCs were isolated using the ISET microfiltration platform (Rarecells, Paris, France), according to the manufacturer’s instructions. 10 mL of blood sample were diluted in 1/10 ISET buffer for 10 min at room temperature (RT), followed by filtration of the sample. Membranes were then stored at −20°C, until immunofluorescence experiments.
Triple immunofluorescence and confocal imaging
Spiked cancer cell lines staining/positive and negative controls
Triple immunofluorescence experiments were performed using cytokeratin (CK), CD45 and either MCT1 or MCT4 antibodies for the detection of MCT1 and MCT4, respectively. Antibody details are provided in Supplemental Table 2.
Four control samples were stained in each experiment: the positive control was stained with all primary and secondary antibodies, while the negative controls were devoid of one primary antibody and stained with the corresponding secondary antibodies. Control cytospins were washed with phosphate-buffered saline (PBS) for 5 min and then fixed and permeabilized using ice-cold acetone/methanol (9:1) for 20 min. Cells were washed thrice with PBS for 5 min, followed by blocking with 5% FBS in PBS overnight at 4°C. For the combination of CK/MCT1/CD45, cells were first incubated with a mix of mouse CK7 (1:100; OV-TL 12/30, Invitrogen; Thermo Fisher Scientific, Carlsbad, CA, USA) and A45 B/B3 (1:70; (Amgen Research (Munich) GmbH, Munich, Germany; Mouse IgG1 A45 B/B3 anti-human cytokeratin)) antibodies in 1% FBS in PBS for 1 h, washed 3 times with PBS and incubated with a donkey anti-mouse Alexa Fluor™ 555 secondary antibody (1:500; Invitrogen A31570; Thermo Fisher Scientific, Carlsbad, CA, USA) for 45 min. Cells were washed thrice with PBS and incubated with mouse MCT1AF488 (1:50; Santa Cruz Biotechnology, Santa Cruz, CA, USA, sc-365501 AF488) antibody for 1 h. Finally, they were washed three times with PBS and incubated with mouse CD45AF647 (1:100; Santa Cruz Biotechnology, Santa Cruz, CA, USA, sc-1178 AF647) antibody for 1 h. A drop of DAPI-containing antifade medium (Cell Signaling Technology, Danvers, MA, USA) was added to the slides and they were stored at −20°C. The same process was followed for the combination of antibodies against CK/MCT4/CD45, where the mouse MCT4AF488 antibody (1:50; Santa Cruz Biotechnology, Santa Cruz, CA, USA, sc-376140 AF488) was used instead of MCT1.
ISET membranes staining
Patients’ samples on ISET filters were washed with PBS for 5 min and permeabilized with 0.5% Triton-X-100 for 10 min. Filters were then washed three times with PBS and blocked with 5% FBS in PBS overnight at 4°C. Triple immunofluorescence experiments were performed, following the same methodology as in the control samples.
Samples were analyzed using the Leica TCS SP8 confocal microscope (Leica Microsystems GmbH, Wetzlar, Germany). Both control and patients’ samples were observed using a 40× oil-immersion objective. Controls were used to ensure absence of cross reactivity between antibodies and detect potential bleed-through between the different channels. CTCs exhibit the following morphological characteristics: a cell diameter of 10 μm or longer, a high nuclear-to-cytoplasmic ratio and/or double nuclei.30,31 MCT1 and MCT4 expression was characterized as positive (+) or negative (−), using ImageJ Software v1.54g (National Institutes of Health, USA). Biomarker intensity was measured individually in all isolated CTCs. The analysis focused on identifying CTC overexpression, as both MCT1 and MCT4 are also expressed in PBMCs. Median fluorescence intensity was calculated across all CTCs within the patients’ sample, and this number was used as a cut-off value for overexpression (14 and 32 for MCT1 and MCT4, respectively). Distinct CTCs exceeding this cut-off value were classified as positive, while CTCs with lower threshold values were characterized as negative. Background fluorescence was quantified by four independent background measurements obtained per sample.
Statistical analysis
Statistical analysis was performed using the GraphPad Prism 8.0.1 (GraphPad Software, San Diego, CA, USA) and the IBM SPSS Statistics 29.0.2.0 software (IBM corp., Armonk, NY, USA). Kaplan–Meier survival analysis and Cox regression analysis were performed to estimate progression-free survival (PFS) and overall survival (OS), as well as 1-year PFS and OS (PFS12m and OS12m, respectively) of NSCLC patients. PFS was defined as the time from patient enrolment in the study until relapse or death. OS was defined as the time from patient enrolment in the study until death from any cause. Moreover, Spearman’s rank correlation coefficient was used to investigate any correlation between MCT1 and MCT4 expression, as well as between MCT1 or MCT4 mRNA and protein expression. p < 0.05 was defined as a threshold for statistically significant results.
Reporting guidelines
The reporting of this study conforms to the REMARK (Reporting Recommendations for Tumor Marker Prognostic Studies) guidelines, 32 and the completed checklist is provided in Supplemental Table 3.
Results
Detection of CTCs in NSCLC patients
CTCs were detected based on the morphological criteria, as mentioned above. CTCs were positive for CK, an epithelial marker expressed in CTCs, but negative for CD45, a hematopoietic marker, used to exclude PBMCs. Based on CK-positive/CD45-negative staining, CTCs were detected in 40 out of 53 (75%) NSCLC patients at baseline, in 8 out of 20 (40%) patients after the first treatment cycle and 6 out of 21 (29%) at PD.
MCT1 expression in CTCs of NSCLC patients
MCT1 expression in patients’ samples was evaluated by immunofluorescence staining experiments. Intracellular distribution using confocal laser scanning analysis is shown in Figure 1(a). Positive and negative controls are shown in Supplemental Figure 1. Among the whole group of patients, the predominant phenotype at both baseline and after the first cycle of therapy was the (CK+MCT1+CD45−), accounting for 34% (18 out of 53) and 20% (4 out of 20), respectively. In contrast, at PD, only 10% (2 out of 21) of patients exhibited either (CK+MCT1+CD45−) or (CK+MCT1−CD45−) CTCs.

MCT1 expression in NSCLC patients’ CTCs. (a) Representative immunofluorescence images of a patient’s CTC. Cells were stained with CK (red), MCT1 (green) and the leukocyte marker CD45 (grey). Nuclei were stained with DAPI (blue). Overlay of all images is also presented. Bar scale: 10 μm. (b) Percentage of each phenotype based on MCT1 expression in CK-positive patients across all examined time points. (c) Mean percentage ± standard error of the mean (SEM) of each phenotype based on MCT1 expression in CTCs per patient at all time points. Each bar represents the average proportion of CTCs expressing a specific phenotype per individual.
Among CK-positive patients, MCT1 was overexpressed at baseline (67%; 18 out of 27) and after the first cycle of therapy (57%; 4 out of 7; p = ns). However, no difference in the percentages of patients harbouring the (CK+MCT1+CD45−) and (CK+MCT1−CD45−) phenotypes at PD (2 out of 4; Figure 1(b)) was observed. These findings were consistent when examining the total number of CTCs per patient, with most CTCs exhibiting the MCT1 positive phenotype at baseline (56% ± 9%/patient) and after the first cycle of therapy (57% ± 20%/patient). Finally, as shown in Figure 1(c), MCT1 expression was observed in 50% ± 29% of CTCs per patient at PD.
Clinical outcome according to MCT1 expression in CTCs
Survival analysis revealed that patients with ⩾3 CTCs at baseline had worse OS12m (14 months (range 12.9–15.1) vs 25 months (range 20.8–30.1), respectively; log rank, p = 0.003; Cox regression: p = 0.009, hazard ratio (HR) = 6.718) compared to those with <3 CTCs (Figure 2(a)). Interestingly, the absence of MCT1 in CTCs was a poor prognostic factor for both PFS (10 months (range 4.4–15.8) vs 19 months (range 12.7–25.8); log rank, p = 0.041; Cox regression: p = 0.045, HR = 1.971; Figure 2(b)) and OS (17 months (range 8.3–25.6) vs 33 months (range 25.5–40.2); log rank, p = 0.028; Cox regression: p = 0.032, HR = 2.288; Figure 2(c)).
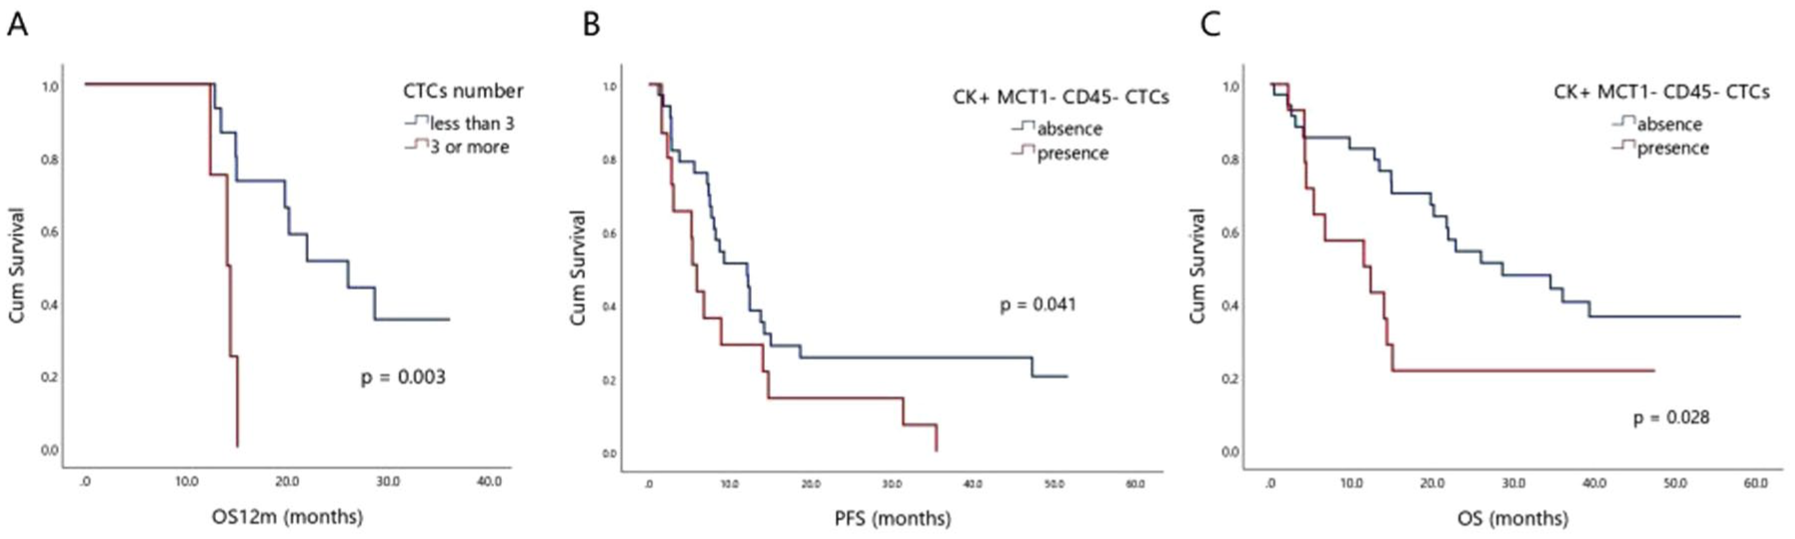
Clinical significance of CTCs and MCT1 expression. (a) Kaplan–Meier analysis of OS12m (log rank, p = 0.003; Cox regression: p = 0.009, HR = 6.718) according to the presence or absence of ⩾3 CTCs in patients at baseline. (b) Kaplan–Meier analysis of PFS (log rank, p = 0.041; Cox regression: p = 0.045, HR = 1.971). (c) Kaplan–Meier analysis of OS (log rank, p = 0.028; Cox regression: p = 0.032, HR = 2.288) according to the presence or absence of MCT1 in patients’ CTCs at baseline.
MCT4 expression in CTCs of NSCLC patients
MCT4 expression was evaluated in the same cohort of patients. Intracellular distribution using immunofluorescence experiments and confocal laser scanning analysis is shown in Figure 3(a). Positive and negative controls are shown in Supplemental Figure 2. Among total patients, the phenotype (CK+MCT4+CD45−) was identified in 30% (16 out of 53) of patients at baseline, 10% (2 out of 20) of patients following the first cycle of therapy and 14% (3 out of 21) of patients at PD. However, (CK+MCT4−CD45−) CTCs were observed at higher frequencies at these time points, accounting for 40% (21 out of 53), 10% (2 out of 20) and 19% (4 out of 21) of patients, respectively.

MCT4 expression in NSCLC patients’ CTCs. (a) Representative immunofluorescence images of a patient’s CTC. Cells were stained with CK (red), MCT4 (green) and the leukocyte marker CD45 (grey). Nuclei were stained with DAPI (blue). Overlay of all images is also presented. Bar scale: 10 μm. (b) Percentage of each phenotype based on MCT4 expression in CK-positive patients across all examined time points. (c) Mean percentage ± SEM of each phenotype based on MCT4 expression in CTCs per patient at all time points. Each bar represents the average proportion of CTCs expressing a specific phenotype per individual.
Regarding CK-positive patients, MCT4 was overexpressed in 55% (16 out of 29), 50% (2 out of 4) and 60% (3 out of 5) of patients at baseline, post-first cycle and PD, respectively, while the percentages of patients exhibiting (CK+MCT4−CD45−) CTCs were 72% (21 out of 29), 50% (2 out of 4) and 80% (4 out of 5) at the corresponding time points (Figure 3(b)). Finally, in terms of CTC frequency/patient, CTCs with the (CK+MCT4+CD45−) phenotype accounted for 43% ± 8%, 50% ± 29% and 43% ± 19% of patients at baseline, post-first cycle of therapy and PD, respectively (Figure 3(c))
Clinical outcome according to MCT4 expression in CTCs
Kaplan–Meier analysis revealed that, at baseline, the presence of ⩾3 CTCs was associated with worse PFS (5 months (range 1.5–7.8) vs 18 months (range 12.2–22.9), respectively; log rank, p = 0.018; Cox regression: p = 0.027, HR = 3.388), compared to patients with <3 CTCs (Figure 4(a)). Moreover, patients harbouring ⩾3 CTCs with (CK+MCT4+CD45−) phenotype had poorer PFS (Figure 4(b)), compared to patients with <3 (CK+MCT4+CD45−) CTCs (4 months (range 1.6–6.5) vs 17 months (range 11.8–22.2), respectively; log rank, p = 0.042, HR = 4.189).

Clinical significance of CTCs and MCT4 expression. (a) Kaplan–Meier analysis of PFS (log rank, p = 0.018; Cox regression: p = 0.027, HR = 3.388) according to the presence or absence of ⩾3 CTCs in patients at baseline. (b) Kaplan–Meier analysis of PFS (log rank, p = 0.042, HR = 4.189) according to the presence or absence of ⩾3 CTCs with the (CK+MCT4+CD45−) phenotype in patients at baseline.
Correlation between MCT1 and MCT4 mRNA and protein expression in patients’ CTCs
Spearman analysis was performed to evaluate potential correlations between phenotypes regarding MCT1 and MCT4 expression. Statistically significant correlations at the three different time points are shown in Table 1.
Correlations between MCT1 and MCT4 protein expression.

CK, cytokeratin; MCT, monocarboxylate transporters.
Interestingly, the presence of the MCT4 phenotype was statistically correlated with the absence of MCT1 at baseline. Accordingly, at post-first cycle, the presence of the MCT1-positive phenotype was correlated with the absence of MCT4 expression in CTCs.
Previous studies from our group have also evaluated MCT1 and MCT4 mRNA expression in CTCs derived from 12 out of 53 NSCLC patients, using RT-qPCR analysis.28,29 Spearman analysis showed a negative correlation between (CK+MCT4–CD45–) CTCs and fold change of MCT4 mRNA levels in CTCs (p = 0.023, rho = –0.649); however, no additional positive correlations were detected.
Discussion
The current study enrolled EGFR-mutant NSCLC patients at three distinct time points of evaluation, during their salvage treatment with osimertinib. CTCs were detected in 75% of patients at baseline, reduced to 40% at post-first cycle and 29% at PD, respectively. As previously discussed, enumeration of CTCs represents a valuable diagnostic tool that can refine disease prognosis and predict therapeutic response. However, their isolation remains a major challenge owing to their heterogeneity and low abundance. In this study, CTCs were isolated using the ISET microfiltration platform. We, among others, have previously shown the improved sensitivity of this technological platform, compared to conventional isolation methods in patients with different tumour types, including NSCLC.33–35 Particularly, in recent studies including EGFR-mutant NSCLC patients during osimertinib treatment, we reported a significant reduction of CTCs after the first treatment cycle compared to baseline levels.36,37 Our findings are comparable to the previous studies, indicating an initial therapeutic response associated with a reduction of CTC count (75% vs 40%). However, during PD, the total CTC number appears to be reduced compared to the respective number at baseline. This observation may be explained by therapy-driven selection of subclones with a fully mesenchymal phenotype lacking CK expression. These subclones are potentially responsible for the reduced number of CK-positive cells detected in the bloodstream at the time point of PD. Alternatively, it is also possible that osimertinib selectively eliminates CK-positive CTCs.
The presence of CTCs in the bloodstream has been previously correlated with poorer OS and PFS in NSCLC patients.38–40 A recent study enrolling stage III and IV NSCLC patients revealed that the detection of CTCs in the blood was associated with significantly worse PFS and OS. 41 Similarly, in advanced NSCLC patients treated with immune checkpoint inhibitors, it was shown that the detection of CTCs before treatment was correlated with worse PFS and OS. 42 It is noteworthy that the prognostic and predictive value of CTCs in NSCLC patients was independent of the detection method. 43 In the current study, survival analysis revealed that patients harbouring ⩾3 CTCs at baseline exhibited significantly poorer OS12m and PFS. These findings agree with the above-mentioned studies, highlighting the role of CTCs in metastatic dissemination and their potential utility in clinical practice.
Numerous studies have reported increased levels of MCT1 and MCT4 across multiple cancer types, including NSCLC.16,22–25 The TNM plot data analysis (

Expression of SLC16A1 and SLC16A3 in lung tissues. TNM violin plots of (a) SLC16A1 and (b) SLC16A3 gene expression in normal, tumour and metastatic lung tissues. Violin plots showing data density and mean/standard deviation for each tissue (green, red and yellow colouring). The violin plots represent the profile of normal lung, lung invasive carcinoma and metastatic lung tissues, mining gene chip data from GEO, GTEx, TCGA and TARGET databases.
Regarding MCT1 expression in CTCs, the only available data come from Zafeiriadou et al. 29 study. In this manuscript, the authors, using RT-qPCR analysis, demonstrated a statistically significant increase of MCT1 mRNA levels in CTC fractions isolated from NSCLC patients at baseline, compared to healthy donors’ samples (p = 0.005). 29 The current study examined the expression of MCT1 and MCT4 at the single-cell level in CTCs isolated from NSCLC patients treated with osimertinib, to explore potential resistant mechanisms and new therapeutic targets. Specifically, among CK-positive patients, (CK+MCT1+CD45−) tumour cells were identified at a considerable frequency across all three time points, suggesting that MCT1 holds a significant role throughout disease progression. Our findings are consistent with mRNA expression data, although the percentages differ across clinical stages (32.6% of patients at baseline, 17.9% after 1 month of treatment and 30% at PD). 29 These differences could be attributed to the methodology of the above-mentioned molecular analysis, where each biomarker was examined independently. As a result, concordance between epithelial markers and MCT1 expression was not assessed. In contrast, in the current study, cells were examined simultaneously for CKs (tumour marker), CD45 (hematopoietic marker) and MCT1. MCT1 was overexpressed in CTCs of NSCLC patients at baseline, while it appeared reduced after the first cycle of treatment, suggesting that this CTC subclone is potentially targeted by osimertinib.
A recent systematic review has reported that MCT1 overexpression has been associated with poor patients’ survival in various cancer types. 16 However, in NSCLC, results were contradictory, as MCT1 expression was related to either increased or decreased survival or did not have any impact on patient PFS and OS.22,23,44–46 Previous studies have demonstrated that MCT1 is highly expressed in both cancer and stromal cells, with the absence of MCT1 in cancer cells being a poor prognostic factor for NSCLC patients. 23 On the contrary, other studies did not report any association between MCT1 expression and patients’ clinical outcome.22,44 In the current study, survival analysis revealed that the detection of (CK+MCT1−CD45−) CTCs was associated with significantly lower PFS and OS. These results suggest that the absence of MCT1 expression in CTCs is potentially a poor prognostic factor for patients, in agreement with the aforementioned study in primary tumours of NSCLC patients. 23
MCT4 has been reported to be overexpressed in primary tumours in NSCLC patients, at a rate of 45%, compared to adjacent non-cancerous lung tissues. 22 Takenaga et al. 24 also revealed that MCT4 is overexpressed in NSCLC tissues carrying pathogenic mitochondrial nicotinamide adenine dinucleotide dehydrogenase (NADH) gene mutations, with similar results being observed in KRAS-mutated lung adenocarcinomas (p = 10−7). 25 Markou et al. 28 have previously shown increased MCT4 mRNA levels in CTCs of early-stage NSCLC patients compared to healthy individuals. The current study clearly demonstrated that MCT4 is highly expressed in CTCs of NSCLC patients during osimertinib treatment. Importantly, the percentage of these cells did not show significant variation during therapy, suggesting that this CTC subclone is resistant to osimertinib. MCT4 expression likely contributes to CTC viability by supporting metabolic adaptations, independently of EGFR signalling blockade. This observation is consistent with previous findings in NSCLC cell lines, where MCT4 expression did not significantly differ between EGFR inhibitor-resistant and -sensitive cells. 26
The clinical value of MCT4 expression has been examined in different cancer types, including NSCLC, and has been reported to be associated with patients’ clinical outcome.22,47–49 Notably, in adenocarcinoma cases, MCT4 expression has been significantly associated with decreased OS. 50 Moreover, co-expression of glucose transporter 1 and MCT4 was also correlated with significantly worse NSCLC patients’ survival.23,51 In addition, Markou et al. 28 have evaluated the MCT4 mRNA levels in CTCs isolated from early-stage NSCLC patients and reported that overexpression of MCT4 is significantly associated with poorer PFS. In concordance with those results, the current study examined the prognostic value of MCT4 expression at a single-cell level in CTCs isolated from EGFR-mutant NSCLC patients. Survival analysis revealed that the detection of ⩾3 CTCs expressing MCT4 was associated with decreased PFS, suggesting the key role of MCT4-positive CTCs in patients’ clinical outcome and tumour aggressiveness.
The distinct biological role of MCT1 and MCT4 in patients’ outcome, although both of them regulate lactate levels, could be attributed to their different biochemical properties.22,23,50,52 Specifically, MCT1 mediates lactate transport with high affinity inside and outside the cells and is typically expressed in non-glycolytic, oxidative tumour cells. In contrast, MCT4 has a lower affinity for lactate and is primarily expressed in glycolytic cells, serving as the main lactate exporter. Consequently, lactate accumulation within the TME causes extracellular acidification, inducing immune tolerance and angiogenesis. 53 These effects contribute to a tumour-supportive microenvironment for cancer cell survival and proliferation, leading to cancer progression. Importantly, the therapeutic relevance of this distinction is demonstrated by the selective MCT1 inhibitor ADZ3965, which induces lactate accumulation and metabolic alterations only in cancer cell lines with low or absent MCT4 expression. This finding underscores their distinct functions in tumour metabolism. 54
Furthermore, MCT1 has a high affinity for other monocarboxylic acids, such as pyruvate. Therefore, pyruvate can be exported out of cells, preventing the renewal of NAD+, which is an essential cofactor in the glycolytic pathway, and its absence can ultimately lead to cell death. 48 Reduced intracellular pyruvate levels further limit substrate availability for gluconeogenesis and decrease the flux through the Krebs cycle and oxidative phosphorylation. This results in diminished cellular respiration, growth and cell survival. 55 Furthermore, Krebs cycle supplies critical intermediates for fatty acid, nucleic acid and amino acid biosynthesis; thus, its disruption may further impair metabolic adaptability and cell viability. 56 In agreement with that, our results indicate that the absence of MCT1 [CTCs bearing the (CK+MCT1−CD45-) phenotype] could serve as a poor prognostic factor for NSCLC patients. MCT1 may contribute to cancer cell death, due to the potential resistance of CTCs to metabolic stress and their ability to sustain glycolysis and, consequently, adenosine triphosphate production. Additionally, osimertinib has been reported to act via MCT1/LKB1/AMPK signalling, thereby inducing autophagy in cancer cells. Consistent with these findings, our data show that low MCT1 expression may predict poor response to osimertinib, supporting its potential role as a predictive biomarker. 57 The distinct cellular functions of these transporters were further confirmed by the significant inverse correlation between MCT1 and MCT4 CTC phenotypes in NSCLC patients.
A limitation of this study was the decreased number of patients after the first cycle of treatment and at PD, which may have introduced attrition bias. The smaller sample size reduces the ability to detect changes in CTC subpopulations during therapy, potentially missing clinically significant effects at the other time points. It is plausible that a lower dropout rate could have enabled the detection of these effects. However, as this was a pilot study and the survival analyses were conducted on the entire patient cohort at baseline, this limitation is unlikely to have substantially influenced the main findings. Nevertheless, validation in a larger patient cohort with samples at multiple time points is required to confirm the clinical relevance of MCT1/MCT4 expression in CTCs.
Conclusion
MCT1 and MCT4 expression was evaluated in CTCs isolated from NSCLC patients, at a single-cell level. Their expression was inversely associated with patients’ survival. The reverse correlation between MCT1 and MCT4 further suggests their distinct biological roles during cancer progression, implying that they could serve as important biomarkers and potential therapeutic targets to prevent metastatic dissemination.
Supplemental Material
sj-docx-1-tam-10.1177_17588359261416422 – Supplemental material for Metabolic marker profiling of circulating tumour cells in NSCLC patients treated with osimertinib: focus on MCT1 and MCT4
Supplemental material, sj-docx-1-tam-10.1177_17588359261416422 for Metabolic marker profiling of circulating tumour cells in NSCLC patients treated with osimertinib: focus on MCT1 and MCT4 by Karolina Mangani, Evangelia Pantazaka, Evi Lianidou, Vassilis Georgoulias, Athanasios Kotsakis, Athina Markou and Galatea Kallergi in Therapeutic Advances in Medical Oncology
Supplemental Material
sj-docx-2-tam-10.1177_17588359261416422 – Supplemental material for Metabolic marker profiling of circulating tumour cells in NSCLC patients treated with osimertinib: focus on MCT1 and MCT4
Supplemental material, sj-docx-2-tam-10.1177_17588359261416422 for Metabolic marker profiling of circulating tumour cells in NSCLC patients treated with osimertinib: focus on MCT1 and MCT4 by Karolina Mangani, Evangelia Pantazaka, Evi Lianidou, Vassilis Georgoulias, Athanasios Kotsakis, Athina Markou and Galatea Kallergi in Therapeutic Advances in Medical Oncology
Supplemental Material
sj-docx-3-tam-10.1177_17588359261416422 – Supplemental material for Metabolic marker profiling of circulating tumour cells in NSCLC patients treated with osimertinib: focus on MCT1 and MCT4
Supplemental material, sj-docx-3-tam-10.1177_17588359261416422 for Metabolic marker profiling of circulating tumour cells in NSCLC patients treated with osimertinib: focus on MCT1 and MCT4 by Karolina Mangani, Evangelia Pantazaka, Evi Lianidou, Vassilis Georgoulias, Athanasios Kotsakis, Athina Markou and Galatea Kallergi in Therapeutic Advances in Medical Oncology
Supplemental Material
sj-docx-4-tam-10.1177_17588359261416422 – Supplemental material for Metabolic marker profiling of circulating tumour cells in NSCLC patients treated with osimertinib: focus on MCT1 and MCT4
Supplemental material, sj-docx-4-tam-10.1177_17588359261416422 for Metabolic marker profiling of circulating tumour cells in NSCLC patients treated with osimertinib: focus on MCT1 and MCT4 by Karolina Mangani, Evangelia Pantazaka, Evi Lianidou, Vassilis Georgoulias, Athanasios Kotsakis, Athina Markou and Galatea Kallergi in Therapeutic Advances in Medical Oncology
Supplemental Material
sj-docx-7-tam-10.1177_17588359261416422 – Supplemental material for Metabolic marker profiling of circulating tumour cells in NSCLC patients treated with osimertinib: focus on MCT1 and MCT4
Supplemental material, sj-docx-7-tam-10.1177_17588359261416422 for Metabolic marker profiling of circulating tumour cells in NSCLC patients treated with osimertinib: focus on MCT1 and MCT4 by Karolina Mangani, Evangelia Pantazaka, Evi Lianidou, Vassilis Georgoulias, Athanasios Kotsakis, Athina Markou and Galatea Kallergi in Therapeutic Advances in Medical Oncology
Supplemental Material
sj-pdf-5-tam-10.1177_17588359261416422 – Supplemental material for Metabolic marker profiling of circulating tumour cells in NSCLC patients treated with osimertinib: focus on MCT1 and MCT4
Supplemental material, sj-pdf-5-tam-10.1177_17588359261416422 for Metabolic marker profiling of circulating tumour cells in NSCLC patients treated with osimertinib: focus on MCT1 and MCT4 by Karolina Mangani, Evangelia Pantazaka, Evi Lianidou, Vassilis Georgoulias, Athanasios Kotsakis, Athina Markou and Galatea Kallergi in Therapeutic Advances in Medical Oncology
Supplemental Material
sj-pdf-6-tam-10.1177_17588359261416422 – Supplemental material for Metabolic marker profiling of circulating tumour cells in NSCLC patients treated with osimertinib: focus on MCT1 and MCT4
Supplemental material, sj-pdf-6-tam-10.1177_17588359261416422 for Metabolic marker profiling of circulating tumour cells in NSCLC patients treated with osimertinib: focus on MCT1 and MCT4 by Karolina Mangani, Evangelia Pantazaka, Evi Lianidou, Vassilis Georgoulias, Athanasios Kotsakis, Athina Markou and Galatea Kallergi in Therapeutic Advances in Medical Oncology
Footnotes
Acknowledgements
The authors thank Vanesa Korbaki for her support in project management.
Declarations
ORCID iDs
Supplemental material
Supplemental material for this article is available online.
References
Supplementary Material
Please find the following supplemental material available below.
For Open Access articles published under a Creative Commons License, all supplemental material carries the same license as the article it is associated with.
For non-Open Access articles published, all supplemental material carries a non-exclusive license, and permission requests for re-use of supplemental material or any part of supplemental material shall be sent directly to the copyright owner as specified in the copyright notice associated with the article.