
Abstract
Background:
Metastatic gastric cancer (GC) is biologically heterogeneous; however, current staging classifies all metastatic cases as stage IV without reflecting this variability. Circulating tumor DNA (ctDNA)-derived biomarkers, including maximum somatic allele frequency (MSAF), may serve as surrogates for tumor burden and underlying tumor biology.
Objectives:
This study aimed to evaluate the prognostic significance of baseline MSAF in patients with metastatic GC receiving first-line palliative chemo or chemoimmunotherapy.
Design:
This was a retrospective, single-center cohort study of consecutively tested patients.
Methods:
We analyzed 108 patients with pathologically confirmed metastatic gastric adenocarcinoma who underwent baseline ctDNA next-generation sequencing prior to first-line systemic therapy between December 2022 and April 2024. MSAF was defined as the highest variant allele frequency detected in ctDNA and evaluated as both a continuous and categorical variable. Patients were stratified into MSAF-high and MSAF-low groups using the cohort mean (12.31%) as the cutoff. Overall survival (OS) and progression-free survival (PFS) were assessed using Kaplan–Meier estimation and Cox proportional hazards regression analyses.
Results:
The MSAF-high group (n = 41) demonstrated significantly inferior OS compared with the MSAF-low group (n = 67; median OS, 10.0 vs 17.6 months; log-rank p = 0.006). PFS showed a nonsignificant trend favoring the MSAF-low group (median PFS, 4.5 vs 8.0 months; p = 0.1). In multivariate analysis (complete-case analysis, n = 70), high MSAF remained independently associated with worse OS (hazard ratio, 2.14; 95% confidence interval: 1.04–4.41; p = 0.039), along with older age and multiple metastatic sites. Tumors in the MSAF-high group more frequently exhibited molecular features such as deficient mismatch repair and high tumor mutational burden.
Conclusion:
Baseline MSAF is an independent prognostic biomarker in metastatic GC and may reflect underlying biological aggressiveness. Incorporating MSAF into risk stratification frameworks could enhance prognostic classification and inform personalized treatment strategies.
Keywords
Introduction
Gastric cancer (GC) is the fifth most common malignancy and the third leading cause of cancer-related death worldwide, with over 1 million new cases and 770,000 deaths annually. 1 Despite therapeutic advances, the prognosis for metastatic GC remains poor, with 5-year survival rates below 10%. 2 The current staging system, which includes the American Joint Committee on Cancer (AJCC) classification, categorizes all metastatic cases as stage IV. However, clinical observations suggest considerable variability in survival outcomes and disease courses within this group. This discrepancy highlights the limitations of anatomical staging and underscores the urgent need for biomarkers that better capture the biological heterogeneity of metastatic GC.3–5
Circulating tumor DNA (ctDNA) has emerged as a noninvasive biomarker to assess treatment response, detect minimal residual disease (MRD), and predict relapse across various solid tumors.6–8 In metastatic GC, however, ctDNA positivity alone provides limited discrimination of disease aggressiveness, as all patients are already classified as stage IV. Considering that the presence of ctDNA primarily reflects metastatic disease, the development of refined metrics is crucial for achieving a more precise assessment of disease status. One promising approach is maximum somatic allele frequency (MSAF), which may offer a more detailed assessment of tumor burden and biological heterogeneity. 9
MSAF, defined as the highest variant allele frequency in a ctDNA sample, has been recognized as a surrogate of tumor characteristics. Recent studies suggest that MSAF can serve as a marker of tumor burden, particularly in regard to its association with immunotherapy.10,11 Beyond tumor load, MSAF may also reflect cumulative tumor evolution and genomic complexity, features linked to aggressive disease biology. Elevated MSAF could indicate aggressive disease biology, manifested as rapid progression and poor treatment response. Consistent with this, studies in other cancer types have reported prognostic implications of MSAF, although its significance in metastatic GC remains poorly defined.12,13
The present study aimed to evaluate the prognostic significance of baseline ctDNA-derived MSAF in patients with metastatic GC. We hypothesized that MSAF may serve as a molecular surrogate of both tumor burden and disease aggressiveness, thereby stratifying survival outcomes within a population uniformly classified as stage IV. By capturing this biological heterogeneity, MSAF has the potential to refine risk stratification and guide treatment strategies in metastatic GC.
Methods
Study design
This single-center, retrospective study examined patients with metastatic GC who underwent ctDNA analysis at the Samsung Medical Center between December 2022 and April 2024 (Figure 1). A total of 178 patients were initially screened. Patients were excluded if they were referred to other hospitals for treatment (n = 15), did not receive chemotherapy (n = 2), or underwent ctDNA testing during chemotherapy (n = 53). Ultimately, the final analysis included 108 patients who underwent ctDNA analysis prior to the initiation of first-line palliative chemotherapy. The reporting of this study adheres to the STROBE (Strengthening the Reporting of Observational Studies in Epidemiology) guidelines. 14 The completed STROBE checklist is provided as a Supplemental File.

Gastric cancer patients undergoing ctDNA analysis.
ctDNA analysis
ctDNA was analyzed using next-generation sequencing (NGS) technology. TruSight Oncology 500 (TSO500) ctDNA assay (Illumina, San Diego, CA, USA) was used for ctDNA CGP. The TSO500 ctDNA assay provides hybrid capture-based fusion detection, similar to most other ctDNA CGP assays. Whole blood was collected from each patient into two Cell-Free DNA Collection Tubes (Roche, Basel, Switzerland). DNA was extracted manually from 8 mL of plasma with a QIAamp DSP Circulating NA Kit (Qiagen, Hilden, Germany) according to the manufacturer’s instructions. Libraries were prepared using 30 ng of input DNA, according to the TSO500 ctDNA assay protocol provided by the manufacturer. Subsequently, the library was enriched for 523 genes using a pool of target-specific oligos during two rounds of hybridization and target capture, followed by a final library amplification and cleanup. Quality control procedures before and after library preparation were performed using a Qubit (Thermo Fisher Scientific, Waltham, MA, USA) and a Cell-free DNA ScreenTape Assay (Agilent, Santa Clara, CA, USA). Sequencing was performed using an Illumina NovaSeq 6000 instrument with a read length of 2 × 150 bp, targeting 800 million reads per sample. Bioinformatic analyses were performed using the DRAGEN TSO500 ctDNA Analysis Software version 1.1.0 on an Illumina DRAGEN Server, according to the user guide provided by the manufacturer. The MSAF was determined as the highest allele frequency observed among all somatic mutations detected in the ctDNA. Tumor mutational burden (TMB) was calculated using the following formula:

MSAF analysis and cutoff definition
ctDNA was analyzed to determine the MSAF for each patient. MSAF values were treated both as continuous variables and as categorical variables based on a predefined cutoff. Due to the highly right-skewed distribution of MSAF values (range, 0.00%–39.34%), the mean value (12.31%) was selected as the cutoff to stratify patients into MSAF-high and MSAF-low groups. Median-based dichotomization was avoided because it resulted in an uneven distribution, clustering a large proportion of patients into the low MSAF group. In addition, receiver operating characteristic (ROC) analysis for overall survival (OS) yielded an area under the curve (AUC) of 0.57, indicating limited discriminatory power. Therefore, ROC-derived thresholds were considered suboptimal and were not used for group stratification.
Clinical data collection
Clinical characteristics, including age, sex, Eastern Cooperative Oncology Group (ECOG) performance status, disease status, human epidermal growth factor receptor 2 (HER2) status, programmed cell death-ligand 1 (PD-L1) status, Epstein–Barr virus (EBV) in situ hybridization results, and microsatellite instability (MSI) results, were collected and reviewed. PD-L1 expression was evaluated using PD-L1 immunohistochemistry (IHC) 22C3 or PD-L1 IHC 28-8 assays.
Statistical analysis
Descriptive statistics, including proportions and medians, were used for data analysis. Comparisons between groups for categorical variables were performed using Fisher’s exact test or the Chi-square test. Objective response rate (ORR) was defined as the proportion of patients who achieved a response. Disease control rate (DCR) was defined as the proportion of patients who achieved complete response (CR), partial response (PR), or stable disease (SD). Progression-free survival (PFS) and OS were assessed using the Kaplan–Meier method. PFS was measured from the start of treatment until disease progression or death, while OS was measured from the start of treatment until death from any cause or the last follow-up. Log-rank tests were used for comparisons, and both univariate and multivariate analyses were performed to estimate the associations between survival outcomes and clinical manifestations. We also estimated survival results using the Cox proportional hazards regression model. For biomarker variables with “unknown” values (PD-L1, MSI, and HER2), all cases were included in descriptive analyses and Kaplan–Meier curves for PFS and OS. However, for Cox proportional hazards models, observations with missing biomarker data were excluded, and complete-case analysis was applied to ensure model stability.
Data manipulation and statistical analysis were performed using Python 3.8.0, R (version 4.3.0; R Foundation for Statistical Computing, Vienna, Austria), SAS 9.3 (SAS Institute, Cary, NC, USA), and the Statistical Package for the Social Sciences (SPSS) software (version 24.0; IBM Corp., Armonk, NY, USA).
Ethics statement
The Samsung Medical Center Institutional Review Board (IRB) approved this study (approval number: IRB No. 2025-04-079-001). The study was conducted in compliance with the Declaration of Helsinki.
Results
Patients characteristics
A total of 108 patients with metastatic GC were included in the analysis. The patients were divided into two groups based on the mean MSAF of ctDNA: The MSAF-high group (n = 41, 38.0%) and the MSAF-low group (n = 67, 62.0%). The baseline demographic and clinical characteristics of these two groups were similar, with slight differences observed in molecular features and metastatic burden (Table 1). The median age was 63 years (range, 40–83) in the MSAF-high group and 60 years (range, 21–79) in the MSAF-low group. The distribution of males was comparable between the two groups, with a proportion of 68.3% in the MSAF-high group and 56.7% in the MSAF-low group (p = 0.320). Most patients exhibited a favorable performance status, as defined by an ECOG score of 0–1. However, the incidence of an ECOG score ⩾2 was marginally higher in the MSAF-high group (7.3%) compared to the MSAF-low group (0%), although this difference was not statistically significant (p = 0.101). The tumor location was identified as gastric in 73.1% of patients and gastroesophageal junction in 26.9%, exhibiting uniform distribution across both groups (p = 1.000). Prior surgical resection was observed in 69.4% of all patients, without a significant difference between MSAF-high and MSAF-low groups (26.8% vs 32.8%, p = 0.658). However, a statistically significant difference was observed in the number of metastatic sites between the two groups (p = 0.043). Patients in the MSAF-high group exhibited a higher proportion with ⩾3 metastatic sites. With respect to molecular characteristics, EBV positivity levels were comparable between the two groups (7.3% vs 4.5%, p = 0.228). Furthermore, the MSAF-high group exhibited a significantly higher frequency of deficient mismatch repair (dMMR; 12.2% vs 0%, p = 0.008). HER2 positivity and PD-L1 expression (combined positive score (CPS) ⩾5) did not differ significantly between groups (p = 0.340 and p = 0.166, respectively). The presence of ctDNA was detected in all patients in the MSAF-high group, and in 89.6% of patients in the MSAF-low group (p = 0.082). The MSAF-high group exhibited a substantially higher TMB compared to the MSAF-low group (58.5% vs 25.4%, p = 0.001).
Baseline characteristics of patients.
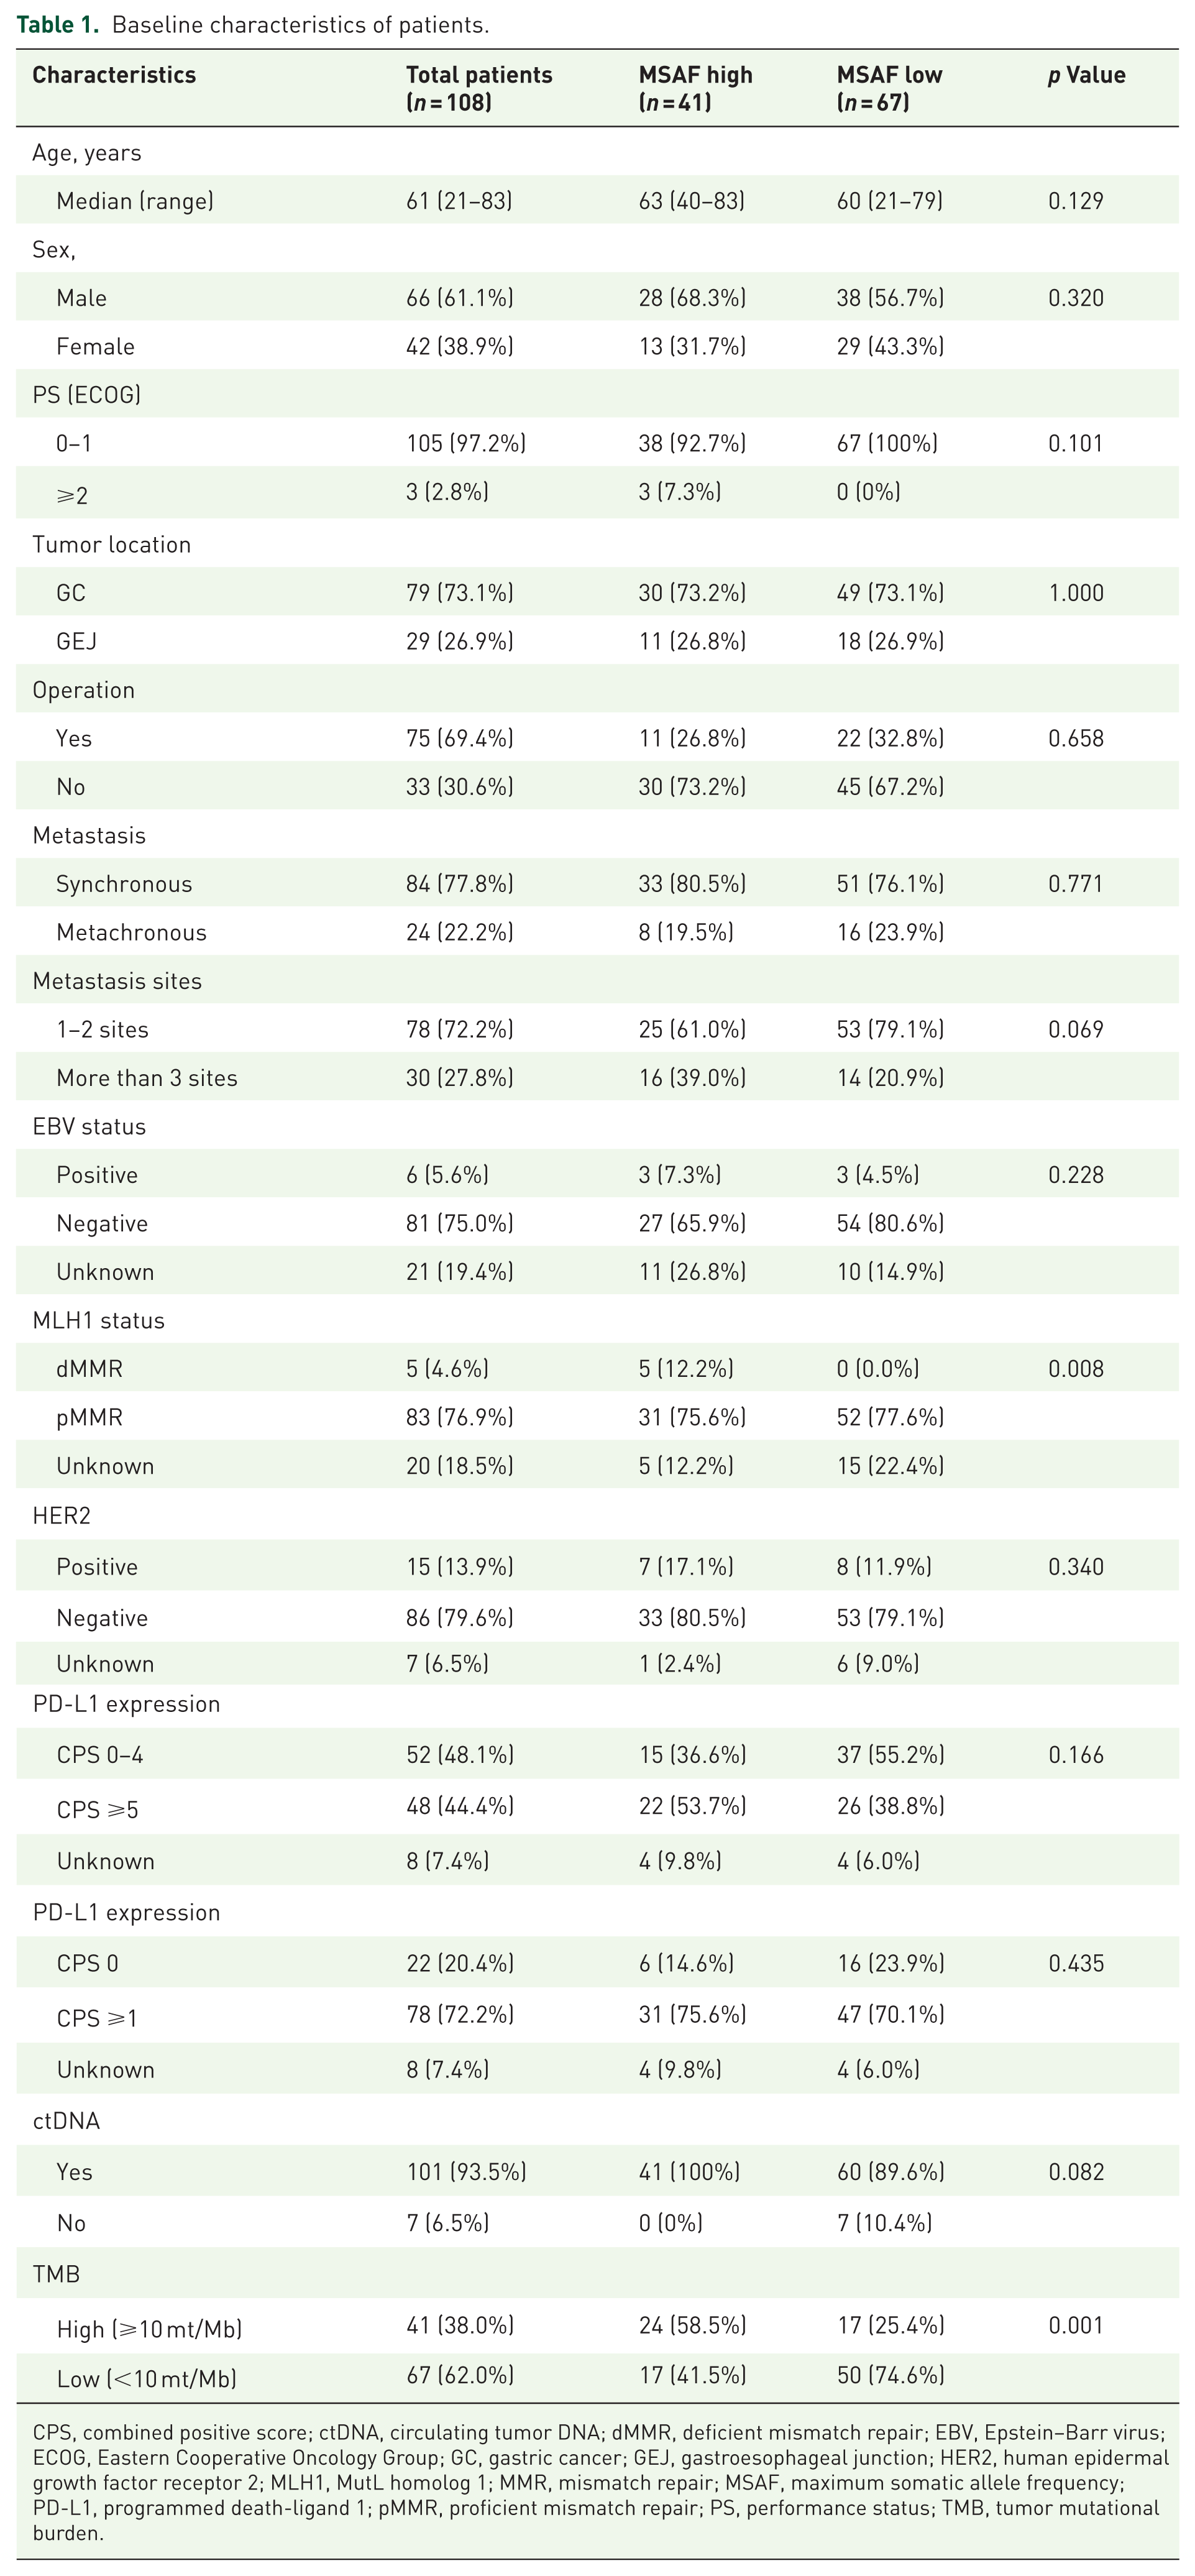
CPS, combined positive score; ctDNA, circulating tumor DNA; dMMR, deficient mismatch repair; EBV, Epstein–Barr virus; ECOG, Eastern Cooperative Oncology Group; GC, gastric cancer; GEJ, gastroesophageal junction; HER2, human epidermal growth factor receptor 2; MLH1, MutL homolog 1; MMR, mismatch repair; MSAF, maximum somatic allele frequency; PD-L1, programmed death-ligand 1; pMMR, proficient mismatch repair; PS, performance status; TMB, tumor mutational burden.
Treatment characteristics and response
A variety of chemotherapy regimens were administered to patients in this study (Table 2). The most prevalent regimen was nivolumab plus CAPOX, received by 26.9% of all patients, followed by CAPOX alone (19.4%), nivolumab plus FOLFOX (12.0%), and pembrolizumab plus CAPOX (10.2%). Other regimens, including XPH (capecitabine + cisplatin + trastuzumab), tislelizumab-based combinations, and investigational therapies, were also used. The distribution of treatment regimens between the MSAF-high and MSAF-low groups was not significantly different (p = 0.125).
Best overall response and chemotherapy regimen.

Included ongoing or follow-up loss.
Included FOLFOX, MEDI5752 + CAPOX, Nivolumab + Ipilimumab + SOX, SOX, DKN-01 + Tislelizumab + CAPOX, FP + Trastuzumab, Nivolumab + ONO-4578 + SOX, Pembrolizumab.
CAPOX, Capecitabine + oxaliplatin; FP, 5FU + Cisplatin; MSAF, maximum somatic allele frequency; SOX, S-1 + oxaliplatin; XPH, Capecitabine + Cisplatin + Trastuzumab.
The best overall response was evaluable in most patients, with a few exceptions of 2.8% due to ongoing treatment or loss to follow-up. Among all patients, 6.5% achieved CR, 61.1% achieved PR, 13.9% achieved SD, and 15.7% had progressive disease. The distribution of response categories was similar between MSAF-high and MSAF-low groups (p = 0.365). The ORR was 63.4% in the MSAF-high group and 70.2% in the MSAF-low group, while the DCR was 73.2% and 86.6%, respectively.
MSAF distribution and survival outcomes
Survival outcomes were assessed for all 108 patients. During follow-up, 87 PFS events (progression or death) and 63 OS events (death) were recorded. Survival analyses revealed that patients with high MSAF exhibited significantly worse OS compared to those with low MSAF. The median OS was 10.0 months (95% confidence interval (CI): 6.9–18.7) in the high MSAF group and 17.6 months (14.8–not reached) in the low MSAF group (log-rank p = 0.006; Figure 2(a)). In contrast, PFS exhibited a tendency toward reduced survival in the MSAF-high group (median PFS: 4.5 months (3.3–7.1) vs 8 months (6.6–9.2)), though this discrepancy did not attain statistical significance (log-rank p = 0.1; Figure 2(b)).

Survival curve by MSAF status. (a) OS. (b) PFS.
Prognostic factors for OS and PFS based on univariate and multivariate analysis
To identify independent prognostic factors for OS, both univariate and multivariate Cox regression analyses were performed (Table 3). In univariate analysis, older age (hazard ratio (HR), 1.04; 95% CI: 1.00–1.07, p = 0.029) and high MSAF status (HR, 2.34; 95% CI: 1.23–4.46, p = 0.010) were significantly associated with worse OS. ECOG ⩾2 was also strongly associated with inferior OS (HR, 68.5; 95% CI: 4.28–1095, p = 0.003), although the wide CI reflects the small number of patients with poor performance status. Other variables, including sex, tumor location, metastatic extent, EBV status, MutL homolog 1 (MLH1) status, HER2, PD-L1 expression, ctDNA positivity, and TMB, did not show statistically significant associations in univariate analysis.
Univariate and multivariate analysis of factors for OS (complete-case analysis, n = 70).

CI, confidence interval; ctDNA, circulating tumor DNA; dMMR, deficient mismatch repair; EBV, Epstein–Barr virus; ECOG, Eastern Cooperative Oncology Group; GC, gastric cancer; GEJ, gastroesophageal junction; HER2, human epidermal growth factor receptor 2; HR, hazard ratio; MLH1, MutL homolog 1; MSAF, maximum somatic allele frequency; OS, overall survival; PD-L1, programmed death-ligand 1; pMMR, proficient mismatch repair; PS, performance status; TMB, tumor mutational burden.
In the multivariate Cox regression model, which included age, ECOG performance status, metastatic extent (1–2 vs ⩾3 sites), treatment regimen (with vs without immunotherapy), and other clinical and molecular covariates, high MSAF remained an independent predictor of inferior OS (HR, 2.14; 95% CI: 1.04–4.41, p = 0.039). Age, ECOG status, metastatic burden, and other biomarker variables were not independently associated with OS. Treatment with immunotherapy-containing regimens showed a borderline association with better OS (HR, 0.40; 95% CI: 0.16–1.02, p = 0.054), although this did not reach statistical significance.
For PFS, univariate analysis demonstrated that ECOG ⩾2 was strongly associated with inferior PFS (HR, 34.0; 95% CI: 3.08–375, p = 0.004; Supplemental Table 1). High MSAF showed a nonsignificant trend toward shorter PFS (HR, 1.55; 95% CI: 0.90–2.67, p = 0.115), and no other variable, including age, metastasis sites, tumor location, molecular markers, or TMB, reached significance. In the multivariate analysis for PFS, no clinical or molecular variable emerged as an independent prognostic factor except for treatment regimen. Use of immunotherapy-containing regimens was significantly associated with prolonged PFS (HR, 0.297; 95% CI: 0.138–0.638, p = 0.002).
Among patients with MLH1 loss, clinical and molecular features were heterogeneous, and several cases showed discordant results between IHC and ctDNA-based MSI status (Supplemental Table 2). Due to the very small sample size, no meaningful comparison or survival inference could be made for this subgroup.
Comparative heatmap of gene mutation profiles between the MSAF-low and MSAF-high groups
When stratified by ctDNA-derived MSAF, patients with MSAF-high (n = 41) had significantly more concurrent mutations than those with MSAF-low (n = 67; Figure 3). The median numbers of mutations were 22 and 16, respectively (p < 0.001, Mann–Whitney U test). The MSAF-high group exhibited higher frequencies of co-mutations in chromatin remodeling genes (ARID1A: 36.6% vs 10.4%, p = 0.002; SMARCA4: 14.6% vs 4.5%, p = 0.080) and in DNA damage repair genes (ATM: 17.1% vs 6.0%, p = 0.099; BRCA2: 9.8% vs 7.5%, p = 0.728). These results support the presence of a genomically unstable phenotype. In contrast, no gene was more frequently mutated in the MSAF-low group. This group displayed a narrower mutation spectrum with lower mutation frequencies across most cancer-associated genes. Taken together, these findings suggest that ctDNA-derived MSAF reflects tumor burden, as well as the underlying genomic complexity and mutational processes of metastatic GC.
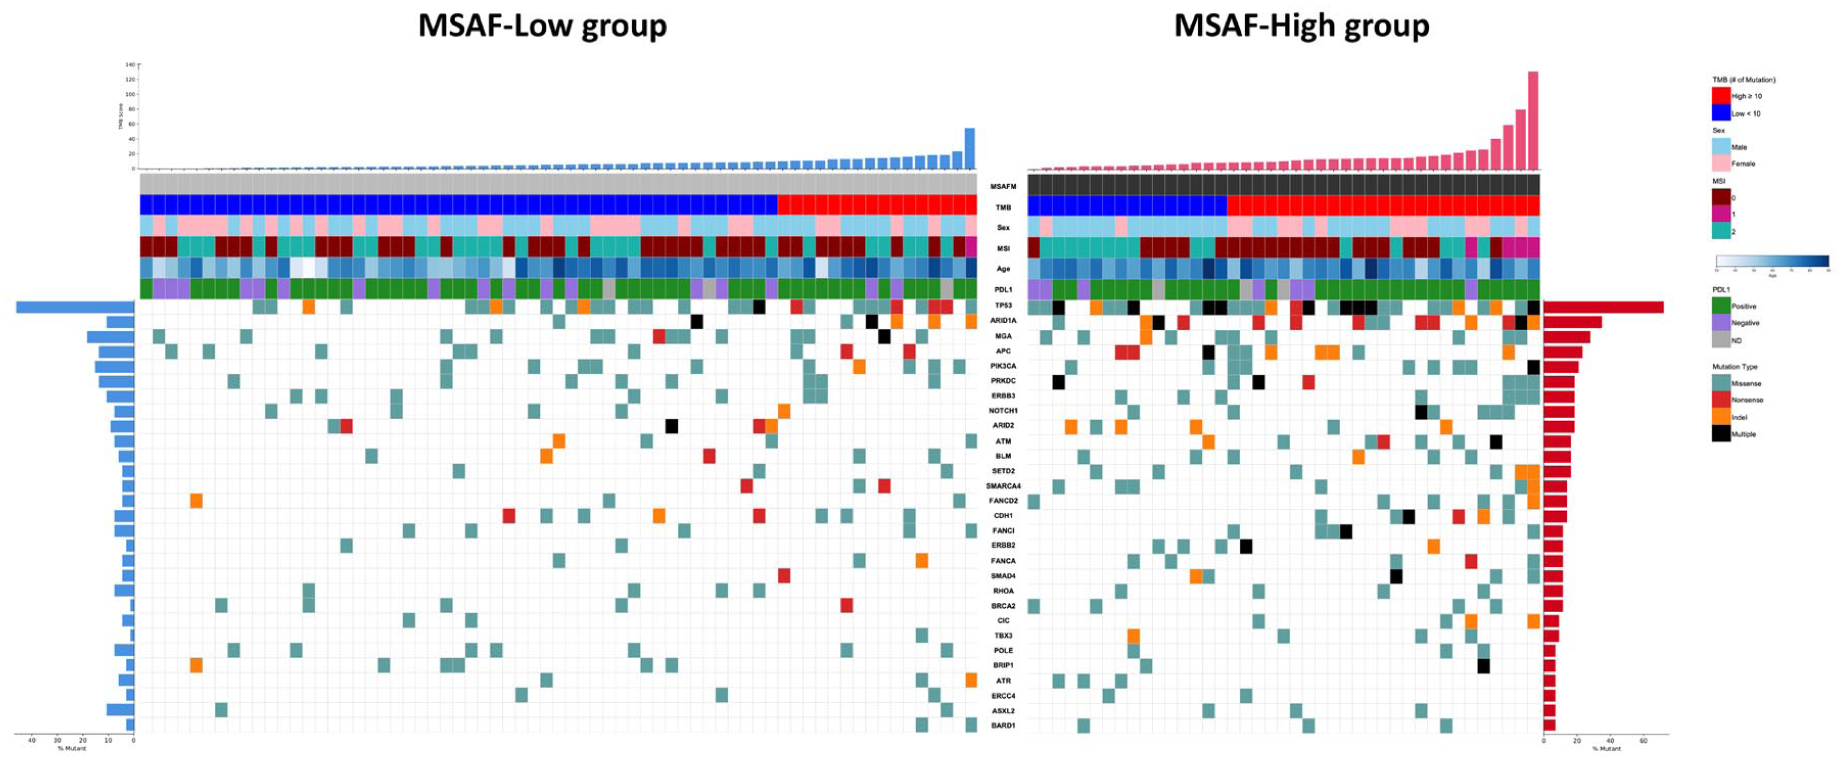
Comparative heatmap of gene mutation profiles between the MSAF-low and MSAF-high groups. This figure presents a heatmap illustrating the mutation landscape of key cancer-associated genes in patients stratified by MSAF levels: MSAF-low and MSAF-high groups. Top panels: TMB (high ⩾10, low <10) and MSAF status (high, low). Middle panels: TMB category, sex (male, female), MSI status (MSS, MSI-high, MSI-indeterminate), age, and PD-L1 status (positive, negative, ND). Bottom panels: mutation types (missense, nonsense, indel, and multiple) and key recurrent gene alterations. Left: most frequently mutated genes and their mutation frequencies.
Discussion
This study represents the first comprehensive validation of MSAF as a prognostic biomarker specifically in metastatic GC. In a retrospective, single-center cohort, we demonstrated that baseline MSAF derived from ctDNA NGS has prognostic relevance. Patients with high MSAF had significantly shorter OS (HR, 2.00; 95% CI: 1.04–3.85, p = 0.038), whereas PFS under first-line chemotherapy with or without immunotherapy was not significantly different (HR, 1.55; 95% CI: 0.90–2.67, p = 0.115). These findings suggest that baseline MSAF reflects intrinsic tumor biology and disease aggressiveness rather than acute treatment sensitivity.
Previous investigations have evaluated the prognostic value of MSAF across various cancer types, though results have been inconsistent. In non-small cell lung cancer (NSCLC), allele frequency heterogeneity, derived from ctDNA, correlated with inferior outcomes, supporting the notion that clonal diversity and mutational complexity contribute to biological aggressiveness. 12 In breast cancer, an MSAF threshold of ⩾10% was associated with lower ORRs and shorter PFS, highlighting its utility as a surrogate of tumor burden. 13 Conversely, a study of NSCLC patients treated with atezolizumab reported an apparent difference in response rates at an MSAF threshold of 1%; however, multivariate analysis attributed this finding to baseline prognostic factors rather than MSAF itself, and no significant association with OS was observed. 15 Such discrepancies may reflect cancer-specific biology, cohort heterogeneity, and methodological variations in cutoff determination, underscoring the importance of tumor-type–specific validation studies.
In our cohort, high MSAF was associated with multiorgan metastases and genomic features, including dMMR and high TMB. Across several cancer types, dMMR and TMB-high status have been consistently linked to improved responses to immune checkpoint inhibitors (ICIs). 16 Indeed, major clinical trials such as KEYNOTE-059 demonstrated improved outcomes among dMMR-positive GC patients, and KEYNOTE-158 reported enhanced response rates in tumors with high TMB treated with pembrolizumab.17,18 Furthermore, ctDNA-derived mutational load has shown strong concordance with whole-exome sequencing and was found to predict clinical benefit from pembrolizumab monotherapy in metastatic GC. 19 Previously, we reported that a substantial proportion of patients with MSI-high GC (55.6%) derived clinical benefit from pembrolizumab monotherapy, which was associated with a diverse T-cell receptor repertoire and increased PD-1⁺ CD8⁺ T-cell infiltration. 20 Our observation that patients with high ctDNA-derived MSAF exhibit poor prognosis even in the presence of dMMR or high TMB warrants further investigation, particularly to determine whether this reflects the biological and clinical heterogeneity of ICI responsiveness in MSI-H GC.
Under these conditions, ctDNA-based biomarkers such as MSAF may capture tumor burden and disease dynamics more accurately than immunogenicity. Thus, even in patients with dMMR or TMB-high tumors, a high MSAF may signify more aggressive disease biology and poorer survival. These findings highlight the need to interpret ctDNA-derived biomarkers in the context of treatment modality, underlying tumor biology, and disease stage.
While MLH1 loss is generally associated with dMMR and a favorable prognosis in several tumor types,17,21 the small number of MLH1-loss cases in our cohort and their heterogeneous clinical and molecular features limit any direct comparison with previously reported outcomes. In our dataset, one patient had PD-L1 CPS <1, and another was an elderly individual with ECOG 2 who received pembrolizumab monotherapy. In addition, two patients demonstrated microsatellite-stable status on ctDNA analysis despite MLH1 loss on IHC, suggesting potential discordance between protein expression and functional mismatch repair deficiency (Supplemental Table 2). These overlapping case-specific factors may have influenced the observed outcomes.
Although all patients were anatomically staged as AJCC stage IV, stratification by MSAF identified biologically distinct subgroups: an MSAF-high subgroup characterized by greater tumor burden and poor prognosis, and an MSAF-low subgroup with more favorable outcomes. This suggests that MSAF could serve as a “biological staging” tool, providing additional granularity beyond conventional anatomic classification.
This study has several limitations. It was conducted retrospectively at a single institution with a relatively small sample size, which may limit the generalizability of the findings. The study period was relatively short (December 2022–April 2024), resulting in a limited number of OS events and potentially reducing the statistical power of survival analyses. Treatment regimens were heterogeneous, including chemotherapy alone and multiple immunotherapy-based combinations, which may have introduced additional variability in clinical outcomes. The MSAF cutoff was determined using the cohort mean because ROC analysis demonstrated modest discriminatory performance (AUC = 0.57), and therefore, external validation in larger, independent cohorts is required. Furthermore, our analysis focused exclusively on baseline MSAF; the clinical significance of longitudinal MSAF dynamics during therapy remains to be clarified. 22
MSAF emerges as a noninvasive biomarker that reflects biological heterogeneity and prognosticates survival in metastatic GC. To our knowledge, this represents one of the first studies to assess the clinical role of MSAF in this disease setting. These findings provide a rationale for future prospective, multicenter validation studies to establish MSAF as a component of biologically informed staging and to refine personalized therapeutic strategies.
Conclusion
Baseline MSAF, derived from routine ctDNA sequencing, was associated with biological heterogeneity and emerged as an independent prognostic marker for OS in metastatic GC. Although all patients were uniformly classified as stage IV by anatomic criteria, stratification by MSAF identified clinically meaningful subgroups with distinct prognostic profiles, suggesting that MSAF may provide complementary biological staging information.
Supplemental Material
sj-docx-1-tam-10.1177_17588359251414103 – Supplemental material for Prognostic value of ctDNA-derived maximum somatic allele frequency in patients with metastatic gastric cancer
Supplemental material, sj-docx-1-tam-10.1177_17588359251414103 for Prognostic value of ctDNA-derived maximum somatic allele frequency in patients with metastatic gastric cancer by Changgon Kim, Young-Gon Kim, Jihwan Moon, Junkyu Kim, Ji Eun Shin, Jeeyun Lee, Seung Tae Kim and Sung Hee Lim in Therapeutic Advances in Medical Oncology
Supplemental Material
sj-docx-2-tam-10.1177_17588359251414103 – Supplemental material for Prognostic value of ctDNA-derived maximum somatic allele frequency in patients with metastatic gastric cancer
Supplemental material, sj-docx-2-tam-10.1177_17588359251414103 for Prognostic value of ctDNA-derived maximum somatic allele frequency in patients with metastatic gastric cancer by Changgon Kim, Young-Gon Kim, Jihwan Moon, Junkyu Kim, Ji Eun Shin, Jeeyun Lee, Seung Tae Kim and Sung Hee Lim in Therapeutic Advances in Medical Oncology
Footnotes
Acknowledgements
The authors would like to thank all patients and their families for participating in this study. We also acknowledge the clinical staff who contributed to patient care and data collection.
Declarations
Supplemental material
Supplemental material for this article is available online.
References
Supplementary Material
Please find the following supplemental material available below.
For Open Access articles published under a Creative Commons License, all supplemental material carries the same license as the article it is associated with.
For non-Open Access articles published, all supplemental material carries a non-exclusive license, and permission requests for re-use of supplemental material or any part of supplemental material shall be sent directly to the copyright owner as specified in the copyright notice associated with the article.