
Abstract
Background:
Immunotherapy combinations like Pembrolizumab + Axitinib and Nivolumab + Ipilimumab have survival benefits over Sunitinib in advanced renal cell carcinoma (aRCC) first-line treatment. But their cost-effectiveness in the USA and China is unclear.
Objectives:
To assess the cost-effectiveness of three first-line treatment regimens for untreated aRCC—Nivolumab plus Ipilimumab, Pembrolizumab plus Axitinib, and Sunitinib—from the perspective of national health service systems and indirect healthcare payers in China and the USA, with a focus on intent-to-treat (ITT) populations and International mRCC Database Consortium (IMDC) risk stratifications.
Design:
Decision-tree and Markov models, based on KEYNOTE-426 and CheckMate 214 trials, simulated 5-year disease progression of eligible patients.
Methods:
The model, constructed using TreeAge Pro 2022 (TreeAge Software, LLC, Williamstown, Massachusetts, USA), incorporated three health states: progression-free survival, progressive disease, and death. Economic parameters included direct medical costs (first-line and second-line treatments, adverse event management, monitoring), quality-adjusted life year (QALYs), and incremental cost-effectiveness ratios (ICERs). Probabilistic sensitivity analysis was performed to evaluate model uncertainty.
Results:
Across favorable-risk, intermediate/poor-risk IMDC subgroups, and the ITT population, Nivolumab plus Ipilimumab sequential Cabozantinib demonstrated the optimal cost-effectiveness in both countries, with ICERs below the willingness-to-pay (WTP) thresholds. It was associated with lower costs and higher QALYs compared to the other two regimens. Pembrolizumab plus Axitinib sequential Cabozantinib was more cost-effective than sunitinib sequential Cabozantinib in both regions, with ICERs also below WTP thresholds.
Conclusion:
In China and the USA, Nivolumab plus Ipilimumab is the most cost-effective first-line treatment for aRCC across different IMDC subgroups and the ITT population, followed by Pembrolizumab plus Axitinib, which outperforms sunitinib. These findings can guide clinical decision-making, though their generalizability is limited to China and the USA due to regional differences in drug pricing, payment systems, and market access.
Plain language summary
Kidney cancer is a serious disease. Some new treatments for advanced kidney cancer seem better than the old one, sunitinib, but we don’t know if they’re worth the cost. This study compared pembrolizumab plus axitinib, nivolumab plus ipilimumab, and sunitinib. The results showed that nivolumab plus ipilimumab was the most cost-effective in both the US and China. Pembrolizumab plus axitinib was also more cost-effective than sunitinib. This can help doctors and patients choose the best treatment considering both cost and effectiveness.
Introduction
According to the 2021 Global Burden of Disease Study, kidney cancer accounted for 1.6% of the global neoplasm-related disease burden, standing as the 18th leading cause of mortality among cancerous conditions.1,2
As one of the highly lethal malignant tumors of the urinary system, about 30% of renal cell carcinoma (RCC) patients are at the locally advanced or metastatic stages when they are initially diagnosed, which is closely related to the insidious nature of early symptoms of the disease.3,4 Over the past 15 years, targeted medicaments, represented by sunitinib [Vascular Endothelial Growth Factor Receptor (VEGFR) inhibitor] and everolimus [mammalian Target Of Rapamycin (mTOR) pathway inhibitor], have emerged as the standard treatment for advanced RCC by blocking tumor angiogenesis, among other mechanisms. However, despite the significant prolongation of patient survival by these drugs, advanced RCC still cannot be eradicated, with its median overall survival (OS) of only about 2 years.5 –7 This current situation highlights the urgent need to develop novel therapeutic agents.
The immune checkpoint inhibitor class of drugs offers hope to cancer patients who previously lacked effective treatment options, not only improving their survival rates but also their quality of life. 8 These drugs work by inhibiting the Cytotoxic T-Lymphocyte-Associated Protein 4 (CTLA-4) or Programmed Death-1 (PD-1) pathways through antibodies, either alone or in combination.9,10
Sunitinib, a multi-targeted small molecule inhibitor of tyrosine kinase, is now an effective option for treating advanced renal cell carcinoma (aRCC) as a first-line clinical therapy. 11 First-line sunitinib treatment is categorized as Category 2A in the National Comprehensive Cancer Network (NCCN) Clinical Practice Guidelines for Renal Cancer. Additionally, there are other recommended regimens for clear cell renal cell carcinoma (ccRCC) patients across every risk category. 12
According to European Society for Medical Oncology (ESMO) clinical practice guidelines, sunitinib remains an alternative to PD-1 inhibitor-based combination therapy for patients with high-risk metastatic renal cell carcinoma (mRCC). After all, PD-1 inhibitor combination therapy does not demonstrate a significant advantage over sunitinib in this patient population. 13 However, dual therapy consisting of a blocker of immune checkpoints in combination with a kinase inhibitor is superior to sunitinib.14,15
Pembrolizumab (PD-1 inhibitor) combined with Axitinib (VEGFR-targeting TKI) demonstrated superior efficacy in untreated advanced RCC through the phase III KEYNOTE-426 study. The phase III KEYNOTE-426 study compared this combination to sunitinib in untreated aRCC patients. Results demonstrated that the Pembrolizumab + Axitinib group witnessed remarkable augmentations in both progression-free survival (PFS) and OS when juxtaposed with those who received sunitinib, with a hazard ratio (HR) of 0.69 for disease progression/death and 0.53 for death. 15
Nivolumab specifically binds to the immune checkpoint PD-1 to block its signaling, while Ipilimumab targets the T-cell surface-located molecule CTLA-4. The two monoclonal antibodies work in concert to enhance T-cell killing of tumors by disarming immunosuppression through different mechanisms. In the CheckMate 214 trial, this combination reduced mortality risk by 32% (HR: 0.63; p < 0.001) compared to sunitinib in intermediate/poor risk mRCC patients, showing improved tolerability. 14
The findings from the above studies indicated that both Pembrolizumab combined with Axitinib and Nivolumab combined with Ipilimumab have superior survival advantages in treating aRCC, respectively, and these two treatments were sanctioned by the FDA for initial treatment regimens in adults diagnosed with advanced renal cell carcinoma. 16
New treatments are often more costly than previous standard techniques and, in some cases, the improvement in treatment outcomes is extremely limited. A recent review pointed out that, due to the variation in cost inputs across regions, the capacity for transfer and universal applicability of the findings from cost-effectiveness analyses are bounded. 17 Therefore, our study aimed to assess the cost-efficiency of three treatment options when used as the first-line therapeutic approach for untreated patients diagnosed with aRCC, considering from the standpoint of the National Health Service and indirect healthcare financiers.
Patients and methods
Model structure
This study employed a hybrid decision tree-Markov model using TreeAge Pro 2022 (TreeAge Software, LLC, Williamstown, Massachusetts, USA) to simulate treatment outcomes for advanced renal cell carcinoma. The model architecture incorporated three distinct health states: PFS, PD, and death (Figure 1). Patient cohorts were derived from KEYNOTE-426 and CheckMate 214 trial populations, with equal randomization across therapeutic arms. The 5-year simulation utilized 10 Markov cycles (6-month duration each), initiating all patients in the PFS state until disease progression or mortality occurred.
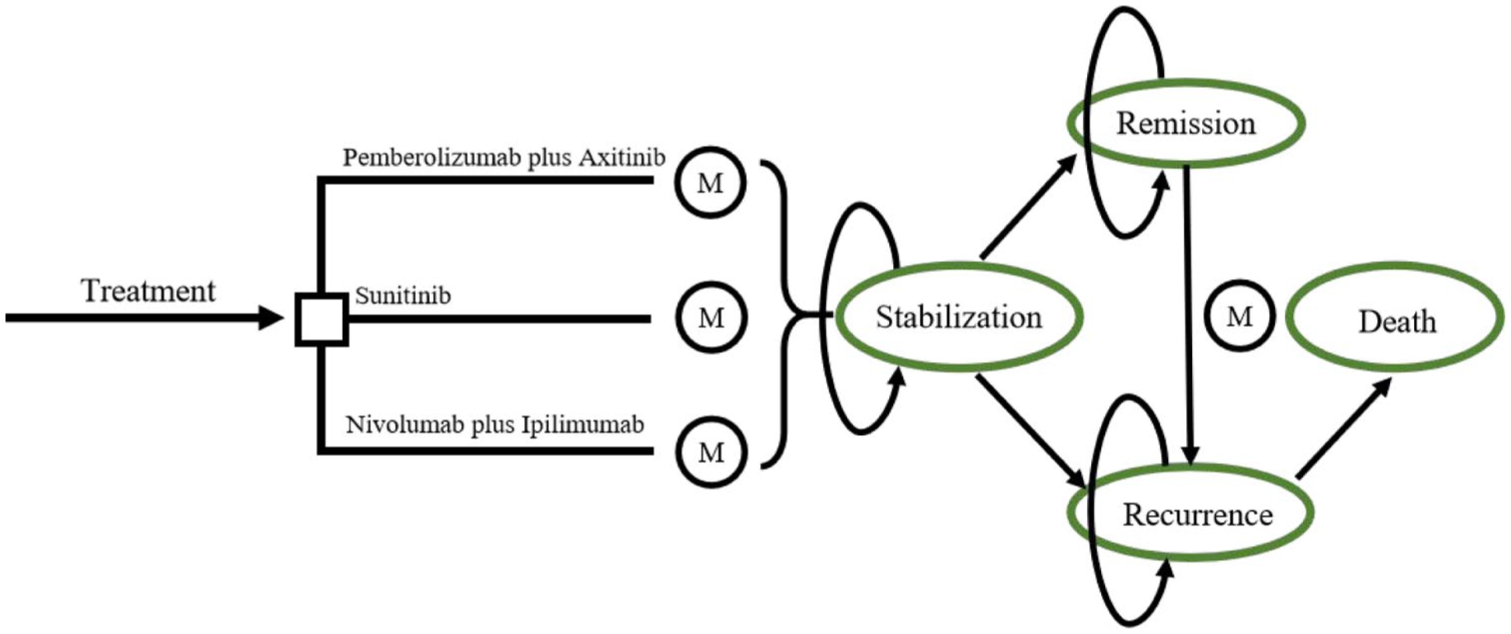
Markov state transition models.
Economic evaluation parameters included direct medical costs, quality-adjusted life years (QALYs), and incremental cost-effectiveness ratios (ICERs). Time-dependent adjustments were applied through half-cycle correction and 3% annual discounting, adhering to pharmacoeconomic guidelines. 18 Following WHO guidelines, cost-effectiveness thresholds were anchored at triple the 2023 per capita GDP values, $12,614.1 (China) and $82,769.4 (US). 19 And, this study report follows the CHEERS statement 20 (Supplemental CHEERS Checklist).
Patients and treatment plans
The inclusion criteria for the target population in the Pembrolizumab plus Axitinib (P + A) versus Sunitinib (SUN) arm of this study were consistent with those of KEYNOTE-426. A sum of 861 patients were randomized, with 432 receiving P + A and 429 treated with SUN. The P + A regimen consisted of Pembrolizumab (200 mg IV q3w; ⩽35 cycles) combined with Axitinib (5 mg BID), whereas the control group received sunitinib (50 mg QD 4w-on/2w-off). 21 The Nivolumab plus Ipilimumab (NIVO+ IPI) cohort (CheckMate 214-aligned) comprised 1096 participants allocated to Nivolumab (3 mg/kg) plus Ipilimumab (1 mg/kg) IV q3w for four cycles, followed by Nivolumab maintenance (3 mg/kg q2w), while the others received sunitinib (50 mg QD; 4w-on/2w-off schedule). 22 And we regarded Cabozantinib (60 mg/QD) as the subsequent second-line treatment regimen for the Pembrolizumab plus Axitinib arm and Nivolumab plus Ipilimumab arm.
We included the NIVO + IPI and SUN groups from CheckMate 214 studies, along with the P + A group from KEYNOTE-426, comprising a total of 1528 participants.
Clinical data
The transfer probability in the Markov state transfer model denotes the probability that a patient is going to shift from one state to another during a cycle. Our study utilized the DEALE method23,24 to transform time-dependent survival probabilities into constant mortality rates. The clinical outcome metrics used to calculate transfer probabilities in our study primarily encompassed remission rate (RR), OS, PFS, and duration of remission (DOR) (Table 1). The relevant data were obtained from the KEYNOTE-426 study and the CheckMate 214 trial. In addition, according to previous reports, following disease progression, 66% of patients in the USA and 33% of patients in China are expected to undergo second-line aggressive treatment. 16
Crucial clinical information, health preference data, and transfer probability.

RR + (OS − PFS)/OS.
AE, adverse event; HR, hazard ratio; OS, overall survival; PD, progressive disease; PFS, progression-free survival; RR, remission rate; P + A, Pembrolizumab plus Axitinib; NIVO + IPI, Nivolumab plus Ipilimumab; SUN, Sunitinib.
Cost-utility analysis framework
Our study considers only direct healthcare costs from the standpoint of the National Health Service and indirect healthcare financiers in China and the USA, covering first-line and follow-up therapy, treating serious adverse events (AEs), routine monitoring, and end-stage care. We contained the five grade ⩾ 3 AEs across treatment regimens in the KEYNOTE-426 and CheckMate 214 trials (the Tables S2–S4) and listed their management costs (Table 2).
Model input for the costs of Pembrolizumab plus Axitinib in China and the US regions.
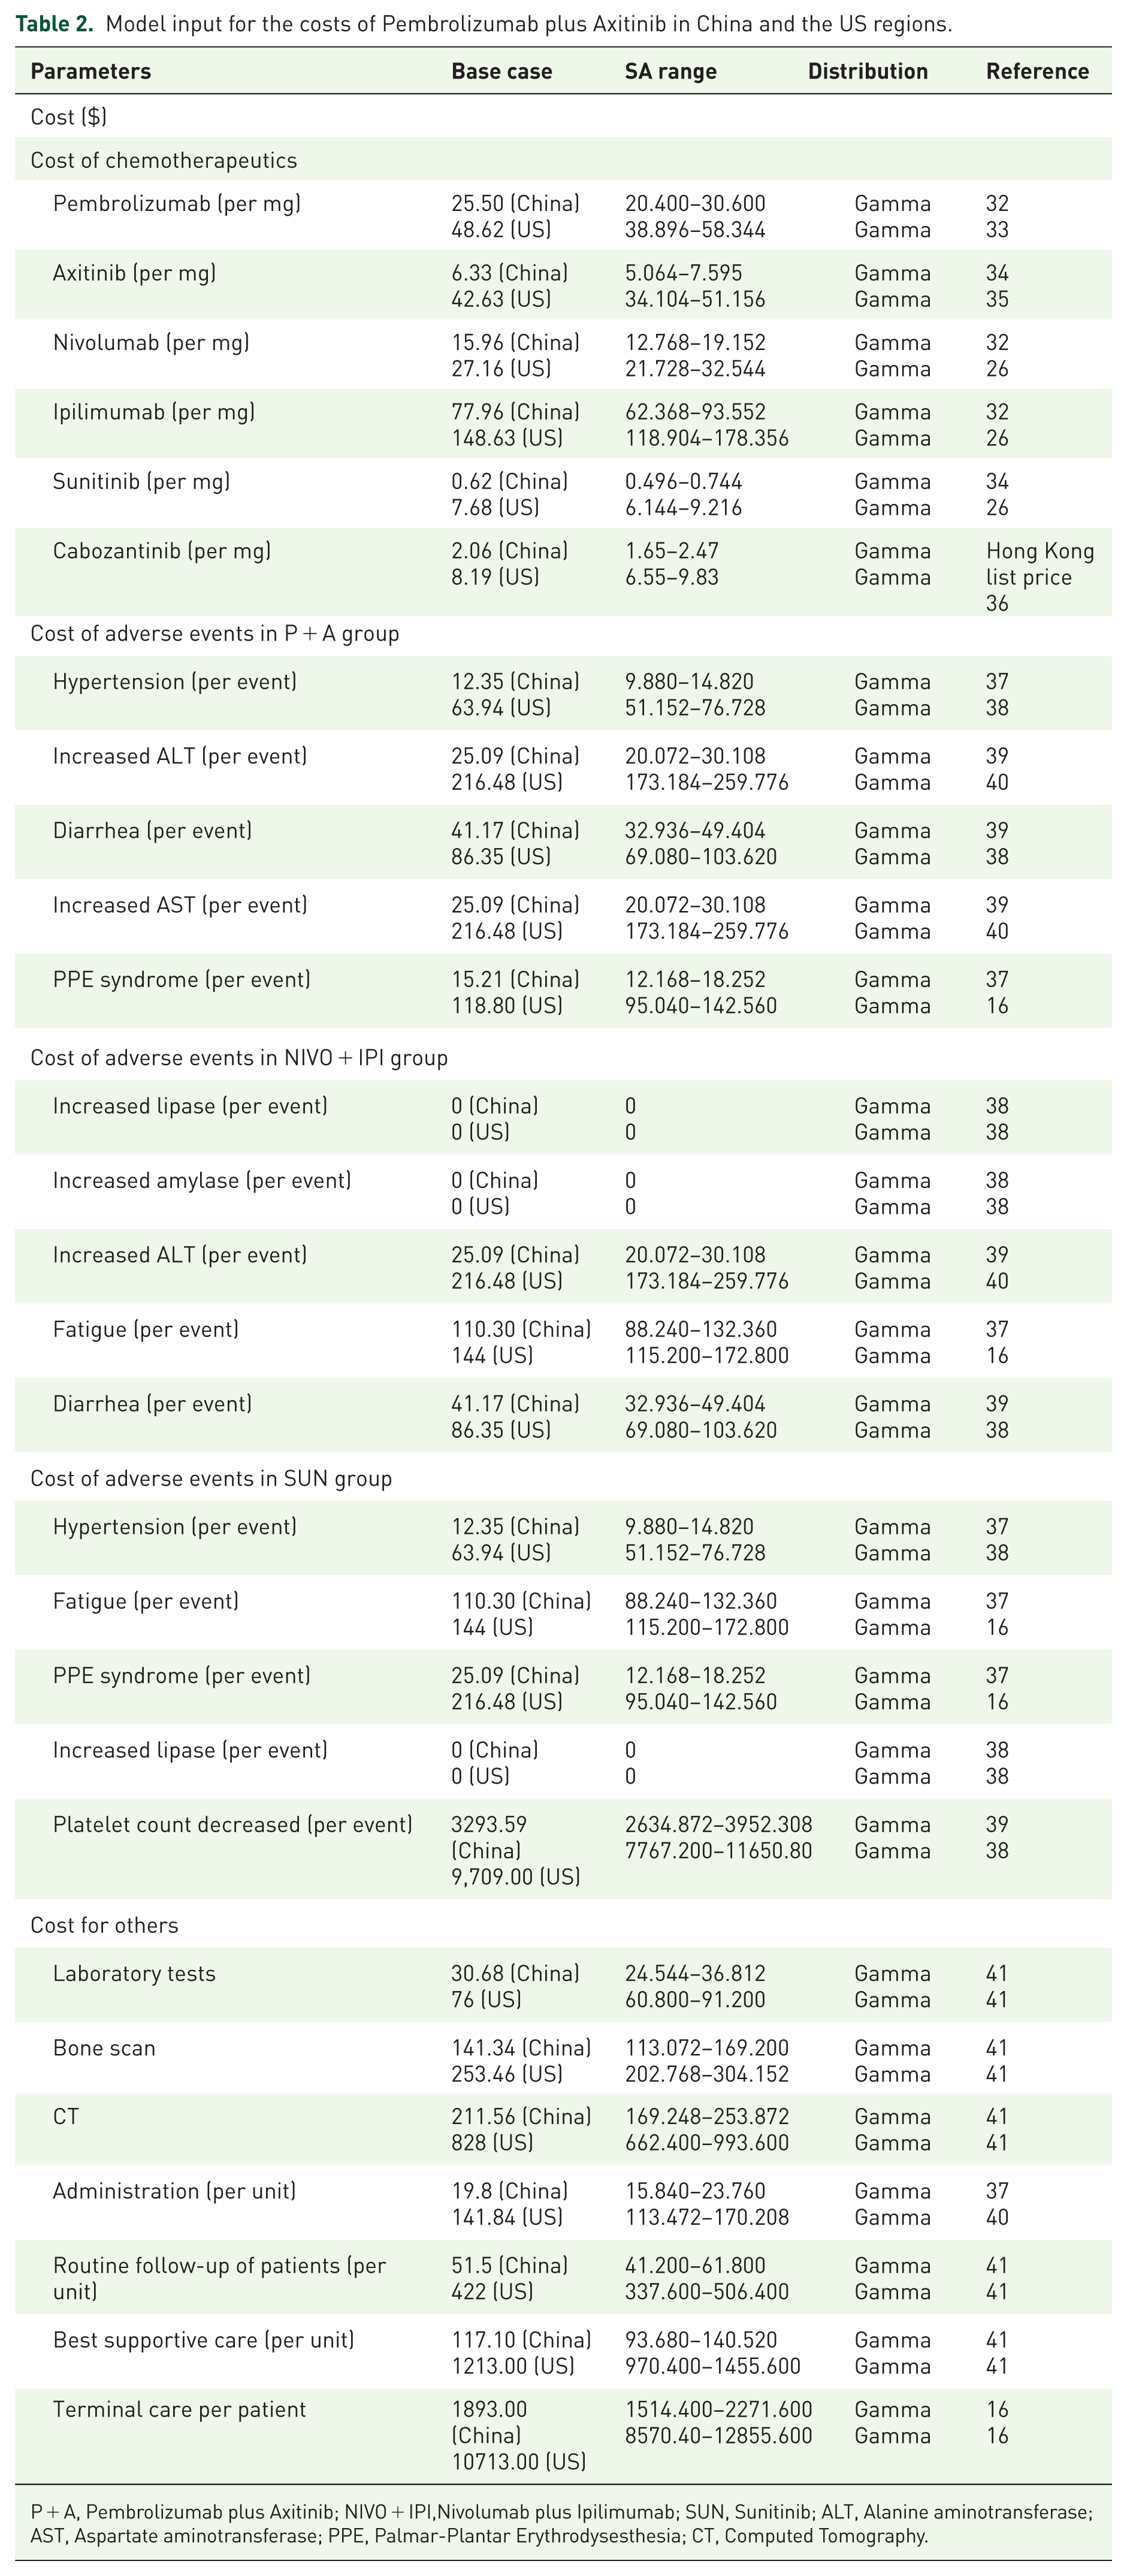
P + A, Pembrolizumab plus Axitinib; NIVO + IPI,Nivolumab plus Ipilimumab; SUN, Sunitinib; ALT, Alanine aminotransferase; AST, Aspartate aminotransferase; PPE, Palmar-Plantar Erythrodysesthesia; CT, Computed Tomography.
Health utility values were derived from standardized responses to FKSI-19 used in clinical trials. These raw FKSI-19 scores were normalized by dividing by 76 (the maximum achievable score), yielding comparable utility coefficients. The final model used adjusted utility values of 0.82 for the Nivolumab–Ipilimumab combination22,26 and 0.77 for the Pembrolizumab–Axitinib regimen.21,26
To calculate the dosages of Nivolumab and Ipilimumab, we made an assumption regarding patient weight: 65.0 kg for patients in China and 85.0 kg for those in the USA. All costs converted to USD.
Sensitivity analysis
Sensitivity analysis incorporated both univariate and probabilistic approaches to evaluate model uncertainties.
One-way sensitivity analyses (OSA) examined individual parameter impacts on ICERs through ±20% base-case value variations, with parameter ranges established from literature-derived confidence intervals. Results were visualized via tornado diagrams to identify treatment decision influencers.
In the probabilistic sensitivity analysis (PSA), uncertainty in cost is represented by a Gamma distribution, and uncertainty in utility, proportion, and probability is represented by a beta distribution, followed by 1000 simulations using a Monte Carlo approach to jointly sample parameters from specific distributional patterns. Cost-effectiveness probabilities were quantified through scatterplot matrices and acceptability curves, demonstrating competing strategies' economic viability under parameter uncertainty.
Results
Base-case analysis
For patients with favorable risk, the regimen of first-line treatment with Sunitinib followed by Cabozantinib (Sun followed by Cabo) has a mean cancer-attributable cost of $34,010.59 in China and $158,585.19 in the USA, with a QALY of 1.33 per patient in both countries. The Pembrolizumab + Axitinib followed by Cabozantinib regimen (Pem/Axi followed by Cabo), compared with the above-mentioned regimen, incurs an additional cost of $25,548.06 and gains an extra 1.74 QALYs in China, resulting in an ICER of $14,697.60 per QALY. In the USA, it costs an additional $15,030.73 compared with the above regimen and gains an extra 1.74 QALYs, with an ICER of $8,647.06 per QALY. Compared with Sun followed by Cabo, the Nivolumab + Ipilimumab followed by Cabozantinib regimen (Nivo/Ipi followed by Cabo) leads to an additional cost of $24,854.13 and an extra 1.80 QALYs in China, with an ICER of $13,819.61 per QALY. In the USA, it involves an additional cost of $42,965.41 and an extra 1.80 QALYs, resulting in an ICER of $23,890.00 per QALY. Compared with the Pem/Axi followed by Cabo, the Nivo/Ipi followed by Cabo achieves a higher incremental QALY, and its ICERs are both lower than the willingness-to-pay (WTP) thresholds in the two countries (Table S5).
For patients with intermediate/poor risk, Sun followed by Cabo yields 1.33 QALYs per patient, with average cancer-related costs of $34,528.25 in China and $159,102.85 in the USA. Versus this regimen, Pem/Axi followed by Cabo adds 1.74 QALYs, with incremental costs of $30,123.52 (China) and $17,625.29 (US), resulting in ICERs of $17,329.83 and $10,168.46 per QALY, respectively. Nivo/Ipi followed by Cabo, compared to Sun followed by Cabo, gains 1.80 QALYs at incremental costs of $27,848.55 (China) and $45,998.91 (US), with ICERs of $15,484.59 and $25,554.98 per QALY (Table S6).
In the intent-to-treat (ITT) population, Markov model calculations showed that using Pem/Axi followed by Cabo instead of Sun followed by Cabo for aRCC resulted in QALYs of 1.74 in China and 1.76 in the USA. In China, the incremental cost of using Pem/Axi followed by Cabo was $27,478.96, with an ICER of $15,808.43; in the USA, the incremental cost was $45,368.23, with an ICER of $25,790.71 (Table 3). In contrast, Nivo/Ipi followed by Cabo in place of Sun followed by Cabo provided patients with an incremental QALY of 1.80 in both China and the USA. The incremental cost of Nivo/Ipi followed by Cabo in China amounted to $26,112.13 with an ICER of $14,519.09, and in the USA, the incremental cost was $44,223.42 with an ICER of $24,589.49 (Table 3). Further comparing Pembrolizumab plus Axitinib to Nivolumab plus Ipilimumab, Pem/Axi followed by Cabo was costlier in both China and the USA (Table 4), and the QALYs and ICERs from the cost-effectiveness analysis were negative. This means that Nivo/Ipi followed by Cabo is not only less expensive but also more effective.
Health benefit.

ICER, incremental cost-effectiveness ratio; QALY, quality-adjusted life year; Pem/Axi, Pembrolizumab + Axitinib; Cabo, Cabozantinib; Sun, Sunitinib; Nivo/Ipi: Nivolumab + Ipilimumab.
Summary of 5-year simulation results in the ITT population.
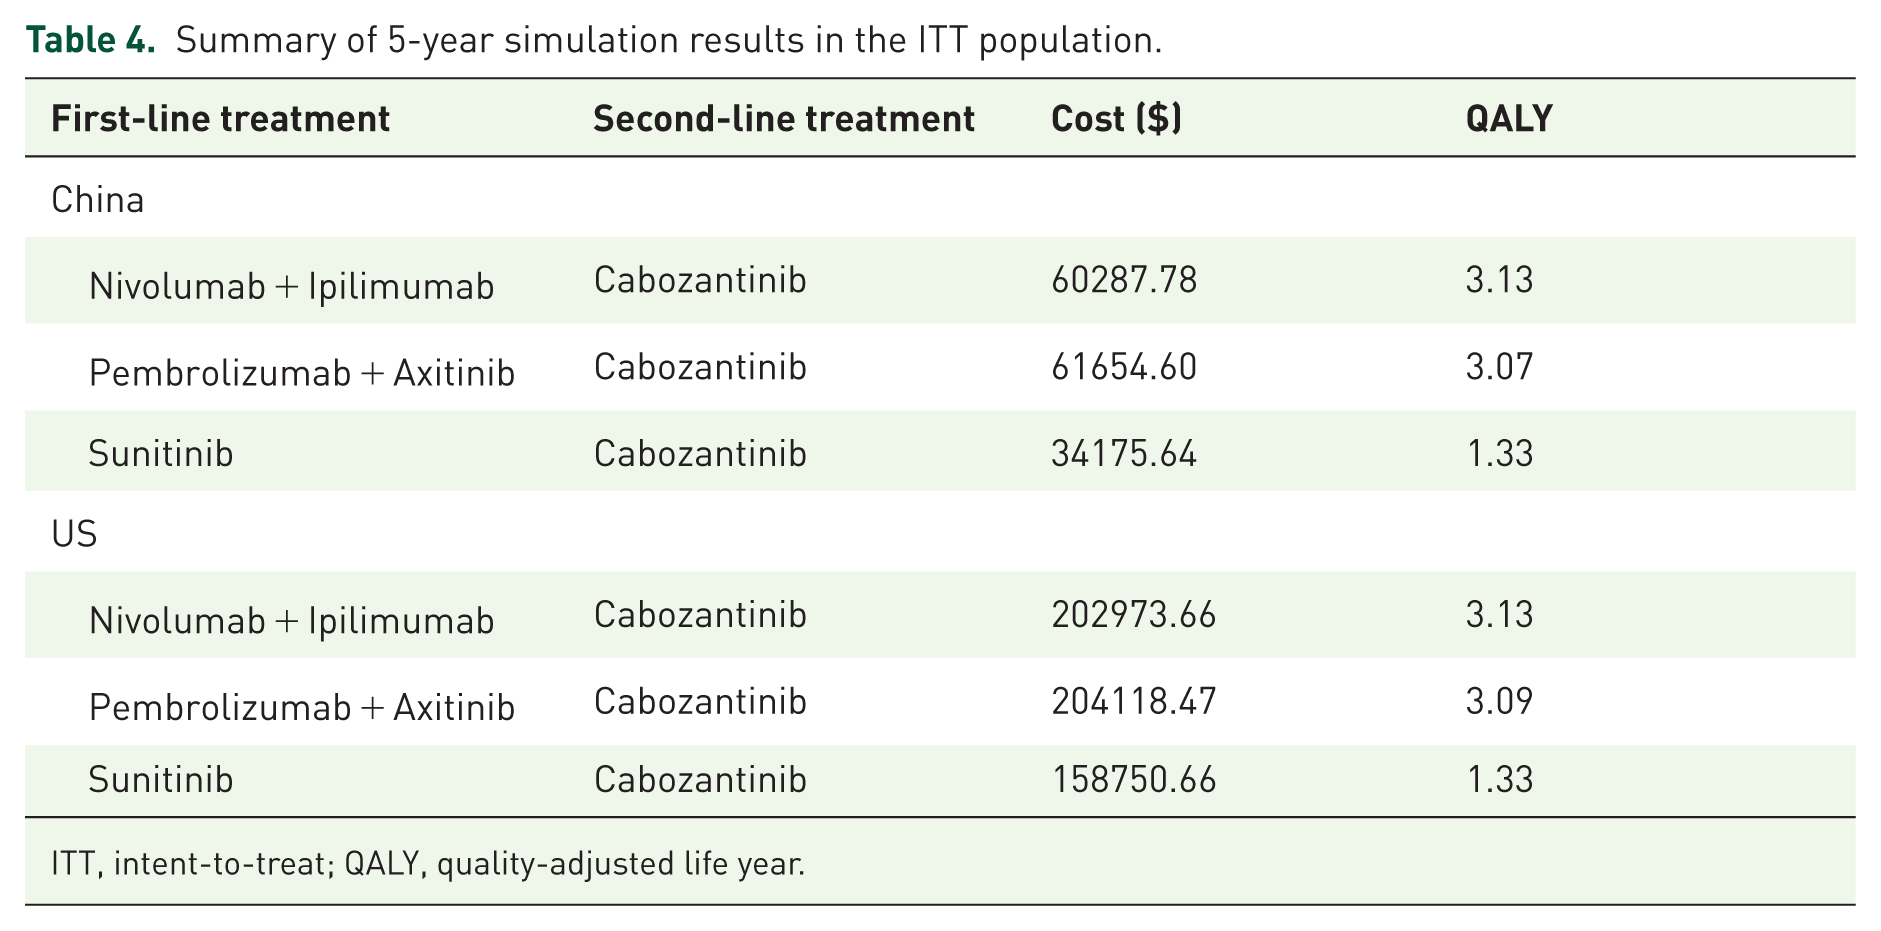
ITT, intent-to-treat; QALY, quality-adjusted life year.
In different IMDC subgroup analyses and the ITT population, compared with the sunitinib sequential Cabozantinib regimen, both the Pembrolizumab plus Axitinib sequential Cabozantinib regimen and the Nivolumab plus Ipilimumab sequential Cabozantinib regimen showed higher cost-effectiveness. Among them, the Nivolumab plus Ipilimumab sequential Cabozantinib regimen had the optimal cost-effectiveness, outperforming the other two regimens.
Sensitivity analysis
The outcomes of the OSAs showed that in the Pem/Axi followed by Cabo versus Sun followed by Cabo models, the top two parameters with significant influence were the probability of transfer from remission to remission for the P + A regimen (Prr) and the probability of transfer from progression to death for the SUN regimen (Spd) in Chinese models, and the top two parameters were Prr and the progression-to-death probability in the Pem/Axi scenario (PPpd) in the US model (Figures S3(B) and S4(B)). In the Chinese and US model comparing Nivo/Ipi followed by Cabo versus Sun followed by Cabo, the key parameters were the remission-to-remission probability in the Nivo/Ipi scenario (Nrr) and the progression-to-death probability in the Nivo/Ipi scenario (NPpd) (Figures S3(A) and S4(A)). For the Nivo/Ipi followed by Cabo versus Pem/Axi followed by Cabo comparison, the top two parameters in both China and the USA were Nrr and NPpd (Figures S3 and S4(C)). The impact of other PS model parameters on ICERs ranged from moderate to negligible.
In the PSA, cost-effectiveness curves show that in both China and the USA, across all IMDC risk stratifications and the ITT population, the Nivo/Ipi followed by Cabo and the Pem/Axi followed by Cabo are both more cost-effective than the Sun followed by Cabo (Figures 2(a), (b) and 3(a), (b); Figures S5(A), S5(B), S6(A), S6(B), S9(A), S9(B), S10(A), S10(B)). The ICER scatterplots show that most points fall below the WTP thresholds of both countries (Figures S1(A), S1(B), S2(A), S2(B), S7(A), S7(B), S8(A), S8(B), S11(A), S11(B), S12(A), and S12(B)), suggesting that the additional cost for each unit of effect for these regimens is lower than the WTP, making them more cost-effective options than Sun followed by Cabo. Comparing the cost-effectiveness acceptability curves of Pem/Axi followed by Cabo and Nivo/Ipi followed by Cabo, the probability of Nivo/Ipi followed by Cabo being cost-efficient is higher (Figures 2(c) and 3(c); Figures S5(C), S6(C), S9(C), and S10(C)).

The cost-effectiveness acceptability curves of (a) NIVO + IPI versus SUN, (b) P + A versus SUN, and (c) P + A versus NIVO + IPI in the intent-to-treat (ITT) population (China).

Cost-effectiveness acceptability curves of (a) NIVO + IPI versus SUN, (b) P + A versus SUN, and (c) P + A versus NIVO + IPI in the intent-to-treat (ITT) population (US).
Discussion
From the perspective of the national health service systems and indirect healthcare payers in China and the USA, we conducted a cost-effectiveness analysis of three first-line treatment regimens for aRCC in the ITT population and across IMDC risk stratifications. The results showed that in both China and the USA, the Nivo/Ipi followed by Cabo regimen demonstrated the optimal cost-effectiveness across different IMDC subgroups, featuring both lower costs and higher QALYs. At the predefined WTP threshold, the cost-effectiveness ratio of the Nivo/Ipi followed by Cabo was superior to that of the Pem/Axi followed by Cabo, while in both regions, the Pem/Axi followed by Cabo was more cost-effective than the Sun followed by Cabo. The results of the PSA supported the above conclusions. However, due to regional differences in drug pricing, payment systems, and market access, the generalizability of these results is limited to China and the USA.
Our study differs from previous ones in that we compare data from the KEYNOTE-426 and CheckMate 214 trials, rather than relying on a single study. While cross-trial comparisons are uncommon in pharmacoeconomics, comparing these two trials is reasonable due to several similarities: both trials had similar baseline patient characteristics, both control groups used sunitinib, and both employed the FKSI-19 to assess quality of life. The cost and QALY values we obtained for each regimen are consistent with previously published studies.27,35 Interestingly, Recent network meta-analyses of first-line advanced renal carcinoma interventions confirm the exclusive cost-effectiveness of Nivolumab–Ipilimumab combination therapy in unselected populations, 42 substantiating our pharmacoeconomic evaluation conclusions. This consistency persists despite methodological variations in cost-utility model construction and regional healthcare parameter integration.
Our study introduces an innovation by focusing on the duration of remission (DOR) as the core metric, rather than relying solely on traditional measures like OS and PFS. DOR calculates the time from significant tumor shrinkage (complete or partial remission) to disease progression or death, reflecting how long the drug’s effects can be maintained and serving as a key indicator of long-term efficacy. Unlike OS and PFS, DOR dynamically tracks changes after the drug’s effects are initiated, offering a more precise assessment of treatment benefits. This multidimensional approach enhances the pharmacoeconomic evaluation by incorporating a critical new dimension into health output metrics.
Our study has limitations in setting transfer probabilities. As shown by the one-way sensitivity analysis (DSAs), the dominant parameters in the three models for both China and the USA are related to state transfer probabilities. However, the real-world applicability of these parameters remains a methodological concern. Although the DEALE principle23,24 was used to construct the model parameters, this method relies on secondary data from published articles. The lack of data from clinical trials specifically designed for pharmacoeconomic evaluations may introduce biases.
Our study has two major limitations. First, the heterogeneity of the patient population may impact the accuracy of efficacy assessment. Although our study incorporated IMDC subgroup analyses, the pooling of different risk groups may still obscure the true treatment effect. Second, the absence of certain subgroup analyses may introduce bias. For instance, studies such as CheckMate 214 have shown that patients with Eastern Cooperative Oncology Group (ECOG) performance status ⩾ 2 experience a significant reduction in objective remission rate with immunotherapy, while those with BMI ⩾ 25 may benefit from enhanced efficacy due to immunomodulatory effects. 14 These important prognostic factors were not compared in our study, and their influence across studies requires further validation.
The conclusions of our study are primarily supported by data from two independent clinical trials, CheckMate 214 and KEYNOTE-426, but their applicability is limited by the observation period and sample characteristics of the original trials. The assessment of the long-term benefits of combination therapies is based on existing clinical data modeled to predict outcomes over 5 years. While the two trials demonstrate strong scientific validity in terms of sample size and protocol design, the analytical model in our study fully relies on the assumptions of reliability and generalizability from the original datasets. Therefore, any potential biases in the original trials may directly affect our study’s conclusions.
Conclusion
Multiple effective first-line treatments are available for RCC. Our cost-effectiveness analysis helps distinguish the advantages and disadvantages of these regimens. In both China and the USA, across different IMDC subgroups, Nivo/Ipi followed by Cabo demonstrates the optimal cost-effectiveness compared with Pem/Axi followed by Cabo and Sun followed by Cabo. Additionally, the Pembrolizumab plus Axitinib regimen is more cost-effective than the Sunitinib regimen.
In clinical decision-making, healthcare providers must consider disease characteristics and individual differences, which may influence treatment suitability or necessitate exclusions—such as organ dysfunction, autoimmune diseases, and administration methods. If these factors do not constrain treatment choices, our findings can help guide clinicians in selecting the most appropriate therapy.
Supplemental Material
sj-docx-1-tam-10.1177_17588359251385392 – Supplemental material for A cost-effectiveness comparison between immunotherapy combination regimens and sunitinib for advanced renal cell carcinoma in the USA and China
Supplemental material, sj-docx-1-tam-10.1177_17588359251385392 for A cost-effectiveness comparison between immunotherapy combination regimens and sunitinib for advanced renal cell carcinoma in the USA and China by Haojie Ying, Fei Tong, Yidong Zhou, Binzhe Zhou, Kai Qiao, Liandong Chen and Qiaoping Xu in Therapeutic Advances in Medical Oncology
Supplemental Material
sj-docx-2-tam-10.1177_17588359251385392 – Supplemental material for A cost-effectiveness comparison between immunotherapy combination regimens and sunitinib for advanced renal cell carcinoma in the USA and China
Supplemental material, sj-docx-2-tam-10.1177_17588359251385392 for A cost-effectiveness comparison between immunotherapy combination regimens and sunitinib for advanced renal cell carcinoma in the USA and China by Haojie Ying, Fei Tong, Yidong Zhou, Binzhe Zhou, Kai Qiao, Liandong Chen and Qiaoping Xu in Therapeutic Advances in Medical Oncology
Footnotes
Acknowledgements
We’re grateful to Mr. Zihao Wang. He collected and organized literature, which greatly helped our research.
Declarations
References
Supplementary Material
Please find the following supplemental material available below.
For Open Access articles published under a Creative Commons License, all supplemental material carries the same license as the article it is associated with.
For non-Open Access articles published, all supplemental material carries a non-exclusive license, and permission requests for re-use of supplemental material or any part of supplemental material shall be sent directly to the copyright owner as specified in the copyright notice associated with the article.