
Abstract
Background:
Inflammatory breast cancer (IBC) is rare but aggressive, characterized by the rapid onset of diffuse skin erythema, edema, tenderness, induration, and fast metastasis. Both hormone receptor positive (HR+) and human epidermal receptor 2 positive (HER2+) are associated with inferior response after neoadjuvant systemic therapy (NAST) compared to non-IBC. Despite multimodal treatment approaches, the 3-year overall survival rate for stage III IBC remains low at approximately 74%, around 10% lower than the 83% for non-IBC.
Objectives:
To evaluate whether the addition of neratinib, an irreversible pan-ErbB receptor small molecule tyrosine kinase inhibitor, improves the rate of pathological complete response in both HER2+ and HR+/HER2− IBC in neoadjuvant therapy, and to assess safety and explore biomarkers associated with response.
Design:
This is a phase I/II (HER2+; cohort 1) and II (HR+/HER2−; cohort II trial conducted at a single center.
Methods:
Pathological response was assessed using the pathological complete response (pCR) and residual cancer burden (RCB) criteria as the primary efficacy endpoint. Safety and biomarkers were assessed.
Results:
In cohort 1, dose-limiting toxicities were Grade 2/3 diarrhea. Among the 10 evaluable patients from cohort 1 who underwent surgery, 5 achieved pCR (50%); in the intention-to-treat population of all 14 patients (counting drop-outs as nonresponders), the pCR rate was 36%. In cohort 2, 16 patients were enrolled, and 1 (6%) achieved pCR. Common adverse events (AEs) included Grade 2 alopecia, Grade 2/3 diarrhea, anemia, nausea, and neutropenia. High toxicity led to early closure of accrual. The median event-free survival in cohort 2 was 27.5 months, and was not reached for cohort 1 by data cutoff. Biomarker analysis showed that good responders (pCR + RCB-I) in both cohorts exhibited upregulation of immune-activating pathways, including interferon signaling and cytotoxic T-cell markers. By contrast, poor responders (RCB-II + RCB-III) showed immune-suppressive features, increased angiogenesis, proliferation, and anti-apoptotic gene expression.
Conclusion:
The addition of neratinib to neoadjuvant therapy showed potential in improving the pCR rate in HER2+ IBC (36% in this study) but not in HR+/HER2− (6%), though high toxicity was a major limiting factor. Further research is needed to optimize the balance between efficacy and safety. Biomarker analysis uncovered interesting new hypothesis-generating data warranting future study in IBC.
Trial registration:
ClinicalTrials.gov NCT03101748.
Plain language summary
Inflammatory breast cancer (IBC) is a rare and aggressive type of breast cancer. It spreads quickly, causing redness, swelling, and a pitted appearance of the skin on more than two-thirds of the breast. IBC is hard to treat, and even with combined treatments like chemotherapy, surgery, and radiation, the survival rate is much lower than for other breast cancers. This study aimed to find out if adding a drug called neratinib to the usual treatment could improve outcomes for IBC patients. Neratinib inhibits specific proteins like HER2 and EGFR that help cancer grow, potentially making it a valuable addition to the treatment plan.
We tested the safety and efficacy of neratinib combined with standard IBC treatment. We monitored side effects and measured how well the cancer responded using pCR and RCB criteria. In one group (Cohort 1), the main side effects were moderate to severe diarrhea, hair loss, nausea, anemia, fatigue, low potassium, and low white blood cell counts. Once the dose of neratinib was determined, 14 participants were enrolled in phase II and 5 (36%) achieved pCR. If we only count participants who went through surgery, the pCR was 50%. In another group (Cohort 2), out of 16 participants, only 1 (6%) had pCR. The addition of neratinib to standard treatment showed some promise in helping patients with IBC, especially in the HER2-positive subgroup, yet due to the high number of side effects we stopped adding new patients. More research is needed to find a balance between benefits and risks, and future studies may be warranted to improve the response while mitigating side effects.
Keywords
Background and rationale
Inflammatory breast cancer (IBC) is rare, but the most aggressive form of primary breast carcinoma, which has distinctive biological features and confers poor prognosis through local and distant metastasis and frequent recurrence.1–3 IBC is defined by a rapid onset of diffuse skin erythema and edema, involving more than two-third of the breast, resulting in a pitted appearance (peau d’orange), 4 as well as tenderness, induration, and warmth of the involved breast. 5 The outcome for patients with IBC is bleak despite multimodality treatment approaches; 3-year overall survival (OS) rates after combined multi-agent chemotherapy, surgery, and radiation are 40% compared to 80% for non-IBC.6–8 At present, combined-modality treatment, including neoadjuvant multi-agent chemotherapy, mastectomy, radiotherapy, and intensified adjuvant therapy, is the standard of care for IBC.6,9 The reduced response and survival rates are consistent regardless of molecular subtype: Hormone receptor positive (HR+)/human epidermal growth receptor (HER2 negative; HR+) and HER2 positive (HER2+). 8 Pathological complete response (pCR) of IBC predicts for longer-term survival, including OS and event-free survival (EFS), and therefore improving the pCR rate by enhanced neoadjuvant systemic treatment (NAST) is an attractive and effective strategy to improve outcomes of patients with IBC. 10
HER family members play a critical role in IBC.10–13 Neratinib, an irreversible pan-HER tyrosine kinase inhibitor (TKI), has demonstrated preclinical efficacy in inhibiting HER2 and epidermal growth factor receptor (EGFR) pathways, which are crucial in breast cancer growth and survival.14–17 By binding to the adenosine triphosphate (ATP)-binding pockets of these receptors, neratinib disrupts key signaling pathways such as Ras-Raf-MAPK and phosphoinositide-3 kinase (PI3K)/Akt pathway, thus inhibiting cell proliferation and inducing tumor cell apoptosis.15,18,19 Neratinib also showed efficacy compared to earlier generation pan-HER2 inhibitors, such as lapatinib, including cancers with HER2 mutations and increased HER2 dimerization, which are often resistant to existing therapies.15,17,19,20 Clinically, neratinib’s antitumor activity has been confirmed in various clinical trials, especially in patients with HER2-positive metastatic breast cancer.15,17,19 In early-stage breast cancer, an adjuvant trial confirmed its manageable toxicity profile and substantial efficacy at a dose of 240 mg per day, showing significant response rates and improvement in EFS in both trastuzumab-experienced and naïve patient groups, leading to the approval of neratinib for high-risk Her2-positive breast cancer. 19 Despite no overt expression of HER2, HR-positive IBC tumors often have activated Erb-B2 Receptor Tyrosine Kinase 2 (ERBB2) pathway-related genes. 21
Taken together, we hypothesized that the addition of neratinib to standard NAST would improve the pCR rate in both HER2+ and ER+/HER2− primary IBC by pan-HER activity that enhances the effective suppression of HER2 and EGFR. To test this hypothesis, we designed a single-center, phase Ib/II IBC dedicated neoadjuvant therapy clinical trial in stage III and added stage IV patients during dose confirmation on cohort I. Notably, approximately 30% of IBC patients present with de novo stage IV (metastatic) disease at diagnosis2,3; these patients are often excluded from trials and have poor outcomes. We therefore included both locally advanced (stage III) and de novo stage IV IBC patients in our trial to evaluate neratinib’s impact in both settings while confirming the dose of safe combination/efficacy.
Methods
Patients and methods
Patients with a confirmed diagnosis of non-triple-negative (either HR+ or HER2+) IBC were enrolled. Phase I portion of the study was set to determine the maximum tolerated dose (MTD) of neratinib in combination with paclitaxel, pertuzumab, and trastuzumab (TPH) in HER2+ metastatic or locally advanced (stage III) breast cancer within two cycles; thus, non-IBC patients were also enrolled if meeting the HER2 positivity and in need of innovative therapeutic trials. After the safe MTD was confirmed, the study progressed to the phase II portion of cohort 1: To determine the pCR rate of neratinib in combination with paclitaxel, pertuzumab, and trastuzumab followed by AC in HER2+ metastatic (stage IV) or locally advanced (stage III) IBC patients. For cohort 2, the objective was to determine the pCR rate of neratinib in combination with paclitaxel, followed by AC in HER2-negative/HR-positive (HER2−/HR+) metastatic or locally advanced IBC patients. Since the safety of neratinib + paclitaxel was confirmed in a previously reported trial, we did not conduct phase Ib for this cohort. 17 Second objectives include to estimate the 2-year EFS rate of HER2+ locally advanced IBC patients, and HER2−/HR+ IBC patients treated with full combination therapy per study combination (cohort I phase II and cohort II), and toxicity assessments. Detailed eligibility criteria are described in Supplemental Table 1. A CONSORT diagram summarizing patient screening, enrollment, and analysis populations for both cohorts is provided (Figure 1). The protocol (institutional protocol number 2016-0537) was reviewed and approved, monitored by the Institutional Review Committee as well as the Investigational New Drug office at the University of Texas MD Anderson Cancer Center, and all participants have signed informed consent.

CONSORT diagram.
Study design
Cohort 1 phase Ib (HER2-positive, any stage) used a Bayesian mTPI dose-escalation to determine the MTD of neratinib (5 dose levels tested). Up to 20 patients with HER2+ metastatic breast cancer or locally advanced IBC (including non-IBC patients) were included. Patients were treated at the chosen MTD in combination with paclitaxel plus trastuzumab (herception) plus pertuzumab (perject), THP in short. The primary endpoint was pCR at the end of neoadjuvant chemotherapy. The primary endpoint is the pCR rate at the end of neoadjuvant chemotherapy. For the phase II portion, a maximum of 31 patients were to be treated, although we expected the actual number to be less (see below). Toxicity was monitored in the phase II portion by the monitoring rule described below.
Cohort 1 phase II (HER2 positive, de novo and stage III): For phase II, a maximum of 31 patients was planned (Simon two-stage design) targeting an increase from a historical 39% pCR to 65%. We planned 11 patients in I stage, requiring ⩾6 pCR to expand to 31. We targeted a maximum one-sided alpha of 5% and a beta of 20%.8,13 If at least 17 total patients achieved pCR at the later stage, then we would conclude that the pCR rate in the HER2+ cohort is higher than the historical rate. If the true pCR rate in this cohort treated with the novel regimen was 40% or lower, the probability that the study would have stopped after the first look was at least 75% to minimize exposing patients to the toxicity of therapy without efficacy, as the futility analysis plan.
Cohort II (HR+, HER2−): Cohort 2 did not include a phase I escalation. Based on prior trial data (NSABP FB-7), we proceeded directly to phase II using a starting neratinib dose of 200 mg/day (instead of the full 240 mg) combined with weekly paclitaxel for four cycles, followed by AC ×4 cycles (neratinib was given only during the paclitaxel portion). For cohort II, the primary objective was to assess the efficacy of neratinib in combination with T followed by AC (without neratinib) in inducing pCR as an NAST regimen, in stage III or de novo IV HR-positive Her2-negative IBC patients. Secondary objectives included assessment of EFS, OS, as well as the safety and tolerability of the regimen. The exploratory objective was to assess the association between pCR and various gene expressions. Response was monitored by Simon’s two-stage design. 22 We targeted a maximum one-sided alpha of 5% and a beta of 20%. The historical pCR rate in these patients is 8.2%,8,13 which we hoped to increase to 25% with neratinib. To reject the null, we planned to enroll 16 patients in the first stage. If at least two patients attained pCR, then an additional 15 patients would be enrolled. If at least six patients of the total of 31 had pCR, we would have concluded that the pCR rate in HER2−/HR+ patients is higher than the set historical rate of 8.2%. If the true pCR rate in this group was 8.2% or lower, the probability that the study would stop after the first look was at least 61%.
Across both cohorts, our exploratory objectives include differential gene-expression, pathway-enrichment, and immune-signature analyses, testing the hypothesis that transcriptomic alterations in HER2 and its downstream pathways correlate with treatment response.
Anti-diarrheal prophylaxis regimen
In all three cohorts, patients initiated prophylactic anti-diarrheal medication (loperamide and budesonide) with the first dose of neratinib. Loperamide was used as prn, but budesonide 9 mg PO daily, days 1–28 was given prophylactically for diarrhea mitigation. Given the timing of the trial accrual before the recommended dose titration regimen, 23 we did not titrate the dose of neratinib in patients in cohort 2, who received 200 mg (5 capsules) of neratinib. This guideline has since been updated after our accrual was complete.
Analysis of the RNA-seq data
To identify differentially expressed genes (DEGs)24,25 and perform pathway enrichment analysis, we conducted gene set enrichment analysis (GSEA) 26 and differential expression analysis (DEA) using RNA-seq data. Initial quality control and normalization were performed using DESeq2 to ensure consistency across samples. For the DEA, samples were grouped based on experimental conditions, and DEGs were identified by applying a threshold of an adjusted p-value <0.05 and |log2 fold change| >1.
Following the DEA, we used GSEA to assess the enrichment of specific pathways. The GSEA was conducted using the clusterProfiler, 27 with each GO term representing a distinct gene set for enrichment analysis. Normalized enrichment scores and false discovery rates (FDR) were calculated for each term, with FDR <0.25 considered significant. Visualization of enriched pathways and DEG heatmaps was performed using ggplot2, Enrichr, or Cytoscape to create different plots as described below.
Heatmap
The clustering was performed using Pearson correlation as the distance metric and Ward’s D2 method for hierarchical clustering. Gene expression levels are represented by color intensity, with green indicating lower expression and red indicating higher expression. Samples are divided into two response categories: “Cohort2_good_response” (indicated by blue) and “Cohort2_poor_response” (indicated by yellow). Each row represents a gene, while each column represents an individual sample within the cohort. Notable differences in gene expression patterns between the two response groups are visible, providing insights into potential biomarkers or pathways associated with treatment efficacy.
Volcano plot
To filter out genes of interest that are both biologically meaningful and statistically reliable, we utilized the data to formulate a plot featuring the logarithm of statistical significance (e.g., −log10(p-value)−log10 (p-value)) on the y-axis and the logarithm of the fold change on the x-axis. This unique combination helps in visualizing the relationship between the magnitude of change and the statistical significance of each data point, often genes or proteins. 28 To visualize the data better, data points that are significantly different in expression and have large fold changes (either upregulated or downregulated) will appear on the top left or right corners of the plot, making them easy to identify.
Results
Participants characteristics
The median age varied among cohorts, indicating diverse age distributions. Most patients were identified as White or Caucasian, although Black or African American, Asian, and other racial groups were also represented. Ethnic distribution included Hispanic, Non-Hispanic, and Unknown, with a notably higher proportion of Hispanic patients in cohort 1 phase II. Regarding breast cancer type, all patients in cohort 1 phase II, and cohort II had IBC, while cohort 1 phase Ib consisted entirely of non-IBC cases. HR status varied, with a significant prevalence of estrogen receptor (ER) and progesterone receptor (PR) positivity observed in cohort II. HER2 status differed notably, with cohort 1 patients uniformly HER2-positive, whereas all patients in cohort II were HER2-negative. Nuclear grade distribution indicated predominantly high-grade tumors (Grade 3) in cohort 1 phase II, while cohort II showed an equal distribution between Grades 2 and 3. Nodal involvement varied across cohorts, reflecting differences in disease extent. Metastatic status showed a higher occurrence of metastatic cases (M1) in cohort 1 phase Ib, whereas most patients in cohort 1 phase II and cohort II were non-metastatic (M0). These characteristics are summarized in Table 1. The first patient was accrued on February 19, 2018, and the last one on October 20, 2021.
Clinical characteristics and demographics of participants.

This table presents the demographic and clinical characteristics of patients across different cohorts: cohort 1 phase Ib (n = 4), cohort 1 phase II (n = 14), and cohort II (n = 16). Ethnicity is categorized as Hispanic, Not Hispanic, or Unknown, with a notable percentage of Hispanic patients in Cohort 1 phase II. Hormone receptor status is provided, with ER and PR positivity varying across cohorts; Cohort II shows a high prevalence of hormone receptor positivity. HER2 status also differs, with all patients in cohort 1 being HER2-positive, while cohort II is exclusively HER2-negative. Metastatic status (M stage) indicates a higher prevalence of metastatic cases (M1) in cohort 1 phase Ib, with the majority of cohort 1 phase II and cohort II patients being non-metastatic (M0).
ER, estrogen receptor; HER2, human epidermal receptor 2; IBC, inflammatory breast cancer; PR, progesterone receptor.
Primary endpoint of each cohort (patient disposition is detailed in the CONSORT diagram)
Cohort I phase Ib: A total of four patients were enrolled until the recommended phase II dose (RP2D) of neratinib was established at 80 mg as a safe combination with the backbone systemic therapy with THP. Patients who received 120 mg of neratinib mainly suffered grade (Gr) 2 and 3 diarrhea, noted as key dose-limiting toxicities (DLT; Table 2).
Cohort 1 phase Ib Grade 2 and 3 toxicities.
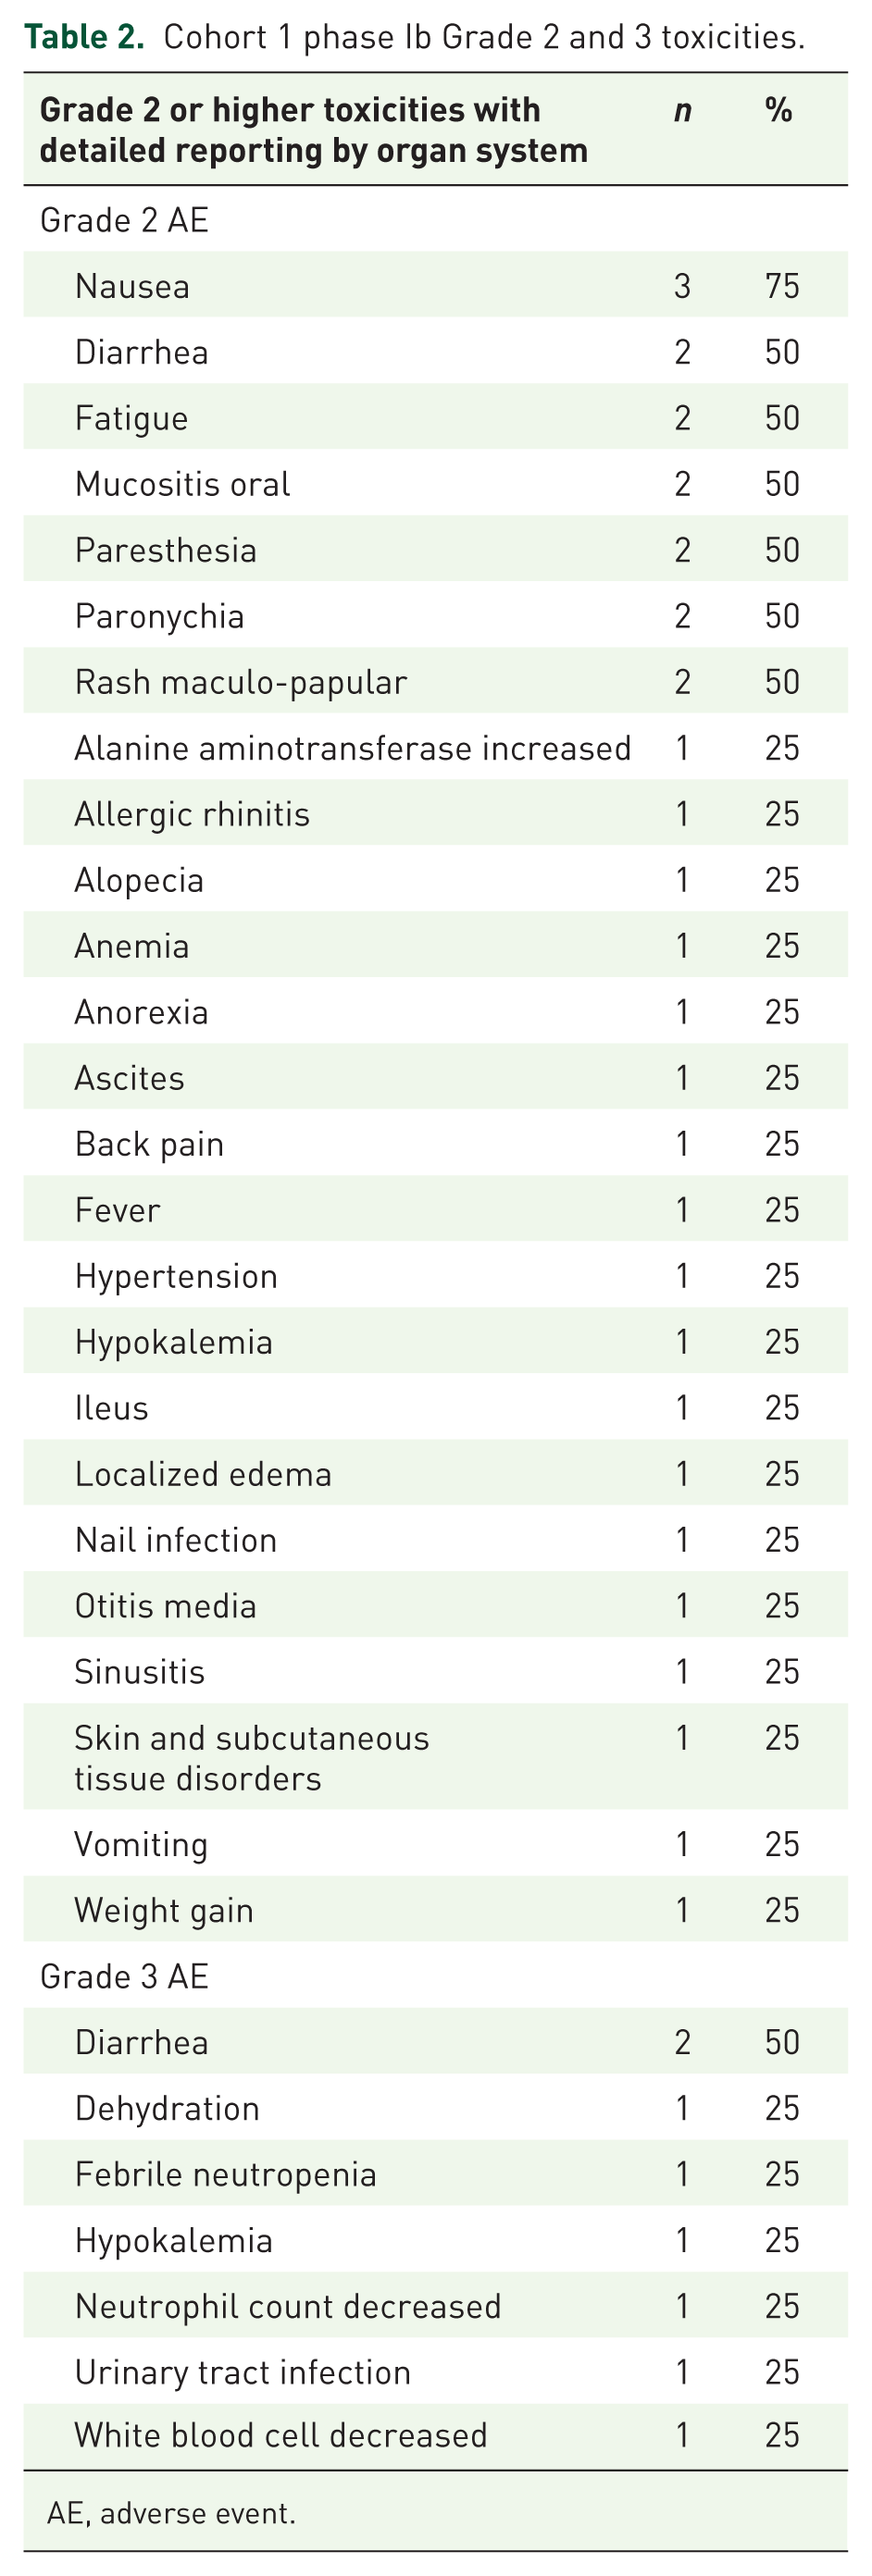
AE, adverse event.
Cohort 1 phase II: Patients with HER2+ IBC received the combination of neratinib at RP2D with THP × 4 cycles followed by AC × 4 cycles in the phase II setting. Among 14 patients who were treated in cohort 1 phase II, only 10 patients who underwent surgery were evaluable for the primary endpoint. Three patients stopped study treatment early due to toxicity (27%), were deemed non-evaluable and replaced for efficacy evaluation, but were included in the intention-to-treat (ITT) population (details described in the Supplemental Table 2). Among the 10 evaluable patients who underwent surgery, five achieved pCR (50%); in the ITT population of all 14 patients (counting drop-outs as non-responders), the pCR rate was 36% (Tables 3 and 4; Figure 2).
Cohort 1 phase II AE summary (after determined recommended phase II dose: neratinib + trastuzumab + pertuzumab + paclitaxel).

Cohort 2 AE summary.


Post-neoadjuvant systemic therapy (NAST) response per cohort.
Cohort 2: Cohort 2 only had a phase II portion. Patients mostly tolerated our proposed combination dose of neratinib 200 mg/day (reduced dose compared to the full approved single-agent dose 240 mg) along with weekly paclitaxel (T) × 4 cycles followed by AC × 4 cycles (without neratinib). Out of 16 patients enrolled in this cohort, only 10 underwent surgery as evaluable patients. When including all 16 patients (ITT), the pCR rate was 6%, similar to the ~8% historical pCR for HR+ IBC (Figure 2). The remaining six patients could not tolerate the treatment and either progressed to become metastatic, non-operable, or did not undergo surgery while on protocol (details described in the Supplemental Table 2). When including all 16 patients as the ITT population, the rate of pCR was only 6%, like the historical rate of pCR in HR+ IBC. Four patients achieved residual cancer burden (RCB) II, and five patients achieved RCB-III. After interim futility analysis, it was recommended that the trial stop new patient accrual, given high toxicity and poor efficacy.
Survival
Cohort 1 (HER2+): Using the ITT population (n = 14), median EFS and OS were not yet reached. Two patients had progression (one died 15 months from enrollment) in cohort 1. Among 16 patients, median EFS was 27.5 months (1–38). Although cohorts 1 and 2 were separate single-arm cohorts (not a randomized comparison), their EFS outcomes are displayed side-by-side for descriptive purposes.
Cohort 2’s survival curve declined more rapidly (Figure 3). The median EFS was 27.5 months (1–38 months; Figure 3). Similar to cohort 1, three patients who were noted to have sustained side effects had short interval progression (0–1 months). At the time of data closure, 6/16 patients have progressed (31%), among whom 4 patients passed away.

Kaplan–Meier survival curve for cohort 1 and cohort 2.
Comparing these two-phase II cohorts, cohort 1 demonstrates a higher survival probability over time compared to cohort 2, with fewer events of disease progression or death observed. The survival probability of cohort 2 declined more rapidly over time compared to cohort 1 (Figure 3).
Side effects and toxicities
In cohort 1 phase I, the most frequent DLT was prolonged Grade 2 diarrhea (with one Grade 3) at higher doses. In phase II, more than half of patients in both cohorts required dose reductions. In cohort 2, patients received the lower than previously tested combination dose of neratinib due to toxicity. Notably, cohort 2 started at a lower neratinib dose (200 mg vs the full 240 mg) due to expected toxicity. The toxicity profile was consistent with the known additive effects of neratinib plus chemotherapy. Diarrhea was the most common treatment-related adverse event (AE), occurring in 92% of patients (Grade ⩾3 in 29%). Our protocol mandated prophylactic loperamide and budesonide during cycle 1, given that diarrhea is typically most severe in the first month. (The phase II CONTROL study of neratinib, reported during our trial, later showed that a dose-escalation strategy improves tolerability; our trial did not incorporate dose escalation, which may have contributed to the higher toxicity observed.) Other common AEs included alopecia, nausea/vomiting, fatigue, anemia, and neutropenia. High toxicity necessitated early closure of enrollment in both cohorts. The side effects are summarized in Table 2.
Tolerance to neratinib
In both cohorts, 56% of patients required dose reductions of neratinib during more than half of NAST. In cohort 1, 64% of patients required a dose reduction from 80 to 40 mg, and 50% patients underwent a dose reduction to 160 mg in cohort 2.
Gene expression and response to NAST
We performed the gene sequence enrichment analysis (GSEA) using six GO terms, 29 and analyzed DEGs to determine potential contributors of poor versus good response to the NAST in both cohorts. Patients were separated into good responders (pCR + RCB-I) versus poor responders (RCB-II + RCB-III). Gene expression was compared among poor responders over good responders in each cohort.
In cohort 1 GSEA most notably, keratinization pathways (e.g., KRTAP4-3, KRTA4-2, KRTAP4-1, KRTAP22-1, KRTAP25-1, KRTAP15-1), olfactory genes (e.g., OR52E6, OR8K5, OR6C70, OR6C6, OR10G7, OR13C3, OR2J3, OR8U1), and less studied long non-coding RNAs like RP11-130H16.18, RP11-294C11.1, RP11-360D2.1 were shown to be upregulated among good responders, suggesting new biological pathways that require further study (Figure 4). Genes that have previously been shown to have upregulation on the IBC-like transforming growth factor (TGF) beta pathways or interferon (IFN) pathways are also noted to be upregulated.

Heatmap of gene set expression analysis (GSEA) and volcano plot of DEGs between good and poor responders in cohort 1. (a) In the cohort 1, several notable genes show distinct expression patterns. Cell adhesion and matrix genes, including the keratinization pathway, were upregulated in poor response, while previously known positive immune regulations like T-cell activation and interferon signaling were upregulated in the good response group. (b) This volcano plot displays the DEGs between poor and good responders in cohort 1, highlighting genes with significant changes in expression. The x-axis represents the log2FC, while the y-axis represents the −log10 p-value, indicating statistical significance. Genes with a FDR ⩽ 0.1 and an absolute log2FC ⩾ 0.585 are colored according to FDR (color gradient) and log2FC (intensity of color). The top 120 most significant genes were captured, including TMEM110, OR4X1, and IFNA16, indicating notable differences between the two groups. Genes to the right of the plot are upregulated in good responders, while those to the left are upregulated in poor responders, reflecting the underlying biological processes driving the differential treatment response. A detailed list of genes is included in the Supplemental Material.
In cohort 2 GESA, we identified immune-related genes that are known to be more relevant in triple-negative breast cancers (Figure 5). For example, the heatmap reveals distinct patterns of gene expression that highlight notable genes and their related pathways, which may help explain variations in treatment responses. For instance, genes like PD-L1 (CD274) and CTLA4, both associated with immune checkpoint pathways, show differential expression (be explicit about high in which), suggesting that an immune-suppressive tumor environment could contribute to poor responses. IFNG and CXCL10, involved in the JAK-STAT and chemokine signaling pathways, respectively, may correlate with immune cell recruitment and activation, potentially enhancing treatment efficacy in good responders. Similarly, FOXP3 expression, a marker of regulatory T cells, may indicate an immunosuppressive environment. In addition, genes associated with tumor growth and angiogenesis, like VEGFA, show increased expression in poor responders, hinting at a more aggressive, angiogenic phenotype that could drive resistance to therapy. Cell proliferation markers such as MKI67, linked to the cell cycle pathway, and anti-apoptotic genes like BCL2 might indicate rapid tumor growth and resistance to cell death, further contributing to treatment resistance. Meanwhile, the presence of CD8A, associated with cytotoxic T cells, and STAT1 from the JAK-STAT pathway.

Heatmap of GSEA and volcano plot of DEGs between good and poor responders in cohort 2. (a) This heatmap illustrates the differential expression of genes in cohort 2 based on treatment response. The clustering was performed using Pearson correlation as the distance metric and Ward’s D2 method for hierarchical clustering. Gene expression levels are represented by color intensity, with green indicating lower expression and red indicating higher expression. Samples are divided into two response categories: “Cohort2_good_response” (indicated by blue) and “Cohort2_poor_response” (indicated by yellow). Each row represents a gene, while each column represents an individual sample within the cohort. A detailed list of genes is included in the Supplemental Material. (b) Genes with a FDR ⩽ 0.1 are highlighted in green, while those with an absolute log2FC ⩾ 0.585 are marked in blue. Genes that meet both criteria (FDR ⩽0.1 and absolute log2FC ⩾0.585) are highlighted in red, representing the most significant and DEGs. This plot illustrates genes with the highest expression differences between response groups, highlighting candidates for further investigation into their roles in treatment response.
Discussion
Here, we report a clinical trial showing a signal of improved pCR rate with the addition of the pan-HER2 inhibitor neratinib in HER2-positive IBC, although the trial was closed early due to toxicity. No improvement in pCR was observed in HR+/HER2− IBC. In the HER2+ cohort, the observed ITT pCR rate of 36% (50% among patients completing therapy) was comparable to our historical ~39% pCR for similar patients, suggesting only a modest benefit from neratinib when considering all enrolled patients. While the HER2-positive subtype of IBC may derive some benefit from adding neratinib, the increased toxicity led us to stop the trial before full accrual. More than half of patients in both cohorts required dose reductions. In fact, cohort 2 employed a reduced starting dose of neratinib yet still faced substantial toxicity.
In IBC, the incidence of HER2 overexpression is higher than in non-IBC breast cancers (up to 40%, with about half of those also HR+). Multiple NCCN-endorsed neoadjuvant regimens for HER2-driven breast cancer incorporate dual HER2 blockade (trastuzumab + pertuzumab)30–35 with a taxane, sometimes followed by anthracycline. The optimal regimen to maximize pCR in HER2+ IBC remains undefined, though international consensus supports sequential taxane–anthracycline chemotherapy. 36 Here, we demonstrated the potential of adding a TKI to standard therapy in the HER2+ IBC subgroup. However, an optimal predictive biomarker or combination strategy that minimizes additive toxicity needs further investigation, especially given the toxicity challenges observed.
Our gene expression analyses yielded in-depth exploratory findings. Responders versus non-responders (pCR/RCB-I vs RCB-II/III) displayed distinct gene signatures, regardless of HER2 status. Both cohorts showed that response to therapy is influenced by immune modulation, tumor aggressiveness, and microenvironment dynamics. The presence of CD8A and STAT1 from the cohort 2 analysis may reflect an active immune response in good responders, suggesting potential sensitivity to immune-based therapies. These gene–pathway relationships we observed also underscore the complex interplay of immune modulation, apoptosis, angiogenesis, and cell proliferation.
In summary, good responders (pCR + RCB-I) in both cohorts showed upregulation of immune-activating pathways (e.g., interferon signaling genes IFNG, STAT1, CXCL10, and cytotoxic T-cell markers like CD8A). Poor responders (RCB-II/III) exhibited more immunosuppressive features with higher expression of checkpoint regulators PD-L1 and CTLA4 (in poor responders) and FOXP3, along with increased angiogenesis (VEGFA), proliferation (MKI67), and anti-apoptotic gene expression (BCL2), indicative of a more aggressive tumor phenotype. These findings suggest that an immune-cold tumor microenvironment (with elevated checkpoint molecules and T_reg markers) and pro-tumor pathways could contribute to poor response, whereas an active T-cell/inflammatory milieu is associated with better response.
Despite some differences (e.g., keratinization pathway genes highlighted in cohort 1 and immune-checkpoint genes in cohort 2), both cohorts underline the interplay of immune activation and suppression in determining response. These findings are hypothesis generating: for example, the upregulation of immune pathways in good responders hints that strategies to stimulate the tumor immune microenvironment could enhance treatment efficacy, whereas the prominence of angiogenesis and proliferation pathways in poor responders suggests potential targets for overcoming resistance.
Limitations
This study is limited by a small sample size and a single-center design. In addition, the follow-up duration was relatively short, particularly for the HR+ cohort, which may limit conclusions about long-term outcomes (e.g., late recurrences in HR+ disease). The lack of a randomized control arm means improvements in pCR or EFS is interpreted against historical benchmarks rather than a contemporary control. Finally, while neratinib showed some signal of benefit in HER2+ IBC, the significant toxicity—despite aggressive prophylaxis—underscores the need for improved supportive care (such as refined anti-diarrheal strategies or dose adjustment protocols like dose escalation).
Conclusion
In summary, adding neratinib to neoadjuvant therapy for IBC yielded a modest increase in pathological response in the HER2-positive cohort at the expense of considerable toxicity, with no evident benefit in the HR-positive/HER2-negative cohort. Research dedicated to IBC is limited, so evaluating new therapeutic strategies in this population is particularly valuable. Because neoadjuvant data on pan-HER inhibitors (e.g., neratinib) are scarce, our study adds important evidence: a promising 36% pCR rate in the HER2-positive cohort and, conversely, a very low 6% pCR rate coupled with substantial toxicity in the HR+/HER2-negative group. Ongoing and future efforts should focus on identifying predictive biomarkers to select patients most likely to benefit from such intensified regimens, and on refining therapeutic combinations or dosing (e.g., staggered or lower dosing, better prophylactic measures) to balance efficacy with tolerable toxicity. Our transcriptomic findings unveiled novel gene expression patterns in IBC (such as keratinization and olfactory receptor pathways) that warrant further study as potential biomarkers or therapeutic targets outside of this specific trial. These insights lay the groundwork for future research to develop more personalized, tolerable, and effective treatment strategies for this aggressive breast cancer subtype.
Supplemental Material
sj-docx-1-tam-10.1177_17588359251379392 – Supplemental material for A phase Ib/II trial of neoadjuvant neratinib added to standard therapy in patients with HER2-positive or HR-positive/HER2-negative inflammatory breast cancer (including stage III and IV disease)
Supplemental material, sj-docx-1-tam-10.1177_17588359251379392 for A phase Ib/II trial of neoadjuvant neratinib added to standard therapy in patients with HER2-positive or HR-positive/HER2-negative inflammatory breast cancer (including stage III and IV disease) by Bora Lim, Angela Marx, Megumi Kai, Angela Alexander, Roland Bassett, Wencai Ma, Jie Willey, Huiming Sun, Azadeh Nasrazadani, Mohammad M. Mohammad, Jianhua Zhang, Anthony Lucci, Susie X. Sun, Michael C. Stauder, Gary J. Whitman, Huong Le-Petross, Vicente Valero, Wendy A. Woodward and Rachel M. Layman in Therapeutic Advances in Medical Oncology
Footnotes
Acknowledgements
We appreciate Reginald Maxwell, Sr. Systems Analyst at MDACC, who helped organize, store, and distribute transcriptomic data for further analysis. MDACC Inflammatory Breast Cancer Team includes below members: Sadia Saleem, Vicente Valero, Bora Lim, Azadeh Nasrazadani, Rachel M. Layman, Anthony Lucci, Susie Xinying Sun, Wendy Woodward, Michael C. Stauder, Tanya Moseley, Gary J. Whitman, Huong Le-Petross, Miral Mahesh Patel, Yang Lu, Savitri Krishnamurthy, Lei Huo, Yun Gong, Angela N. Marx, Angela Alexander, Chasity L. Yajima, Angela T. Muhammad-Ali, Megumi Kai, Vivian Y. Chiv, Sanda Tin, Lily A. Villarreal, and Heather B. Lopez. We especially appreciate all participating patients and their families.
Declarations
Supplemental material
Supplemental material for this article is available online.
References
Supplementary Material
Please find the following supplemental material available below.
For Open Access articles published under a Creative Commons License, all supplemental material carries the same license as the article it is associated with.
For non-Open Access articles published, all supplemental material carries a non-exclusive license, and permission requests for re-use of supplemental material or any part of supplemental material shall be sent directly to the copyright owner as specified in the copyright notice associated with the article.