
Abstract
Background:
Identification of hypopharyngeal cancer (HPC) patients at heightened risk for developing metachronous second primary esophageal cancer (MSPEC) is crucial for the optimization of screening protocols and thus survival improvement. Although mean corpuscular volume (MCV) is recognized as a biomarker for esophageal cancer, its association with MSPEC among HPC patients remains unexplored.
Objective:
This study aimed to investigate the predictive value of MCV for MSPEC in HPC patients.
Design:
In this 19-year retrospective, nested case–control study, HPC patients from the Chang Gung Research Database between January 2001, and December 2019, were examined.
Methods:
A total of 114 HPC patients who developed MSPEC were matched with 1895 non-MSPEC controls in a 1:3 propensity score-matched analysis. Logistic regression models were deployed to assess the odds of MSPEC manifestation in relation to MCV levels.
Results:
Matching for clinical characteristics and follow-up periods yielded 96 MSPEC patients and 288 matched controls. Elevated MCV levels were associated with an increased risk of MSPEC, indicating a dose–response relationship. Specifically, MCV ranges from 95 to 100 femtoliters (fL) and ⩾100 fL correlated with adjusted odds ratios for MSPEC of 2.37 (95% confidence interval (CI): 1.33–4.24) and 4.84 (95% CI: 2.62–8.95), respectively. Notably, an MCV ⩾100 fL was a more pronounced predictor of MSPEC among younger patients and those with advanced disease stages. Within the initial cohort of 2009 HPC patients, 31 (2.9%) of 1052 patients with MCV <95 fL developed MSPEC, and 46 (11.5%) of 401 patients with MCV ⩾100 fL experienced MSPEC.
Conclusion:
Macrocytosis at HPC diagnosis is indicative of an escalated MSPEC risk, underscoring the imperative for intensive surveillance.
Keywords
Introduction
Despite improvements in multidisciplinary treatments, hypopharyngeal cancer (HPC) is associated with the worst survival among head and neck cancers (HNCs). 1 The leading cause of poor prognosis in these patients is second primary cancer (SPC), which is generally caused by the “field cancerization” effect of alcohol, tobacco, and betel nut exposure. 2 Among HNC patients, those with HPC have the highest risk of second primary esophageal cancer and the worst overall survival. 3 Despite screening for pretreatment esophageal cancer, metachronous second primary esophageal cancers (MSPECs) develop in 15.6% of HPC patients. 4 Early recognition and prevention of MSPECs during surveillance are essential to achieve a good prognosis. 5 Therefore, it is important to identify HPC patients who are at an increased risk of MSPEC.
The sequelae and anatomical alterations associated with the primary treatment of HPC complicate the surveillance and early detection of MSPECs. In addition, the typical symptoms of esophageal cancer, including odynophagia and dysphagia, are common after surgery and radiotherapy, making early diagnosis of MSPECs particularly challenging. Efficient surveillance strategies are therefore required to improve detection rates. 6 Alcohol consumption is a well-established risk factor for esophageal cancer 7 and is also associated with elevated mean corpuscular volume (MCV), a routine biomarker of chronic alcohol consumption. 8 Furthermore, macrocytosis itself has been linked to both incidence and prognosis of esophageal malignancies.9,10 Previous single-center studies encompassing all HNC subsites have shown that elevated MCV is associated with a higher incidence of esophageal SPCs 11 and correlates with poorer overall and progression-free survival. 12 However, these investigations were limited by small sample sizes and single-center designs that restrict generalizability, and—crucially—they did not focus exclusively on HPC, the subsite at greatest risk for MSPEC. Consequently, the predictive value of baseline MCV for MSPEC in HPC patients remains unclear.
To address this gap, we conducted a multicenter nested case–control study to evaluate whether macrocytosis at the time of HPC diagnosis predicts subsequent development of MSPEC, aiming to establish MCV as a readily available biomarker for risk stratification in clinical surveillance.
Materials and methods
Data collection
Data were retrieved from the Chang Gung Research Database (CGRD) in Taiwan. This de-identified database includes the electronic medical records of the seven branches of Chang Gung Memorial Hospital (CGMH), located from the northeast to the southern regions of Taiwan. Because most branches of the CGMH are tertiary care centers, the study population had a significantly higher prevalence and severity of certain diseases compared to the national database. 13 The CGRD records diagnoses according to the codes of the International Classification of Diseases, ninth and tenth editions, Clinical Modification (ICD-9-CM and ICD-10-CM, respectively). Specialized personnel responsible for coding diagnoses coded the main diagnoses and sub-diagnoses for inpatient claims. For outpatient claims, the claims data were randomly inspected by the National Health Insurance Administration. The cancer data in the CGRD are linked to the Taiwan Cancer Registry, which increases the accuracy of the CGRD. The CGRD is therefore widely used. 14 This study was approved, and the requirement for participant consent was waived by the Institutional Review Board of the Kaohsiung branch of CGMH (approval nos. 202101067B0 and 202201652B0).
Patient population
This multicenter nested case–control study (Figure S1) included HPC patients diagnosed between January 1, 2001, and December 31, 2019, whose information was registered with both the CGRD and Taiwan Cancer Registry (n = 2463). HPC patients were identified using diagnostic codes 1480–1483, 1488, and 1489 (ICD-9-CM), and C12, C130–132, C138, and C139 (ICD-10-CM). Patients with stage 0, unidentified stage, or missing data were excluded from the study (n = 165). Patients with unavailable complete blood count (CBC) data within 90 days of the HPC diagnosis were also excluded (n = 35). To compare HPC patients with and without MSPEC, we excluded those who were diagnosed with esophageal cancer before or synchronously with HPC (n = 254). Synchronous cancer was defined as a diagnosis of cancer within 6 months of the primary cancer. 15 Based on the aforementioned eligibility criteria, 2009 HPC patients were included in the study (Table 1).
Demographic and clinical characteristics of patients with hypopharyngeal cancer before matching.

AJCC, American Joint Committee on Cancer; CCRT, concurrent chemoradiotherapy; fL, femtoliters; HPC, hypopharyngeal carcinoma; IQR, interquartile range; MCH, mean corpuscular hemoglobin; MCHC, mean corpuscular hemoglobin concentration; MCV, mean corpuscular volume; MSPEC, metachronous second primary esophageal cancer; RBC, red blood cell; RT, radiotherapy; WBC, white blood cell.
Study design and variable definitions
Case–control definition and diagnostic criteria
We conducted a multicenter nested case–control study of patients diagnosed with HPC between 2001 and 2019. MSPEC was identified by relevant ICD codes (ICD-9-CM: 1500–1505, 1508–1509; ICD-10-CM: C153–155, C158–159) recorded ⩾6 months after initial HPC diagnosis. Patients who developed MSPEC during follow-up were classified as cases, and those without MSPEC formed the control pool. All diagnoses of both HPC and MSPEC were confirmed by board-certified pathologists on formalin-fixed, paraffin-embedded specimens, with additional verification through linkage to the Taiwan Cancer Registry.
To ensure comparable observation periods, each case’s index interval (time from HPC diagnosis to MSPEC) was matched to potential controls before propensity score–matching (PSM). We then applied 1:3 PSM—using a logistic regression model that included age at diagnosis, sex, AJCC stage, primary treatment modality, year of diagnosis, and index interval—to balance baseline characteristics (Table S1).
Exposure assessment
Baseline CBC data within 90 days of HPC diagnosis were retrieved for all subjects; when multiple tests were available, the result closest to the diagnosis date was selected. The primary exposure, MCV, was measured by automated hematology analyzers and analyzed both as a continuous variable and categorically according to institutional reference ranges.
Covariates and effect modifiers
We adjusted for potential confounders known or suspected to influence both MCV and MSPEC risk (Figure S2), including age at diagnosis (years), sex, and comorbidities (hypertension, diabetes mellitus, dyslipidemia). Possible effect modification by alcohol consumption was evaluated by conducting subgroup analyses stratified by alcohol use, comparing the point estimates of the MCV-MSPEC association between strata in multivariable logistic regression models.
Statistical analysis
Descriptive analysis was used to summarize the demographic and clinical characteristics of study patients. Non-parametric continuous data (e.g., age and laboratory parameters) were analyzed using the Mann–Whitney U test. Categorical variables were compared using a two-sided Pearson’s Chi-square test or a two-sided Fisher’s exact test, as appropriate. The Kaplan–Meier estimator and log-rank test were employed to appraise differences in the accumulation risk of MSPEC by different MCV levels. Data were further analyzed from the 1:3 PSM cohort (cases vs controls), which had been identified by the Greedy method using SAS software (version 9.4; SAS Institute Inc., Cary, NC, USA). 16 Logistic regression was used to test the crude and adjusted effects of different MCV levels on the risk of MSPEC. The main adjusted model was constructed according to the causal directed acyclic graphs (DAGs; Figure S2). 17 Sensitivity analysis was performed using an adjusted model with stepwise solution (α-level for entry and removal = 0.25). To determine whether some characteristics affect the potential effects of MCV on MSPEC, we performed crude and adjusted analyses stratified by age, clinical AJCC stage, and alcohol consumption, respectively. Statistical analyses were performed using SAS software (SAS Institute Inc.). p < 0.05 was considered statistically significant. The reporting of this study conforms to the STROBE statement (Supplemental File S2). 18
Results
Baseline characteristics of the case–control cohort
In total, 2463 HPC patients diagnosed between January 1, 2001, and December 31, 2019, were enrolled. Of the 2463 HPC patients, 2009 fulfilled the study eligibility criteria. MSPEC was confirmed in 114 patients, constituting 5.7% of the study cohort, with a median duration of follow-up prior to the index date being 30 months. MSPEC patients had a longer follow-up period, were significantly younger, and had earlier-stage disease and a higher proportion of combined treatment (surgery plus radiotherapy/concurrent chemoradiotherapy) compared to the controls. In addition, the laboratory parameters varied between cases and controls; notably, MSPEC patients exhibited a significantly higher MCV than controls (Table 1).
Baseline characteristics of the PSM nested case–control cohort
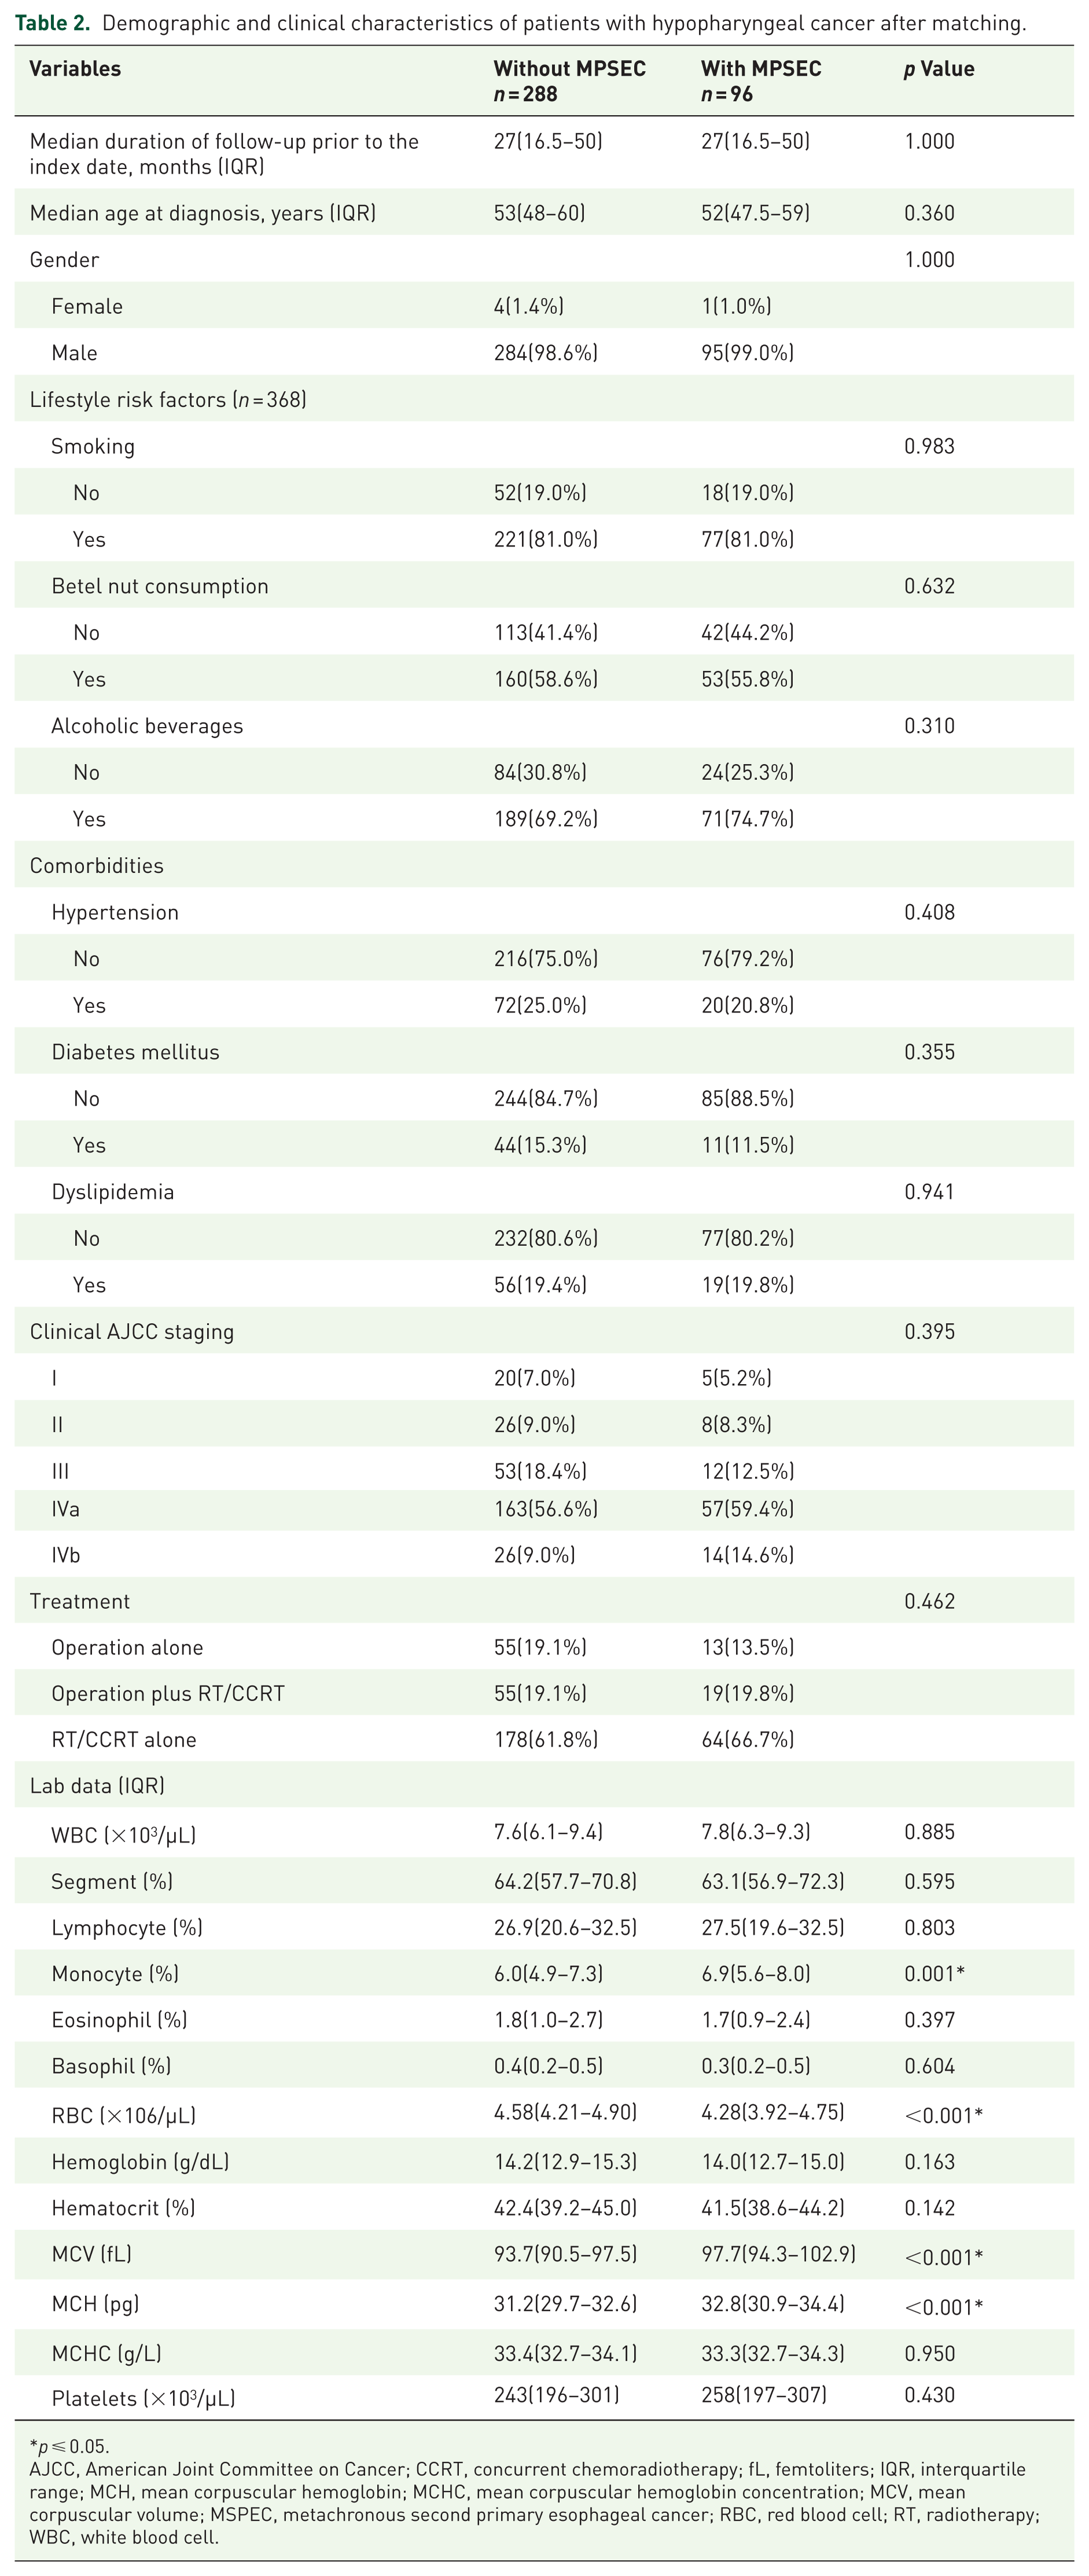
In total, 384 patients remained after performing 1:3 PSM to balance the clinical covariates between the cases and controls. Of the 384 patients, 96 developed MSPEC, whereas 288 did not (Table 2). Only the monocyte ratio, RBC count, and MCV and MCH levels were significantly associated with the development of MSPEC. HPC patients with MSPEC had a lower RBC count and higher MCV and MCH levels, compared to those without MSPEC, after controlling for the clinical covariates and follow-up period.
Demographic and clinical characteristics of patients with hypopharyngeal cancer after matching.
p ⩽ 0.05.
AJCC, American Joint Committee on Cancer; CCRT, concurrent chemoradiotherapy; fL, femtoliters; IQR, interquartile range; MCH, mean corpuscular hemoglobin; MCHC, mean corpuscular hemoglobin concentration; MCV, mean corpuscular volume; MSPEC, metachronous second primary esophageal cancer; RBC, red blood cell; RT, radiotherapy; WBC, white blood cell.
Modeling for the effects of different MCV intervals on the MSPEC risk
Model specifications
A series of logistic regression models was constructed as follows:
Crude model: includes only the primary exposure (MCV) without adjustment for any covariates, providing the unadjusted association between MCV and MSPEC risk.
Model 1: adjusts for prespecified confounders identified a priori by DAGs (Figure S2)—namely age, sex, hypertension, diabetes mellitus, and dyslipidemia. Alcohol consumption was not included in this model, as we have treated it primarily as a potential effect modifier rather than a confounder; its influence is formally assessed in subsequent stratified analyses.
Model 2: adjusts for age, sex, monocyte count, and platelet count, selected via stepwise procedures in the statistical software as the most parsimonious set of predictors.
Five interval analysis
To investigate the relationship between MCV and the risk of MSPEC, we first stratified HPC patients into five MCV categories based on values measured within 90 days of initial diagnosis (Table 3). The 85–90 fL interval, which exhibited the lowest MSPEC odds (4/41), was designated as the reference group. All models demonstrated elevated odds of MSPEC in patients with MCV <85 or >90 fL compared with the reference interval. Moreover, both crude and adjusted models showed a progressive increase in the odds ratio (OR) for MSPEC with rising MCV.
Modeling for the effects of different MCV intervals at the initial diagnosis of hypopharyngeal cancer on the risk of developing secondary esophageal cancer.
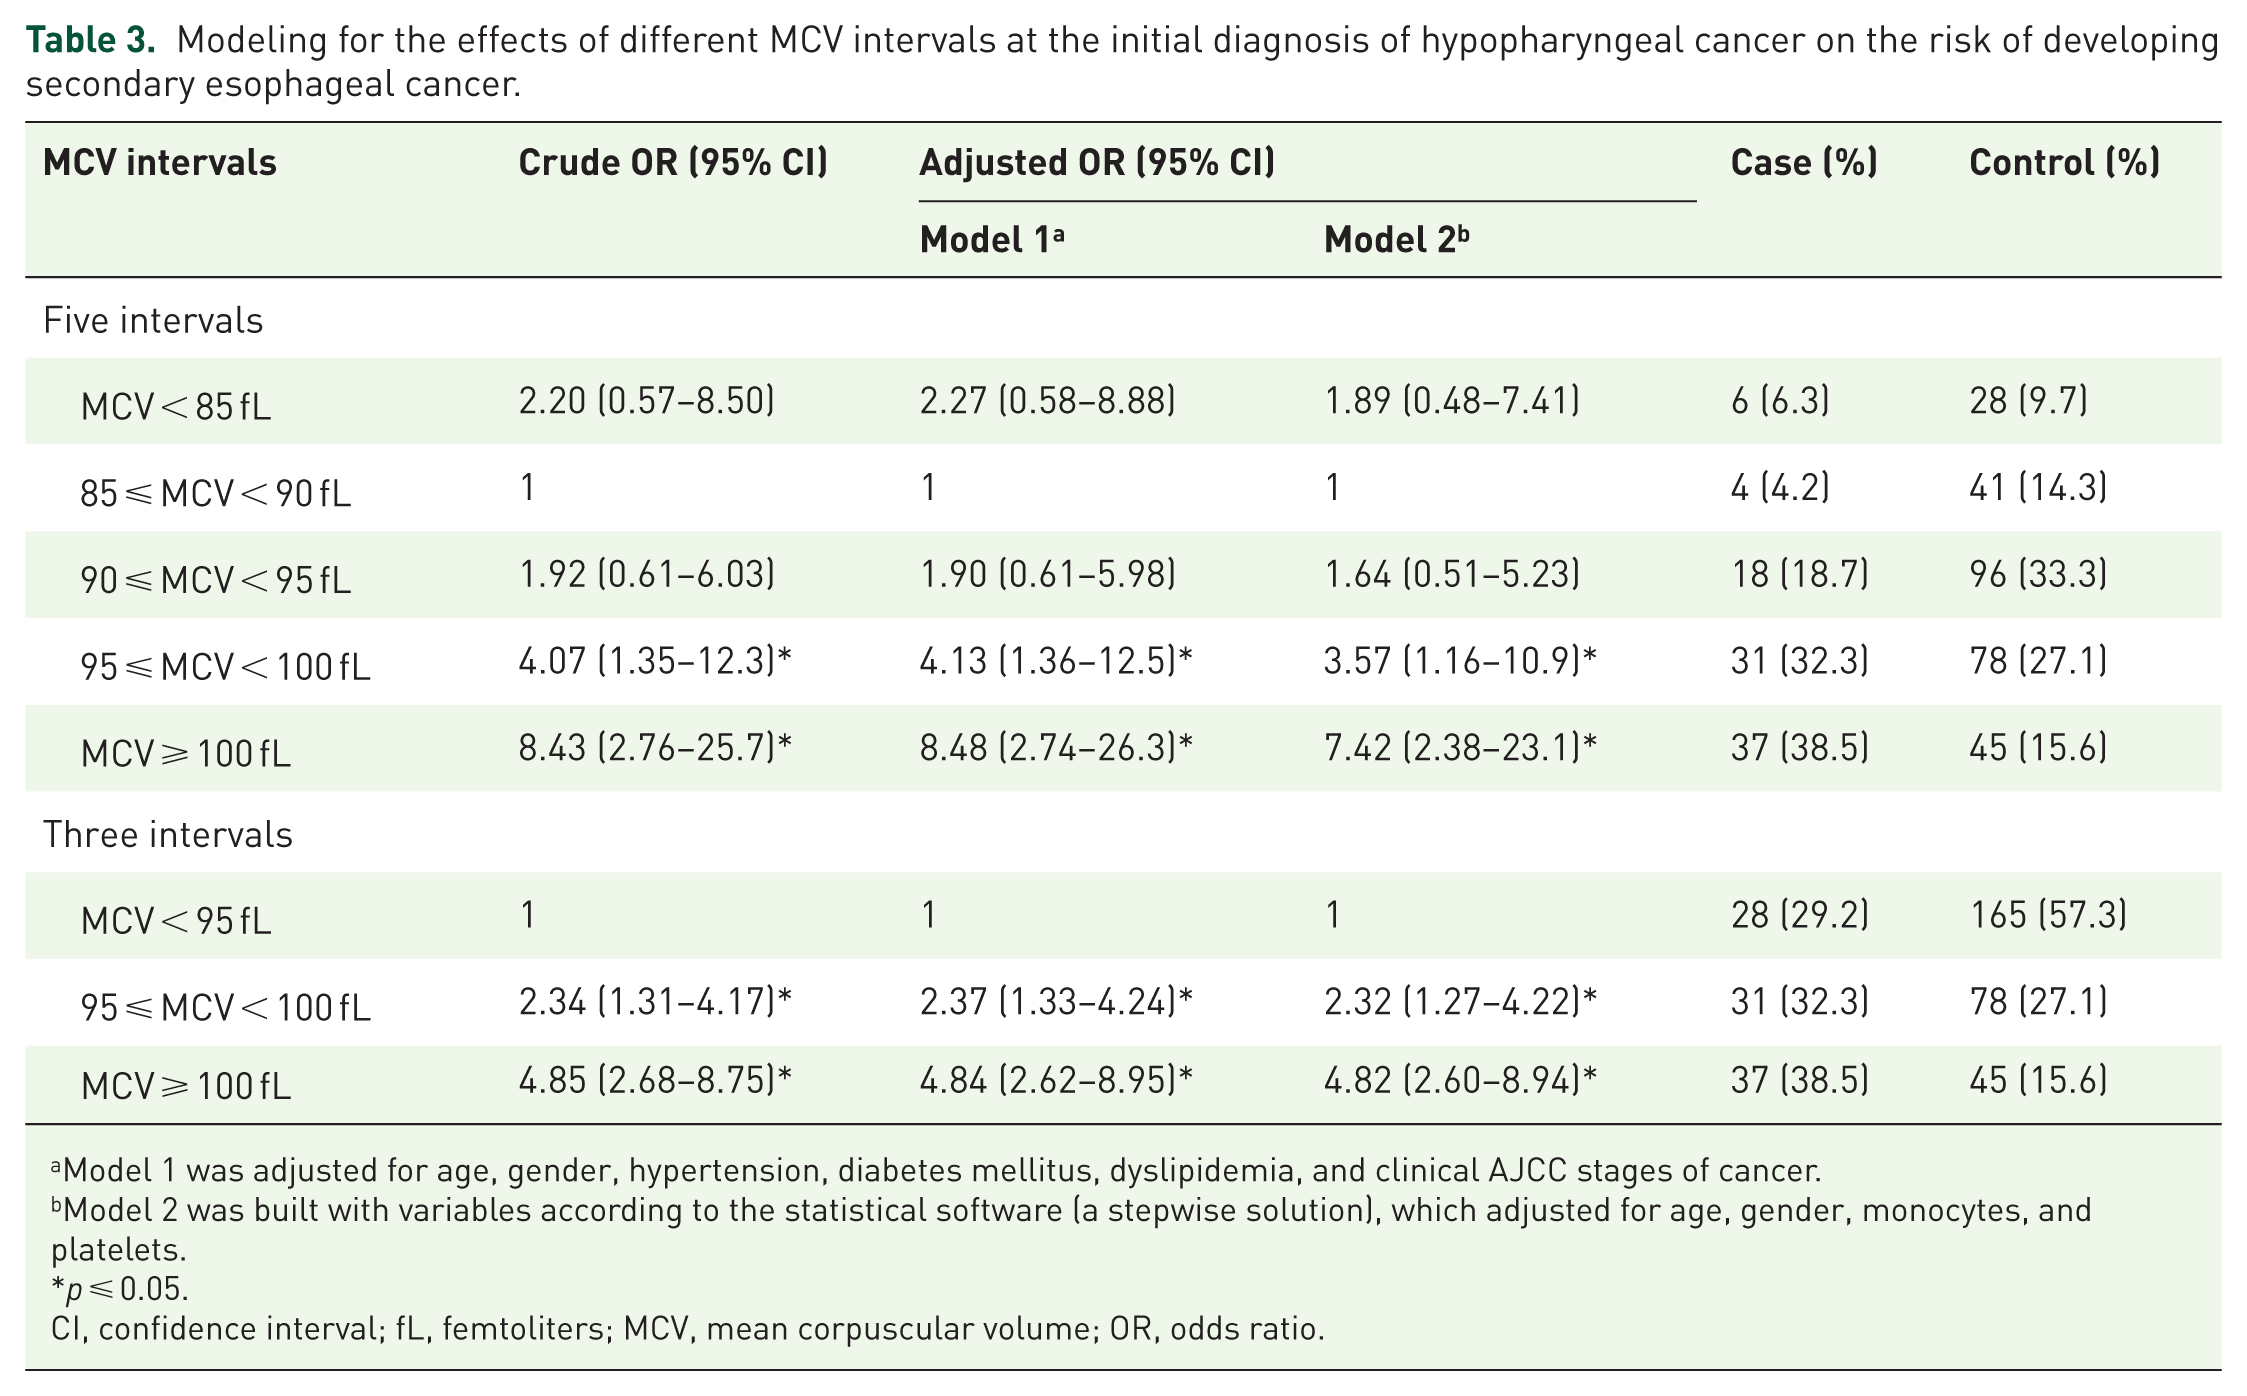
Model 1 was adjusted for age, gender, hypertension, diabetes mellitus, dyslipidemia, and clinical AJCC stages of cancer.
Model 2 was built with variables according to the statistical software (a stepwise solution), which adjusted for age, gender, monocytes, and platelets.
p ⩽ 0.05.
CI, confidence interval; fL, femtoliters; MCV, mean corpuscular volume; OR, odds ratio.
Three interval analysis
Given the small sample sizes and similar effect estimates within the <85, 85–90, and 90–95 fL groups, these were combined into a single reference category (<95 fL; Table 3). We then repeated the logistic regression analyses described above. In both unadjusted and adjusted models, higher MCV values were associated with significantly increased MSPEC risk. Notably, patients with MCV ⩾100 fL had nearly a fivefold higher odds of MSPEC compared with those <95 fL (OR: 4.85; 95% confidence interval (CI): 2.68–8.75). Moreover, the statistically significant increase in OR with rising MCV underscores a clear association between macrocytosis and the risk of developing MSPEC. Within the original cohort of 2009 HPC patients, 31 of 1052 (2.9%) with MCV <95 fL developed MSPEC, versus 46 of 401 (11.5%) with MCV ⩾100 fL. Furthermore, among patients with MCV ⩾100 fL, the cumulative risk of MSPEC continued to rise to 10 years after HPC diagnosis (Figure 1).

Kaplan–Meier survival curve depicting the probability of MSPEC across various MCV levels.
Stratified analysis
In this PSM case–control study, the median age of the study participants was 53 years. Therefore, patients aged <53 years were included in the younger subgroup, while all others were included in the older subgroup. Patients with AJCC stages IVa and IVb were included in the late-stage subgroup, while all others were included in the early-stage subgroup. The stratified analyses suggested that the associations between MCV level and MSPEC were modified by age and AJCC stage in the crude and adjusted models (Table S2). In brief, an MCV ⩾100 fL predicted the development of MSPEC more significantly in the younger and late-stage subgroups. The study population was also subjected to stratification based on their alcohol consumption. The analysis revealed no significant difference in the risk of MSPEC between the two subpopulations within the MCV range of ⩾100 fL (Figure 2).

Stratified analysis for developing metachronous secondary esophageal cancer in patients with hypopharyngeal cancer with MCV ⩾100 fL.
Discussion
To the best of our knowledge, this is the first study to investigate the predictive role of MCV for MSPEC in HPC patients. We found that HPC patients with MSPEC had a significantly longer follow-up period, younger age, and early-stage disease. In addition, HPC patients with MSPEC had a higher MCV than those without MSPEC after matching the clinical features. The risk of developing MSPEC was significantly increased with a higher MCV, with a dose-gradient relationship. Finally, an MCV ⩾100 fL predicted the development of MSPEC more significantly in younger and late-stage subgroups, indicating that an interaction effect existed between macrocytosis, risk of developing MSPEC, and age or clinical stage. Because MCV is a simple and commonly performed test in clinical practice, our findings indicate that a high MCV may be useful for the selection of HPC patients who require intensive esophageal cancer screening.
Although several studies have investigated the risk factors for synchronous esophageal cancer in HNC patients, few studies have evaluated the risk factors of MSPEC in HNC patients.6,19,20 An international multicenter cohort study, including data from 13 cancer registries, demonstrated a high incidence of second primary esophageal cancer after HNC in young patients (aged <56 years), with a standardized incidence ratio (SIR) of up to 14.9 (95% CI = 13.6–16.3); in HPC patients, the incidence of second primary esophageal cancer in young patients was even higher (SIR = 31.22, 95% CI = 20.39–34.75). 21 Iwatsubo et al. 20 found that HNC patients aged <65 years had a high risk of developing MSPEC (OR = 1.75, 95% CI = 1.27–2.41). This is in line with our results, which showed that the age was significantly lower in patients with MSPEC than in those without MSPEC. There are two possible explanations for these findings. First, patients with younger-onset HNC may have genetic alterations, as described in previous studies, which may predispose them to SPCs. 22 Second, younger-onset HNC patients have a longer life expectancy, which increases their risk of developing MSPEC. 23 In addition, the MSPEC group had an early AJCC stage, with higher proportions of stages I–III patients, compared to the controls. Several studies have found that early-stage HNC is a risk factor for MSPEC.24,25 Patients with an early diagnosis of primary cancer may achieve satisfactory local control and prolonged survival, but may develop SPCs during surveillance. 26 Patients with late-stage HNCs may not live long enough to develop a second primary malignancy. The above-mentioned hypothesis is supported by our finding of a longer follow-up period in the MSPEC group compared to the controls (Table 1). Because the follow-up period was a confounder, we controlled for it in subsequent analyses.
Alcohol intake is a risk factor for HNCs and esophageal cancers. 7 Several studies have found that the quantity and content of alcohol consumption were associated with the development of esophageal cancer.27,28 In HNC patients, alcohol consumption is also a risk factor for second primary esophageal cancers.6,29,30 However, previous studies have reported inconsistent results regarding the association between alcohol consumption and SPC. Haremza et al. 24 conducted a study of 541 HNC patients and found no significant association between alcohol consumption and metachronous SPCs. In another study of the association of alcohol intake with the risk of metachronous cancer in HNCs, facial flushing, instead of alcohol intake, was a risk factor for SPCs in the upper gastrointestinal tract. 31 In our study, MSPEC patients had a higher proportion of alcohol use, with no significant difference between the groups. The discrepancy in the results of previous studies may be related to incomplete or inaccurate data regarding the quantity, frequency, and content of alcohol consumption (e.g., the lack of a clear definition for the term “quitting drinking” renders it difficult to determine the appropriate classification of individuals who have quit drinking in terms of their alcohol consumption status, whether as “yes” or “no.”), which may affect the association between alcohol exposure and SPCs. Thus, a relatively accessible biomarker, for example, MCV, may be used to identify alcohol abuse and predict the risk of MSPEC.
Increased MCV is associated with alcohol abuse, excessive acetaldehyde exposure, and aging. 32 Yokoyama et al.33,34 found that patients with a high MCV level (MCV ⩾106 fL) had a higher risk of developing upper aerodigestive tumors and esophageal cancers (OR = 3.68, 95% CI = 1.96–6.93). Several studies have found that a high MCV level predicts poor outcomes and survival in patients with esophageal cancer.10,35,36 The only previous study that evaluated the association of MCV and MSPEC found that a MCV ⩾106 fL predicted the development of MSPEC in patients with early-stage esophageal cancer (relative risk = 2.23, 95% CI = 1.10–4.51). 9 In our research, significant differences in MCV were observed between HPC patients with and without MSPECs, even after matching. Moreover, a dose-gradient relationship was identified between MCV level and MSPEC development, consistent with previous findings. Patients with an MCV ⩾100 fL had the highest risk of developing MSPEC (adjusted OR = 4.84, 95% CI = 2.62–8.95). It remains unclear whether MCV serves as an independent predictor or merely indicates general conditions that elevate the risk of MSPEC in HPC patients. Consequently, a PSM design was employed to balance clinical variables between patients with and without MSPEC. Furthermore, regression analysis was conducted to adjust for any residual imbalance and confounding in the matched cohort. DAGs were utilized to identify potentially confounding variables for adjustment in the regression model (Figure S2). 17 Stratification of the study population based on characteristics, including alcohol consumption, was also performed. Intriguingly, stratified analysis revealed no significant difference in MSPEC risk between subpopulations regarding alcohol consumption within an MCV range of ⩾100 fL, suggesting the potential for misclassification bias in assessing alcohol consumption status, especially since all major confounders were included in the analysis (Figure 2). Despite the influence of alcohol consumption, our findings indicate that macrocytosis can predict the development of MSPEC.
It is unclear whether the association of MCV with MSPEC risk is present in all subgroups. We found an interaction between macrocytosis, MSPEC risk, and age or clinical stage (Figure 2). Younger patients had a higher MSPEC risk with an MCV ⩾100 fL at the time of diagnosis of HPC. This finding may be explained by the presence of genetic alterations in younger-onset HNC patients that predispose them to SPCs. 22 Interestingly, MCV ⩾100 fL was associated with a higher OR of developing MSPEC in the late-stage than the early-stage subgroup. This result may appear contradictory to the findings presented in Table 1. However, these findings have different contexts. The early AJCC stage in the MSPEC group suggests that patients with late-stage disease may not live long enough to develop MSPEC. Therefore, the observation period was matched between the cases (MSPEC) and corresponding controls (non-MSPEC). Interestingly, patients with late-stage HPC and macrocytosis had an increased MSPEC risk after controlling for the observation period. The reason for this finding is unclear and requires further investigation. However, it is possible that patients with late-stage HPC receive more careful care, leading to earlier identification of MSPEC. Furthermore, bias may have affected our results because stratification reduced the number of patients in each group. The interaction effects of age and disease stage on the association between MCV and MSPEC risk should be further examined. Furthermore, the underlying biological mechanism should be investigated in future studies.
The present study faced several limitations. First, the analysis was confined to single MCV measurements taken closest to the HPC diagnosis, which could raise concerns regarding the representation of MCV trends. However, an investigation within an Asian cohort revealed minimal intra-individual biological fluctuation in MCV levels, as indicated by a coefficient of variation of 1.0 (95% CI = 0.8–1.1), suggesting that a single measurement could be sufficiently representative. 37 In addition, we opted to categorize MCV values into intervals rather than applying a singular cutoff value, a methodological choice that allows for the accommodation of minor MCV variations. Second, while the CGMH caters to approximately 25% of Taiwan’s cancer patient population, it is conceivable that individuals with secondary primary cancers may seek care outside the CGMH system. This could potentially lead to an underestimation of the MSPEC ratio. Nonetheless, the impact on our findings is likely minimal due to the non-differential nature of loss to follow-up in our cohort. Lastly, despite adjusting for a comprehensive range of confounders, the possibility of residual confounding remains. To address this, the E-value statistical approach was employed. 38 For an unmeasured confounder to invalidate the observed association between an MCV ⩾100 fL and MSPEC, it would have to be both strongly associated with an MCV ⩾100 fL and MSPEC, with an OR of at least 9.17. Given the extensive adjustments made for known confounders, the likelihood of such a scenario is low, suggesting the robustness of our findings against the influence of potential unmeasured confounding variables.
Conclusion
In this multicenter nested case–control study of HPC survivors, we demonstrate that baseline macrocytosis—particularly among younger patients and those with advanced disease—is independently associated with a substantially increased risk of developing MSPEC. Given the routine availability, low cost, and reproducibility of MCV measurements, our findings support integrating MCV into risk-stratified surveillance protocols to identify high-risk individuals for intensified endoscopic monitoring. The application of MCV as a biomarker not only facilitates earlier detection but also opens avenues for prospective validation and mechanistic research into the role of erythrocyte alterations in esophageal carcinogenesis. Future clinical guidelines should consider MCV-driven algorithms to optimize surveillance strategies and improve long-term outcomes in this patient population.
Supplemental Material
sj-doc-1-tam-10.1177_17588359251370941 – Supplemental material for Macrocytosis as a risk factor for secondary esophageal cancer in hypopharyngeal cancer patients: a multicenter case–control study
Supplemental material, sj-doc-1-tam-10.1177_17588359251370941 for Macrocytosis as a risk factor for secondary esophageal cancer in hypopharyngeal cancer patients: a multicenter case–control study by Ching-Nung Wu, Po-Teng Chiang, Chung-Yi Li, Jo-Chi Chin, Yao-Hsu Yang, Sheng-Dean Luo, Wei-Chih Chen, Chao-Hui Yang, Hung-I Lu and Shau-Hsuan Li in Therapeutic Advances in Medical Oncology
Supplemental Material
sj-docx-2-tam-10.1177_17588359251370941 – Supplemental material for Macrocytosis as a risk factor for secondary esophageal cancer in hypopharyngeal cancer patients: a multicenter case–control study
Supplemental material, sj-docx-2-tam-10.1177_17588359251370941 for Macrocytosis as a risk factor for secondary esophageal cancer in hypopharyngeal cancer patients: a multicenter case–control study by Ching-Nung Wu, Po-Teng Chiang, Chung-Yi Li, Jo-Chi Chin, Yao-Hsu Yang, Sheng-Dean Luo, Wei-Chih Chen, Chao-Hui Yang, Hung-I Lu and Shau-Hsuan Li in Therapeutic Advances in Medical Oncology
Supplemental Material
sj-docx-3-tam-10.1177_17588359251370941 – Supplemental material for Macrocytosis as a risk factor for secondary esophageal cancer in hypopharyngeal cancer patients: a multicenter case–control study
Supplemental material, sj-docx-3-tam-10.1177_17588359251370941 for Macrocytosis as a risk factor for secondary esophageal cancer in hypopharyngeal cancer patients: a multicenter case–control study by Ching-Nung Wu, Po-Teng Chiang, Chung-Yi Li, Jo-Chi Chin, Yao-Hsu Yang, Sheng-Dean Luo, Wei-Chih Chen, Chao-Hui Yang, Hung-I Lu and Shau-Hsuan Li in Therapeutic Advances in Medical Oncology
Supplemental Material
sj-jpg-1-tam-10.1177_17588359251370941 – Supplemental material for Macrocytosis as a risk factor for secondary esophageal cancer in hypopharyngeal cancer patients: a multicenter case–control study
Supplemental material, sj-jpg-1-tam-10.1177_17588359251370941 for Macrocytosis as a risk factor for secondary esophageal cancer in hypopharyngeal cancer patients: a multicenter case–control study by Ching-Nung Wu, Po-Teng Chiang, Chung-Yi Li, Jo-Chi Chin, Yao-Hsu Yang, Sheng-Dean Luo, Wei-Chih Chen, Chao-Hui Yang, Hung-I Lu and Shau-Hsuan Li in Therapeutic Advances in Medical Oncology
Footnotes
Acknowledgements
We appreciate the Biostatistics Center at Kaohsiung Chang Gung Memorial Hospital and the Health Information and Epidemiology Laboratory at the Chiayi Chang Gung Memorial Hospital for helping with the study design and statistics work.
Declarations
Supplemental material
Supplemental material for this article is available online.
References
Supplementary Material
Please find the following supplemental material available below.
For Open Access articles published under a Creative Commons License, all supplemental material carries the same license as the article it is associated with.
For non-Open Access articles published, all supplemental material carries a non-exclusive license, and permission requests for re-use of supplemental material or any part of supplemental material shall be sent directly to the copyright owner as specified in the copyright notice associated with the article.