
Abstract
Background:
The estrogen receptor (ER) is one of the key biomarkers in breast cancer (BC), and therapy decisions are based on ER expression levels. However, the benefit of endocrine therapy in patients with ER expression (ER1%–20%) is debatable. Owing to aggressive tumor biology, like triple-negative BC patients, many ER1%–20% patients are considered to have worse outcomes and may benefit from additional drugs. This treatment dilemma in ER1%–20% patients can be addressed by prognostication for risk of recurrence, which remains underexplored.
Objective:
The study aims to assess whether CanAssist Breast (CAB), an immunohistochemistry-based prognostic test validated globally in ER+/PR+/HER2− early-stage breast cancer (EBC) patients, would help prognosticate ER1%–20% patients and thereby aid in treatment planning.
Design:
We conducted secondary data analyses of previously published retrospective studies to evaluate CAB prognostication in ER1%–20% and ER>20% subgroups across different clinical parameters.
Methods:
Analysis of CAB-based risk stratification was conducted on 2896 ER+/PR+/HER2− EBC patients with a known percentage of ER staining in both ER1%–20% and ER>20% subgroups. Kaplan–Meier survival curves were used to evaluate distant recurrence-free interval (DRFI).
Results:
ER1%–20% patients constituted 6% of the total cohort. Overall, CAB significantly identified 65% of ER1%–20% patients as low risk (LR) with acceptable DRFI of 91% and 35% as high risk (HR) with worse DRFI of 61% (p < 0.0001; hazard ratio (HR/LR), 5.175). ER1%–20% patients are mostly younger, with T2, grade 3, lymph node positive tumors, and have a twofold higher incidence of distant recurrence than ER>20% patients. CAB-based prognostication was significant in these subgroups analyzed with acceptable DRFI in LR patients of ~90% and a drop in DRFI in HR patients to ⩽66% (p = 0.01 to p < 0.0001).
Conclusion:
CAB-based risk stratification of ER1%–20% patients is significant and would add value in treatment decisions for additional targeted treatments to HR patients.
Plain language summary
Estrogen receptor (ER) expression is a critical biomarker in breast cancer, influencing prognosis and guiding therapeutic decisions. Tumors with low-intermediate ER expression (1%-20%) are typically considered to exhibit aggressive biology, recur more often, and thus are often managed with more intensive treatment strategies. However, emerging evidence suggests that a subset of ER1%-20% tumors may not display aggressive tumor biology and could benefit from standard therapy alone (endocrine therapy ± chemotherapy). Thus, it is critical to assess the underlying tumor biology in these patients with ER1%-20% tumors to help plan optimum treatment. Stratifying ER1%-20% patients based on underlying tumor biology remains a clinical challenge. This retrospective study evaluates the utility of CanAssist Breast, a prognostic assay, in distinguishing ER1%-20% patients as ‘low risk’ or ‘high risk’ for cancer recurrence based on underlying tumor biology. Low-risk patients may be de-escalated from additional intensive treatments, thereby optimizing therapeutic decisions in a population with historically limited guidance.
Keywords
Introduction
Estrogen receptor (ER) status plays a vital role in clinical decisions and predicting outcomes for patients with breast cancer (BC). 1 ER+ tumors represent more than 70% of all BC cases and are treated with endocrine therapy (ET), which is beneficial to prevent recurrences. 2 The ASCO/CAP guidelines recommended tumors with ER expression (1%–10%) as a separate subgroup, accounting for only 2%–3% of ER+ cases. 3 However, the optimal cutoff for clinically relevant ER expression is often debated.4,5 A recent large retrospective study by Bari et al. 4 suggests that tumors harboring ER expression (10%–19.9%) reported similar clinicopathological features with ER (1%–9.99%) and patients with <20% ER expression have been reported with worse survival outcomes than patients expressing high ER (ER > 20%). Therefore, in this study, we have considered ER 1%–10% (ER1%–10%) and ER 11%–20% (ER11%–20%) under a single group ER low-intermediate positive referred to as ER 1%–20% (ER1%–20%). The ER1%–20% group was comparatively analyzed with the ER > 20% (ER>20%) group for continuous variables.
While ER>10% patients get significant benefit from ET, the benefit of ET in ER1%–10% patients remains an enigma. 6 ER1%–9% patients showed better overall survival than ER-negative (ERneg) tumors in chemotherapy-naïve cases, indicating some degree of dependency on ER signaling in these patients. 7 By contrast, ER1%–10% tumors have characteristics and prognosis like triple negative breast cancers (TNBC).8,9 ER1%–10% patients are typically given “standard therapy” consisting of “chemotherapy plus ET” and, at times, additional treatments. Thus, the dilemma of “which” patients in the ER1%–10% group to give additional treatments poses a perpetual challenge in managing these patients. Conducting large-scale clinical trials to address this is also a problem, as low ER patients are a distinct subgroup with a low frequency of patients. 4 Therefore, identifying a subset of ER1%–20% patients who will benefit from “additional therapies” to “standard therapy” is critical for the optimal management of these patients.
In ER+/PR+/HER2− early-stage breast cancer (EBC), for estimating the risk of recurrence, several genomics- or proteomics-based prognostic tests have been employed.10,11 However, adequate data on prognostication in ER1%–10% patients are unavailable. 12 CanAssist Breast (CAB) is an immunohistochemistry (IHC)-based prognostic test that integrates five biomarkers (CD44, ABCC4, ABCC11, N-, and pan-cadherin), tumor size, grade, and node status in an AI-based algorithm for predicting the risk of distant recurrence as low risk (LR) or high risk (HR) within 5 years of diagnosis for ER+/PR+/HER2− early-stage BC.13–16 Interestingly, three of the CAB biomarkers (CD44, ABCC4, and ABCC11) are regulated by estrogen levels.17–19 Therefore, we hypothesized that CAB could help in better understanding the disease biology in ER1%–20% patients, classifying them into LR and HR of recurrence, and thus can assist in appropriate personalized treatment planning.
Thus, ER1%–20% tumors are a distinct yet minor subset of ER+/HER2− BCs that often get aggressive therapies primarily due to clinical behavior like TNBC and lack of useful prognostic tests to optimize therapy based on the risk of recurrence. In the present retrospective study, we aimed to demonstrate the usefulness of CAB to unravel the underlying tumor biology in these ER1%–20% tumors to assess whether the tumor is aggressive or not and thus help plan an optimum personalized therapy.
Methods
Data curation and study design
This study is a secondary data analysis of previously published retrospective studies. CAB risk stratification data were obtained from 3052 patients with ER+/PR+/HER2− EBC diagnosed between 1997 and 2016 from India, the USA, and five European countries (Austria, Germany, Spain, Italy, and the Netherlands). Patient selection criteria were as described in the original publications.13–16
Out of 3052 patients, 156 patients were excluded from the current study cohort for being either ERneg or due to inability to verify ER status. Finally, 2896 patients with data available on the percentage of ER staining performed in our laboratory were included, as shown in Figure 1. Three distinct groups have been categorized based on tumor ER expression levels: (1) ER1%–10%, (2) ER11%–20%, and (3) ER>20%. Due to the relatively smaller number of patients in groups 1 and 2 and the statistically significant risk stratification in each of the groups by CAB (see Figure 2(a) and (b)), we have combined group 1 and group 2. The combined low-intermediate ER expression group is referred to as ER1%–20%. This ER1%–20% group is compared with ER>20% for multiple continuous variables such as patient age, tumor grade, tumor size, lymph node status, and Ki67 and analyzed using the Chi-squared test and Kaplan–Meier (KM) survival analysis. Thus, the present study is mainly centered around the comparison between the two groups: ER1%–20% and ER>20%, as mentioned in Figure 1. The reporting of this study conforms to the Strengthening the Reporting of Observational Studies in Epidemiology (STROBE) statement 20 (Supplemental Checklist 1).

Patient inclusion/exclusion criteria in the study cohort. Flow diagram showing inclusion/exclusion criteria for ER1%–20% (1%–20%) and ER>20% (>20%) patients in the study.
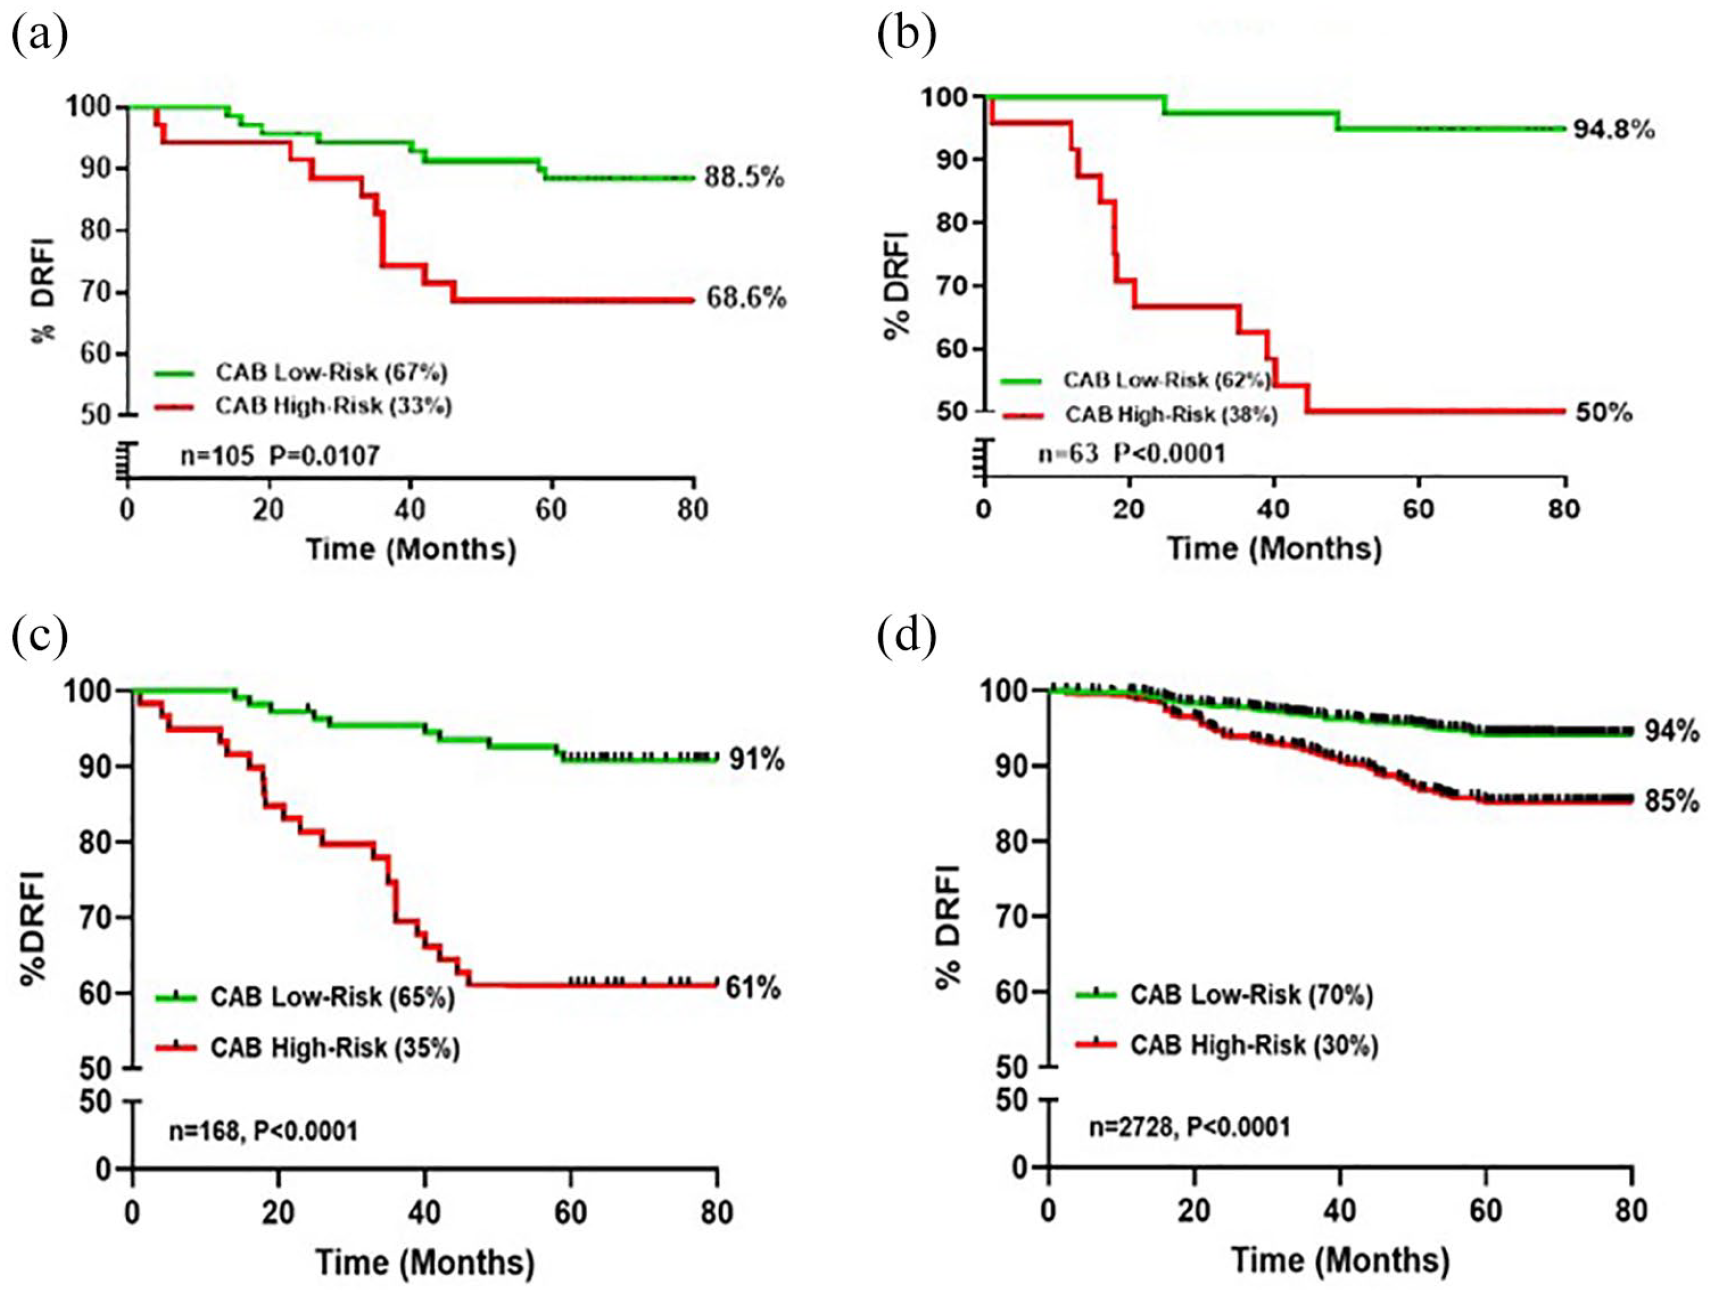
Risk stratification of ER1%–10%, ER11%–20%, ER1%–20%, and ER>20% patients by CAB. CAB stratification and Kaplan–Meier survival estimates for DRFI at 5 years from diagnosis in ER1%–10% (a), ER11%–20% (b), ER1%–20% (c), and ER>20% (d) patients.
Immunohistochemistry
IHC staining for five CAB biomarkers and IHC grading for risk score were done as described earlier. 21 The risk score predicted by the algorithm helps to stratify patients into LR (⩽15.5 risk score) and HR (>15.5 risk score) of recurrence. All ER/PR/HER2 staining and grading were done at OncoStem Diagnostics, Bangalore, Karnataka, India.
Statistical analyses
Distant recurrence-free interval (DRFI) at 5 years from diagnosis was estimated by KM curves (GraphPad Prism 10). p-Value (Log-rank test) was used to assess the association between DRFI of the two risk groups. Hazard ratios for distant recurrence in CAB HR versus CAB LR were also calculated by log-rank test using GraphPad Prism 10. Chi-squared test was used to compare the proportions of ER1%–20% and ER>20% patients.
Results
Patient demographics
As shown in Table 1, ER1%–20% patients constituted 6% of the total cohort, and the rest of the 94% cohort had tumors expressing >20% ER. While patients older than 48 years dominated both the cohorts, younger patients (⩽48 years) were significantly more represented in the ER1%–20% group (39%) compared to the ER>20% (19%; p < 0.0001). ER>20% patients had significantly higher T1 tumors (48%) than ER1%–20% patients (32%; p = 0.0001), whereas ER1%–20% patients had significantly more T2 tumors (64%) than ER>20% patients (47%; p < 0.0001). While G2 tumors prevailed in both cohorts, interestingly, G1 tumors (15%) were significantly more in ER>20% patients, and G3 tumors (46%) were significantly higher in ER1%–20% patients than the respective comparator group (p = 0.0001 and p < 0.0001, respectively). More ER>20% patients were found to be lymph node negative (N0) than ER1%–20% patients (58% vs 47%; p = 0.005) and lymph node positivity (N+) was found significantly higher in the ER1%–20% group compared to the ER>20% (53% vs 42%; p = 0.005). Significant majority (76%) of the ER1%–20% patients had received chemotherapy treatment as against 49% in ER>20% cohort, while significantly more patients (51%; p < 0.0001) from ER>20% cohort were treated with ET alone compared to 24% patients from ER1%–20% cohort. Incidence of distant recurrence was significantly higher in the ER1%–20% group (20%) compared to the ER>20% (10%; p < 0.0001).
Baseline patient demographics.

A Chi-squared test was used to compare the proportions of ER1%–20% and ER>20% patients.
Age information is not available for nine patients.
Tumor size is not known for one patient.
In N+ subgroup, the majority of the ER1%–20% patients had N > 3 nodes than ER>20% patients.
ER, estrogen receptor.
Prognostic value of CAB in risk stratification of patients with ER1%–10%, ER11%–20%, ER1%–20%, and ER>20%
In ER1%–10%, CAB low to HR (LR:HR) proportions were 67:33 with 88.5% DRFI in CAB LR patients and 68.6% in CAB HR patients (p = 0.0107) as indicated in Figure 2(a). In addition, we performed CAB risk stratification in the ER11%–20% category and observed CAB LR:HR proportions to be 62:38 with DRFI of 94.8% in CAB LR patients and 50% in CAB HR patients (p < 0.0001; Figure 2(b)). Considering the relatively smaller number of patients in the ER1%–10% and ER11%–20% groups and statistically significant CAB risk stratification, we combined the two groups into one ER1%–20% and compared it with ER>20% for multiple continuous variables.
CAB stratified LR:HR proportions were 65:35 and 70:30 in patients with ER1%–20% and ER>20%, respectively (Figure 2(c) and (d)). ER>10% expression is typically associated with better prognosis, while ER1%–10% expression is associated with worse survival outcome. 6 In accordance with this, CAB stratified 5% more patients as LR in ER>20% expressing tumors. For the ER1%–20% group, 91% DRFI for CAB LR patients is acceptable and comparable to the DRFI of 94% in patients with ER>20%. Interestingly, the DRFI of CAB HR patients in the ER1%–20% group had significantly lowered to 61% compared to 85% in ER>20% expressing patients.
CAB risk stratification of patients with ER1%–20% and ER>20% based on age groups
ER expression is often associated with age in patients with BC. 22 In our cohort of younger patients (⩽48 years), CAB stratified LR:HR proportions were 60:40 and 69:31 in ER1%–20% and ER>20% groups, respectively. CAB LR patients had a modest DRFI of >89%, whereas in CAB HR patients, a significant drop in DRFI to 65% was seen in the ER1%–20% group compared to 82% in the ER>20% group (Figure 3(a) and (b)).
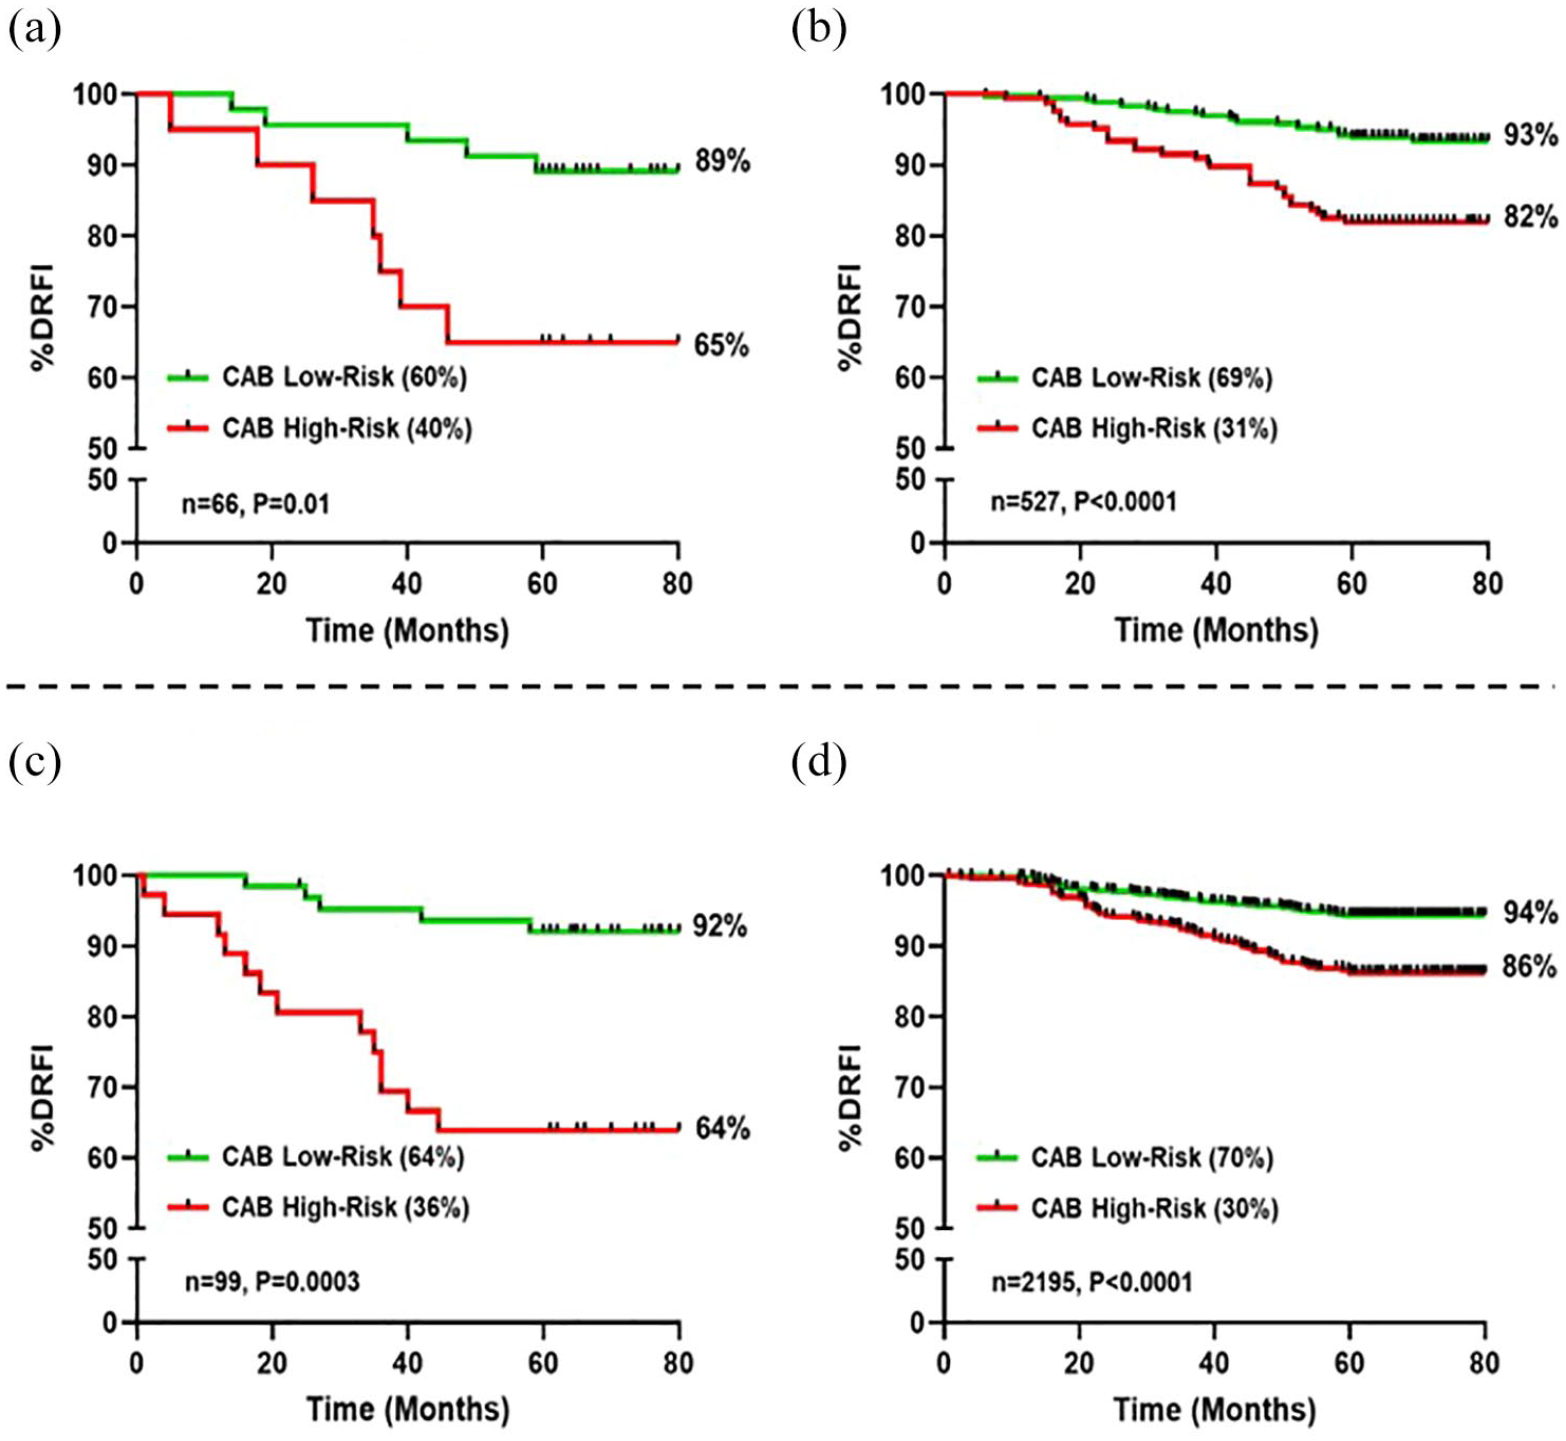
CAB risk stratification of ER1%–20% and ER>20% patients aged below or above 48 years. Kaplan–Meier survival estimates for DRFI at 5 years from diagnosis. CAB risk stratification in patients aged 48 years or below with ER1%–20% (a) and ER>20% (b); patients aged above 48 years with ER1%–20% (c) and ER>20% (d).
In patients aged above 48 years, the LR:HR proportions by CAB were 64:36 and 70:30 in ER1%–20% and ER>20% groups, respectively. Excellent DRFI of >92% was seen in CAB LR patients. However, in CAB HR patients, a significantly lower DRFI of 64% was seen in the ER1%–20% group compared to 86% in the ER>20% (Figure 3(c) and (d)).
CAB risk stratification of patients with ER1%–20% and ER>20% based on node status
ER1%–9% cases are associated with a higher number of node positivity. 23 In patients with N+ disease, CAB stratified LR:HR proportions were 52:48 in both ER1%–20% and ER>20% groups. CAB LR patients had an acceptable DRFI of 91% in both groups. However, the DRFI of CAB HR patients in the ER1%–20% group had significantly dropped to 53% compared to 83% in the ER>20% group (Figure 4(a) and (b)).

CAB risk stratification of ER1%–20% and ER>20% patients with or without lymph node positivity (N+/N0). Survival estimates for DRFI at 5 years from diagnosis by the Kaplan–Meier method. Risk stratification of patients having N+ disease with ER1%–20% (a) and ER>20% (b); patients having N0 disease with ER1%–20% (c) and ER>20% (d) by CAB.
In patients with N0 disease, CAB stratification resulted in comparable LR:HR proportions of 80:20 in ER1%–20% and 83:17 in the ER>20% group, despite the stratification not yet attaining statistical significance in the ER1%–20% presumably due to the small sample size. An acceptable DRFI of >91% was seen in CAB LR patients, whereas in CAB HR patients, a lower DRFI of 81% was seen in the ER1%–20% group compared to 90% in the ER>20% (Figure 4(c) and (d)). As expected, CAB stratified more patients (~2.5 times) as HR in N+ compared to the N0 subgroup. Moreover, a 28% reduction in DRFI was observed in CAB HR patients with ER1%–20% having N+ compared to the N0 subgroup (Figure 4(a) and (c)).
CAB risk stratification of patients with ER1%–20% and ER>20% based on tumor grade
ER1%–10% expression has been significantly associated with higher tumor grade. 24 In patients with low tumor grade (G1–2), CAB stratified LR:HR proportions were 84:16 in ER1%–20% and 82:18 in ER>20% group. CAB LR patients had a satisfactory DRFI of >91%. However, the DRFI of CAB HR patients in the ER1%–20% group had significantly dropped to 47% compared to 87% in the ER>20% group (Figure 5(a) and (b)).

CAB risk stratification of ER1%–20% and ER>20% patients based on tumor grades. Survival curves for DRFI plotted by the Kaplan–Meier method at 5 years from diagnosis. CAB risk stratification of patients having tumor grade 1–2 with ER1%–20% (a) and ER>20% (b); patients having tumor grade 3 with ER1%–20% (c) and ER>20% (d).
In patients with high tumor grade (G3), CAB stratification resulted in LR:HR proportions of 43:57 in ER1%–20% and 40:60 in the ER>20% group. In CAB LR patients, DRFI of >91% was observed. However, in the ER1%–20% group, CAB HR patients had a lower DRFI of 66% compared to 84% in ER>20% (Figure 5(c) and (d)). Certainly, CAB stratified more patients (~3 times) as HR in G3 than G1–2 subgroups.
CAB risk stratification of patients with ER1%–20% and ER>20% based on tumor size
ER1%–10% patients exhibit a lower prevalence of T1 tumors and a higher prevalence of T2 tumors.6,23 In the T1 subgroup, CAB stratification resulted in analogous LR:HR proportions of 76:24 in ER1%–20% and 81:19 in ER>20% patients. Excellent DRFI of >94% was perceived for CAB LR patients. Conversely, the DRFI of CAB HR patients in the ER1%–20% group had significantly reduced to 69% compared to 89% in the ER>20% group (Figure 6(a) and (b)).

CAB risk stratification of ER1%–20% and ER>20% patients based on tumor size. Kaplan–Meier survival estimates for DRFI at 5 years from diagnosis and CAB risk stratification in patients having T1 tumors with ER1%–20% (a) and ER>20% (b); patients having T2 tumors with ER1%–20% (c) and ER>20% (d).
In the T2 subgroup, CAB stratified similar LR:HR proportions of 63:37 and 65:35 in ER1%–20% and ER>20% groups, respectively. DRFI of >91% was observed in CAB LR patients. However, the DRFI in CAB HR patients had significantly dropped to 57% in the ER1%–20% group compared to 83% in ER>20% (Figure 6(c) and (d)). CAB stratified more patients (~1.5 times) as HR in T2 compared to T1 subgroups. Furthermore, a decrease in DRFI of 12% was observed in CAB HR patients in T2 compared to the T1 subgroup with ER1%–20% (Figure 6(a) and (c)).
CAB risk stratification of patients with ER1%–20% and ER>20% based on Ki67
In patients with low Ki67 (⩽10%), CAB stratified LR:HR proportions were 86:14 in ER1%–20% and 79:21 in ER>20% patients. DRFI of >91% was observed for CAB LR patients. However, the DRFI of CAB HR patients in the ER1%–20% group had significantly dropped down to 45% compared to 90% in the ER>20% group (Figure 7(a) and (b)).

CAB stratification of ER1%–20% and ER>20% patients based on Ki67 status. Kaplan–Meier survival curves comparing DRFI at 5 years from diagnosis following CAB risk stratification of patients expressing Ki67 ⩽ 10% with ER1%–20% (a) and ER>20% (b); patients expressing Ki67 > 10% with ER1%–20% (c) and ER>20% (d).
In patients with high Ki67 (>10%), CAB stratified LR:HR proportions were 50:50 and 73:27 in ER1%–20% and ER>20% groups, respectively. CAB stratified 23% more patients as HR in ER1%–20% compared to the ER>20% group. An acceptable DRFI of 92% was observed in CAB LR patients. However, the DRFI in CAB HR patients had significantly decreased to 63% in the ER1%–20% group compared to 80% in ER>20% (Figure 7(c) and (d)). Furthermore, CAB stratified more ER1%–20% patients (~3.5 times) as HR in high-Ki67 compared to low-Ki67 subgroups (Figure 7(a) and (c)).
Discussion
Low expression of ER in BC patients is considered a worse prognostic factor; hence, ASCO/CAP has designated them as a separate subgroup with aggressive tumors.3–5 ER1%–10% tumors are known to be associated with a higher number of lymph node positivity, higher histological grade, larger tumor size, and prevalence in younger patients as compared to ER>10% tumors.1,6,23 Our current results are in agreement with these studies wherein ER1%–20% disease is primarily associated with T2 tumors, G3, and N+ disease. In agreement with published data that ER1%–20% is more prevalent in younger patients, we observed that in our study, the Indian cohort, which has 14% more younger patients (age ⩽48 years) than the Caucasian cohort, indeed has a significantly higher number of ER1%–20% patients. The distant recurrence rate was two times higher in ER1%–20% patients than in ER>20% patients.
While ETs have revolutionized the treatment of BC by improving survival outcomes, this is well studied in high ER patients. For ER1%–9% patients, while the benefit of ET is controversial, in chemotherapy-naïve patients, the overall survival was significantly better in ER1%–9% than ERneg patients. 7 Moreover, the omission of ET in chemotherapy-treated ER1%–10% patients had worse survival outcomes. 25 This indicates that low ER tumors still retain some degree of active ER signaling pathway and get modest benefit from ET. 26 Despite this, low ER patients do far worse than high ER patients (age, stage-matched) in a similar manner to TNBC patients.
Now the question is whether all low ER patients have poor survival outcomes, and, hence, are they all getting overtreatment by assuming they are as aggressive as TNBC patients. In the current retrospective study, ER1%–20% patients account for 6% of the total cohort. Based on the high incidence of BC worldwide, 6% of patients also account for a significant number of patients who warrant better treatment options. Prognosticating ER1%–20% patients to offer additional therapy is not yet well understood, perhaps due to low numbers and poorly understood aggressive biology, and needs further research.
There is limited evidence of prognostication of ER1%–10% patients, which did not add much information regarding shift in treatment decisions, perhaps because of the need to look at tumor biology beyond hormone receptor, HER2, and proliferation pathways. 12 CAB is a prognostic test that is non-hormonal and non-proliferation-based, and its biomarkers are associated with cancer metastasis (CD44, ABCC4, ABCC11, and cadherins) with three clinicopathological parameters (tumor size, grade, and lymph node status) to arrive at the risk of recurrence.
Our goal was to assess whether prognostication by CAB can help in treatment planning for ER1%–20% patients. We believe CAB can achieve this because three CAB biomarkers (CD44, ABCC4, and ABCC11) are responsive to regulation by ER signaling.17–19,27 Moreover, the clinicopathological parameters of ER1%–20% tumors are also linked with CAB biomarkers. For example, high expression of CD44 is associated with higher histological grade, and high expression of ABCC11 is associated with aggressive BC subtypes; both characteristics are hallmarks of low ER patients.17,18 Therefore, by better understanding the underlying disease biology of ER1%–20% patients, CAB can segregate these patients and assist in appropriate personalized treatment planning.
Indeed, our results have shown the ability of CAB to significantly stratify ER1%–20% patients into LR and HR for recurrence. ER1%–20% CAB LR patients had an acceptable DRFI above 90%. However, ER1%–20% CAB HR patients experienced an additional 30% reduction in DRFI compared to LR and 24% more compared to HR of ER>20% patients. However, ER status is not an independent factor but is linked with its clinicopathological parameters for predicting survival outcomes. In ER1%–9% tumors, a high rate of germline BRCA mutation is observed, like in TNBC patients. 28 BRCA1-associated tumors are most often of higher tumor grade and highly proliferative, leading to larger tumor size. 29 Studies have shown that ERα mRNA is downregulated in BRCA1 mutant tumors. 30 High rate of BRCA1 mutation in younger patients leads to low levels of ERα protein, leading to low ER expression. 28 As CAB integrates tumor size, grade, and lymph node status in its risk score prediction algorithm; hence, it is interesting to see how CAB is useful to segregate subsets of ER1%–20% patients as LR versus HR of recurrence, thus aiding in treatment planning. Indeed, our results showed that CAB can find LR patients even in ER1%–20% subgroups with younger age, G3, T2 tumors, N+, and high Ki67 (>10%). 31 CAB identified that ER1%–20% LR patients from different subgroups had an acceptable DRFI of ~90%. These LR patients are clearly doing well with standard therapy of chemotherapy plus ET. However, ER1%–20% CAB HR patients, despite standard therapy, have had worse survival outcomes even when compared to CAB HR patients in the ER>20% group. These ER1%–20% CAB HR patients could benefit from additional therapies besides standard therapy. The addition of CDK4/6 inhibitors in ER1%–20% CAB HR patients seems to be a promising option for them. Considering that ER1%–10% cases were already enrolled in the monarchE trial, we believe that the “select” ER1%–20% CAB HR patients will certainly benefit from adding CDK4/6 inhibitors, thereby managing the benefits and toxicities of CDK4/6 inhibitors. 32
One of the key limitations of the study is the small sample size in the ER1%–10%, ER11%–20% and ER1%–20% groups. This is because tumors with ER (1%–10%) expression represent only 2%–3% of ER-positive tumors. 3 Another limitation is not reaching statistical significance while comparing the two groups for N0 disease due to, once again, its small sample size. To address this, we hope to conduct future studies that involve a larger patient population to strengthen the usefulness of CAB prognostication in these less prevalent cohorts.
Conclusion
ER1%–20% patients, who are thought to have aggressive tumors with poor prognosis and behave similarly to TNBC patients, still have a subset of patients who can be managed well with standard therapy consisting of chemotherapy plus ET. By stratifying patients as LR and HR, CAB identifies the HR subset of ER1%–20% patients in different clinical sub-groups with highly aggressive tumors who would benefit from additional therapies beyond standard therapy, thus addressing the dilemma of the therapeutic management of the ER1%–20% patients.
Supplemental Material
sj-docx-1-tam-10.1177_17588359251342218 – Supplemental material for CanAssist Breast-based prognostication in low-intermediate estrogen receptor positive (ER1%–20%) early-stage breast cancer patients helps guide treatment decisions
Supplemental material, sj-docx-1-tam-10.1177_17588359251342218 for CanAssist Breast-based prognostication in low-intermediate estrogen receptor positive (ER1%–20%) early-stage breast cancer patients helps guide treatment decisions by Susmita Ghosh, Tejal Deepak Durgekar, Manvi Sunder, Badada Ananthamurthy Savitha, Payal Shrivastava, Naveen Krishnamoorthy, Deepti K. Shivashimpi and Manjiri M. Bakre in Therapeutic Advances in Medical Oncology
Footnotes
References
Supplementary Material
Please find the following supplemental material available below.
For Open Access articles published under a Creative Commons License, all supplemental material carries the same license as the article it is associated with.
For non-Open Access articles published, all supplemental material carries a non-exclusive license, and permission requests for re-use of supplemental material or any part of supplemental material shall be sent directly to the copyright owner as specified in the copyright notice associated with the article.