
Abstract
Background:
Given that only a small subset of patients with advanced non-small-cell lung cancer (aNSCLC) benefit from immune checkpoint inhibitors (ICIs), the effectiveness of ICIs is often compromised by the complex interplay within the tumor microenvironment (TME).
Objectives:
To identify predictive biomarkers associated with ICI resistance at a multi-omics spatial level.
Design:
A total of eight aNSCLC patients who received first-line anti-programmed cell death protein-1 (PD-1) monoclonal antibody camrelizumab at Shandong Cancer Hospital and Institute between 2021 and 2022 were included in the discovery cohort. An additional validation cohort of 45 samples from camrelizumab-treated aNSCLC patients was also enrolled.
Methods:
NanoString GeoMx® digital spatial profiling was conducted at the transcriptomic and proteomic level within pan-cytokeratin (panCK+), CD45+, and CD68+ compartments. For validation, multiplex immunofluorescence (mIF) staining was performed.
Results:
Distinct spatial expression patterns and levels of immune infiltration were observed between tumor and leukocyte compartments. Higher CD34 expression in the macrophage compartment correlated with poorer prognosis and response to camrelizumab (p < 0.05). mIF validation confirmed the association of elevated CD34 expression level with reduced progression-free survival (PFS; hazard ratio (HR) = 5.011, 95% confidence interval: 1.057–23.752, p = 0.042), outperforming traditional tumor markers in predictive accuracy.
Conclusion:
Our findings identify CD34 as a novel spatial biomarker for anti-PD-1 therapy efficacy, potentially guiding the selection of aNSCLC patients who are more likely to benefit from ICI treatment.
Trial registration:
ChiCTR2000040416.
Keywords
Introduction
Immunotherapy has emerged as a cornerstone of cancer treatment, significantly improving patient outcomes through enhanced progression-free survival (PFS) and overall survival (OS). 1 Immune checkpoint inhibitors (ICIs), notably anti-PD-1 and anti-PD-L1 antibodies, have become standard care for advanced non-small-cell lung cancer (aNSCLC). 2 Camrelizumab, a humanized monoclonal antibody against PD-1, has demonstrated significant antitumor activity and acceptable safety profiles in NSCLC and a range of other cancers.3–7 Despite the potential of camrelizumab, evidenced by an open-label, randomized, multi-cancer, phase III clinical trial that showed enhanced PFS when combined with chemotherapy, 8 not all aNSCLC patients respond. Identifying factors influencing treatment response remains crucial for optimizing patient care. 9
The current FDA-approved clinical biomarkers for anti-PD-1 therapy, tumor mutation burden (TMB) 10 and immunohistochemistry (IHC) for PD-L1 expression, 11 have significant limitations in sensitivity, specificity, and predictability. These markers fail to fully capture the complex tumor microenvironment (TME), where diverse cell populations, such as cancer cells, immune cells, and stromal cells, interact to influence immunotherapy response.12,13 It is evident that both patients with high TMB or positive PD-L1 expression and those with low TMB or negative PD-L1 expression may either respond or resist ICIs. Consequently, reliance on these markers alone falls short in effectively predicting aNSCLC patient outcomes, underscoring the need for a more comprehensive understanding of the TME to enhance the prognostic accuracy.
The TME is a dynamic ecosystem where cell composition, density, and spatial arrangement impact response to ICIs.14–16 Yet, the interplay between tumor cells and the surrounding cellular environment within the TME, which may significantly influence the effectiveness of ICIs, is still not well understood. Traditional sequencing approaches have been limited to providing aggregate information, often masking the crucial cellular heterogeneity that characterizes the TME. 17 Intratumor heterogeneity (ITH), the variation of tumor cells within a single tumor, further complicates treatment optimization. To improve immunotherapy outcomes, a more detailed understanding of the TME, including spatial biomarkers, is essential.
CD34 is a glycoprotein traditionally recognized as a marker of hematopoietic stem cells, 18 which is involved in various cellular processes such as cell adhesion, recognition, activation, and signal transduction. Furthermore, it collaborates with E-selectin and P-selectin to initiate inflammatory responses, augmented by chemokine activity.19–21 It has been implicated in tumor progression and poor prognosis in several cancer types.22–24 Despite its established role in these cancers, the potential of CD34 as a predictive biomarker for immunotherapy remains underexplored. Given its involvement in immunological processes, 25 CD34 may influence the immunological landscape of the TME, potentially impacting the efficacy of ICIs.
This study utilizes the GeoMx digital spatial profiling (DSP) platform to quantitatively analyze the distribution of RNAs and proteins within specific regions of the TME, including tumor, leukocyte, and macrophage areas. By mapping the expression of these molecules, we aim to discover novel spatial biomarkers linked to treatment response and investigate how ITH influences immunotherapy sensitivity.
Through this spatial profiling, we identified a novel marker, CD34, that exhibited significant correlations with therapeutic outcomes. Notably, CD34 was found to be overexpressed in the macrophage and leukocyte compartments of non-responders compared to responders, while no significant difference was observed in the tumor compartment. This differential expression was further validated using multiplex immunofluorescence (mIF) in a larger, independent validation cohort of 45 patients, reinforcing the potential of CD34 as a prognostic marker for resistance to camrelizumab. The mIF analysis confirmed that higher levels of CD34 within the macrophage regions were associated with poorer PFS.
By integrating these spatial multi-omics data, our study provides new insights into the role of CD34 in modulating the response to immunotherapy. This research aims to contribute to the development of more accurate predictive tools for immunotherapy, ultimately improving the clinical management of patients with advanced NSCLC.
Materials and methods
Patient characteristics and cohort description
Our study employed a discovery cohort comprising eight patients with aNSCLC who underwent anti-PD-1 therapy at Shandong Cancer Hospital and Institute within the years 2021–2022. These patients’ pre-treatment lung tumor punch biopsy tissues were preserved as formalin-fixed paraffin-embedded (FFPE) samples within the pathology department archives of the same institution. All participants were enrolled in a broader, multicenter, prospective, real-world study that involved 19 hospitals across China (Trial registration number: ChiCTR2000040416). Inclusion in our discovery cohort necessitated patients to be 18 years of age or older, with histologically or cytologically confirmed stage IIIB or IV non-squamous NSCLC. Moreover, they had to test negative for epidermal growth factor receptor mutations and anaplastic lymphoma receptor kinase gene rearrangements, and not have received prior chemotherapy treatments. Exclusion criteria included a history of other malignancies, prior immunotherapy treatments, or concurrent enrollment in other clinical trials. The treatment regimen for these patients included camrelizumab in combination with pemetrexed/cisplatin or pemetrexed/carboplatin, administered every 3 weeks as a first-line treatment, continuing until disease progression or the onset of intolerable toxicity was observed. The flow diagram is presented in Supplemental Figure 1.
For validation purposes, an additional cohort of 45 patients with advanced or metastatic non-squamous NSCLC from our hospital, who received first-line camrelizumab therapy between 2020 and 2023, was also included. These patients were subject to a diagnostic percutaneous tumor needle biopsy preceding the administration of camrelizumab treatment. The clinicopathological characteristics of the discovery and validation cohorts have been thoroughly documented in Table 1 and Supplemental Table 1, respectively. This study adheres to the Equator network guideline for Diagnostic and Prognostic Studies 26 (Supplemental Table 4).
Baseline characteristics of discovery cohorts.

KPS, Karnofsky Performance Status.
Immunotherapy efficacy assessment
The effectiveness of the administered immunotherapy was evaluated using the standardized Response Evaluation Criteria in Solid Tumors (RECIST) version 1.1. Patient outcomes were stratified based on the observed immune response: those achieving complete response or partial response were categorized as the response (R) group. Conversely, patients exhibiting stable disease or progressive disease (PD) were designated as the non-response (NR) group.27–31 OS was delineated as the interval from the commencement of immunotherapy until the patient’s death or the last follow-up date. PFS was determined as the duration from the initiation of immunotherapy to the occurrence of disease progression, any cause of death, or the last recorded follow-up, serving as key metrics in our assessment of therapeutic impact.
Digital spatial profiling
NanoString GeoMx DSP system was performed on FFPE sections as described previously. 32 The slides underwent a standard preparation process involving deparaffinization, rehydration, and antigen retrieval. For proteomics profiling, sections were incubated with two sets of antibodies. Fluorescence-labeled primary antibody panel, targeting key morphological markers, including antibodies for pan-cytokeratin (PanCK), CD45, and CD68. The unique UV-photocleavable oligo primary antibody mix included 43 additional antibodies that spanned several modules (as detailed in Supplemental Table 2). For transcriptomics profiling, slides were hybridized with a probe mixture at 37°C overnight. The barcoded oligo probes consisted of 18,000 targets from the whole transcriptomic atlas (WTA) panel. Then, the above-mentioned fluorophore-tagged antibodies were incubated with the sections. Next, once the prepared slides were loaded onto the GeoMx instrument for digital fluorescence imaging, images were assessed by two experienced pathologists to select regions of interest (ROIs) suitable for DSP analysis. Colocalization techniques for compartment-specific detection were employed, delineating three distinct molecularly defined tissue compartment areas of interest (AOIs) for further investigation: the tumor compartment (PanCK+), the leukocyte compartment (CD45+), and the macrophage compartment (CD68+). Each selected AOI was illuminated with UV light to cleave the oligonucleotide barcodes from the antibodies and probes. These freed oligos were then collected in 96-well plates using microcapillary aspiration. Subsequently, collected samples were hybridized overnight with Hyb Code Pack Master Mix and quantified through the NanoString nCounter Analyzer for proteomic analysis. For the transcriptomics analysis, the dried oligos, along with the 5× PCR Master mix and primers, were allocated into a fresh plate to begin library construction for sequencing. Finally, rigorous quality control (QC) and normalization procedures were executed using the GeoMx DSP Analysis Platform.
mIF staining
Five-micrometer FFPE tissue sections from the validation cohort were deparaffinized with xylene and rehydrated through a graded ethanol series. The slides were then treated with a citric acid-based solution in a microwave to unmask antigens, followed by a blocking step using normal goat serum. Following blocking, slides were sequentially incubated with primary antibodies followed by horseradish peroxidase-conjugated goat anti-rabbit/mouse secondary antibody. The mIF signal was boosted using a tyramide signal amplification kit as per the manufacturer’s instructions. All washing steps were done using Tris Buffered Saline with Tween-20 (TBST) solution. Subsequently, any loosely bound antibodies were eluted using microwaving. This cycle of staining and washing was repeated to ensure complete antigen labeling. The final step was staining the nuclei with 4’,6-diamidino-2-phenylindole (DAPI). Once the staining was finished and excess liquid was blotted off, the slides were sealed with an anti-fluorescence quenching sealing tablet and then examined under a fluorescence microscope.
A four-color panel compatible with the DSP approach (PanCK/CD68/CD34/DAPI) was selected to characterize the immune microenvironment in aNSCLC and confirm findings from the discovery cohort. This preliminary work informed the final sequence for applying the multiplex antibodies. A complete list of the antibodies and fluorophores used in the mIF process is available in Supplemental Table 3. The stained tissue was then imaged using the PANNORAMIC SCAN II Imaging System (3Dhistech) at 200× digital magnification. These images were processed and analyzed with the QuPath software, version 0.4.3. 33 Cells were automatically identified and categorized based on their DAPI-stained nuclei to separate tumor and macrophage regions. The mean fluorescence intensity (MFI) for each fluorescent marker was recorded, providing a measure of protein expression. For CD34, the MFI was determined within the CD68-positive regions by calculating the ratio of CD34 fluorescence to the area marked by CD68.
Statistical analysis
All data were processed and analyzed using the GeoMx DSP Control Center V.1.0, the R software package V.4.2.1, and GraphPad Prism V.9.5. Differences in the characteristics between the discovery and validation cohorts were compared using Chi-square or Fisher’s exact tests. The Pearson correlation test was employed for the analysis of correlations. For comparisons across multiple groups, the Kruskal–Wallis test was utilized, and the Wilcoxon test was used for pairwise comparisons. Dimensionality reduction was achieved using UMAP V.4.2.1. Heatmaps and clustering were produced with pheatmap V.1.0.12. Differential expression of genes was analyzed using DESeq2 V.1.3.7, with the results depicted on volcano plots. Optimal cutoff values were determined using X-tile software V.3.6.1. Kaplan–Meier plots and log-rank tests for survival analysis were generated using the survival and survminer package. Independent prognostic factors were identified through Cox proportional hazard regression models, and the results were presented in forest plots. The predictive ability and clinical utility of the model were assessed with decision curve analysis (DCA) and clinical impact curve (CIC). The receiver operating characteristic curve was also used to analyze the sensitivity and specificity of the model. For the creation of plots, ggplot2 V.3.4.0 was utilized. All tests conducted were two-sided, and a p-value < 0.05 was considered statistically significant.
Results
Patient characteristics
Initially, the discovery cohort enrolled 44 patients diagnosed with stage IIIB–IV non-squamous NSCLC who received first-line treatment combining camrelizumab with pemetrexed and platinum-based chemotherapy. Pre-treatment biopsy specimens from these patients were processed into FFPE slides (Figure 1(a)). After careful evaluation of FFPE block quality, eight patients were selected for further analysis. All eight patients underwent transcriptomic analysis, while proteomic analysis was performed on six patients due to two failing to meet DSP QC standards. Detailed exclusion criteria are presented in Supplemental Figure 1. Patient characteristics for the RNA and protein analysis cohorts are summarized in Table 1. Within the RNA analysis cohort, 37.5% were categorized as responders and 62.5% as non-responders. Liver metastases were observed in three patients (37.5%), and brain metastases were identified in four patients (50%). The protein analysis group was evenly divided between responders and non-responders. Liver metastases were present in one patient (16.7%), while brain metastases were noted in four patients (66.7%). No significant differences were found in variables such as age, gender, Karnofsky Performance Score (KPS), TNM stage, primary tumor location, presence of liver or brain metastases, smoking or drinking habits, receipt of adjuvant radiotherapy, or levels of PD-L1 expression between the responder and non-responder groups (Table 1 and Supplemental Table 1).

Schematic overview of the study. (a) Flow diagram of the DSP and mIF validation. (b) Representative AOIs of tumor cells (PanCK+), leukocytes (CD45+), and macrophages (CD68+) from ROI segmentation. (c) Correlation analysis of proteomics and transcriptomics in all AOIs, PanCK+ AOIs, CD45+ AOIs, and CD68+ AOIs.
The validation cohort was composed of 45 patients with advanced stage IIIB–IV NSCLC, all of whom received first-line camrelizumab therapy (Supplemental Table 1). Responder and non-responder rates were 33.3% and 66.7%, respectively, based on RECIST v1.1 criteria. At the time of follow-up, survival was noted in 66.7% of the response group and 36.7% of the non-response group. Patient characteristics were similar between responders and non-responders, such as age, gender, KPS score, TNM stage, primary tumor site, liver and brain metastases, smoking and drinking status, adjuvant radiotherapy, and PD-L1 expression levels.
Multi-omics spatial analysis
The study design is outlined in Figure 1(a). The variation within ROIs presents a challenge in distinguishing specific cellular population signals, which is a barrier to exploring the intricacies of TME heterogeneity. To overcome this, we subdivided the ROIs into distinct spatial areas, and by integrating morphological marker staining with digital optical barcode technology, we achieved precise identification and in-depth analysis of particular cell subsets, as shown in Figure 1(b). This approach allowed for the main ROIs to be further separated into tumor, leukocyte, and macrophage AOIs, with a total of 102 AOIs undergoing both DSP protein and RNA analysis. Specifically, 33 AOIs were in the tumor zone, 32 in the leukocyte zone, and 37 in the macrophage zone (Supplemental Figure 2).
For mRNA measurements, we used a WTA panel capable of analyzing 18,000 transcripts. Protein expression was assessed using four panels that included 43 protein targets and 6 reference controls, covering immune cell profiling, immuno-oncology (IO) drug target, immune activation status, and immune cell typing modules (Supplemental Figure 2 and Supplemental Table 2). QC and normalization steps were then implemented to guarantee data integrity and consistency. Expression levels of RNA and protein across different AOIs for all targets are presented in Supplemental Figure 3(A) and (B). All AOIs passed the QC benchmarks. Digital counts for RNA and protein targets were normalized using the geometric mean of housekeeping genes (Supplemental Figure 3(C) and (D)).
Subsequent correlation analyses showed a significant positive relationship between RNA and protein expression data across all AOIs (r = 0.425, p = 0.0045), in tumor AOIs (r = 0.437, p = 0.0034), leukocyte AOIs (r = 0.38, p = 0.012), and macrophage AOIs (r = 0.463, p = 0.0018). This indicates a reliable consistency between RNA and protein analytical methods (Figure 1(c)).
Regional expression pattern reveals inter- and intra-tumoral heterogeneity
NSCLC presents with remarkable heterogeneity at both morphological and molecular levels.34,35 To explore this intratumor diversity, we conducted a spatially resolved analysis of protein and RNA expressions. Our results indicate that the tumor and adjacent immune regions exhibit distinct region-specific expression profiles, transcending individual patient characteristics and treatment responses (Supplemental Figure 4(A) and (B)). This distinct distribution pattern was further elucidated through UMAP dimensionality reduction analysis, which starkly differentiated the expression signatures of tumor cores from their leukocyte and macrophage counterparts (Figure 2(a) and Supplemental Figure 4(C)).

Regional expression pattern reveals ITH. (a) UMAP dimensionality reduction analysis of proteomics. (b) Volcano plot of differentially expressed proteins between tumor and leukocyte regions. (c) Volcano plot of differentially expressed proteins between tumor and macrophage regions. (d) Correlation analysis of all protein markers. (e) Immune infiltration abundance across various spatial regions at the RNA level. (f) Box plot of typical immune cell abundance across spatial regions at the RNA level.
Delving into these regional expression profiles, we aimed to identify molecular markers that varied between tumor and immune areas. Regions enriched with tumor cells had elevated levels of proteins linked to the tumor phenotype, such as PanCK and Ki67 alongside IDO1, and reduced levels of immune-related markers like CD4, CD14, CD163, VISTA, beta-2 microglobulin, and ICOS. This pattern suggests a lower prevalence of tumor-infiltrating immune cells in these areas. By contrast, leukocyte and macrophage areas displayed a higher presence of immune cells marked by a more robust expression of immune markers compared to tumor markers, indicative of heightened immune activity (Figure 2(b) and (c)).
Correlational protein target analysis within tumor, leukocyte, and macrophage AOIs showed a significant positive association between epithelial cell markers (PanCK) and proliferative indicators (Ki67, S6). Similarly, the pan-immune cell marker (CD45) correlated strongly with T-cell markers (CD3, CD4, CD8, CD45RO, CD20, CD27, and HLA-DR). In addition, a marked co-expression of CD68 with myeloid markers (CD80, CD163, and CD11c) was observed (Figure 2(d)). Such correlation-based clustering underscores the distinct molecular identities of tumor versus non-tumor regions. Complementary transcriptomic analyses further revealed the distinct expression patterns across regions. The genes that were most associated with the tumor signature were EPCAM and KRT8. Immune signature-related genes, including IGHA1, JCHAIN, C1QA, and CD14, were significantly increased in the CD45+ and CD68+ regions (Supplemental Figure 4(D) and (E)).
To dissect the heterogeneity between tumors at the spatial level, we profiled molecular characteristics across different patients’ spatial regions. Notably, protein expression patterns varied widely between individuals. Utilizing the RECIST v1.1 criteria, patients 1, 2, and 3 were deemed responders to immunotherapy, while patients 5, 6, and 8 were non-responders. In responding patients, expression levels of immune activation markers CD25, GZMB, and GITR were elevated in patients 1 and 2 compared to patient 3, indicating a more active immune status (Supplemental Figures 4(B) and 5(A)). In addition, patient 1 exhibited increased CD40 and B7-H3, and patient 2 demonstrated higher CD27, PD-L2, and 4-1BB levels. The elevated CD66b in patient 3 may suggest a unique adaptation of their primary tumor to the treatment (Supplemental Figure 5(A)). Similar individual variations in immune infiltration were observed among non-responders (patients 5, 6, and 8). For instance, OX40L and PD-L1 expression were prominent in patient 5, while HLA-DR was significantly expressed in patient 6, and STING and IDO1 in patient 8 (Supplemental Figure 5(B)). Notably, transcriptomic data between patients did not reveal the same distinctions observed at the protein level (Supplemental Figure 5(C) and (D)). Collectively, these findings emphasize the pronounced inter- and intra-tumoral heterogeneity inherent in aNSCLC.
The tumor expression signatures and immunological hallmarks were associated with response to camrelizumab
Current insights into immune cell infiltration within the TME of NSCLC, especially across distinct spatial regions, remain incomplete. DSP transcriptomics was employed to quantify immune cell-type expression profiles across distinct spatial regions. Our analysis revealed a significantly lower immune cell density in tumor areas compared to immune regions dominated by leukocytes and macrophages, with macrophages, fibroblasts, memory CD8+ T cells, memory CD4+ T cells, plasma cells, monocytes, regulatory T cells, and dendritic cells being particularly prominent in the leukocyte and macrophage compartment (p < 0.001, Figure 2(e) and (f)). This variation in immune cell infiltration may critically influence therapeutic outcomes. To that end, we assessed the expression programs of patients categorized by their response to immunotherapy, to link cellular functions, metabolic processes, and signaling pathways to tumor and immune responses.
Responders to immunotherapy, particularly to camrelizumab, were characterized by heightened lymphocyte trafficking (p = 0.0033), lymphocyte regulation (p = 0.0017), and cytotoxicity (p = 0.012) signatures. Moreover, pathway scores for chemokines (p = 0.00074), type II interferon (p = 0.027), tumor necrosis factor (p = 0.0028), nuclear factor kappa B (p = 0.00074), and various interleukins (p = 0.0017) were also significantly elevated. Conversely, markers indicative of cell senescence (p = 0.048), differentiation (p = 0.045), and stemness (p = 0.0076) were prevalent among non-responders, suggesting an active tumor cell compartment capable of self-renewal, multidirectional differentiation, and evasion of senescence. In non-responders, pathways related to energy metabolism, including the tricarboxylic acid cycle (p = 0.0012), isocitrate dehydrogenase 1/2 (p = 0.02), and fatty acid synthesis (p = 0.0013), alongside ERBB2 (p < 0.0001), Notch (p = 0.0017), p53 (p = 0.0075), and HIF1 (p = 0.0047) signaling, were notably intensified (Figure 3(a)).
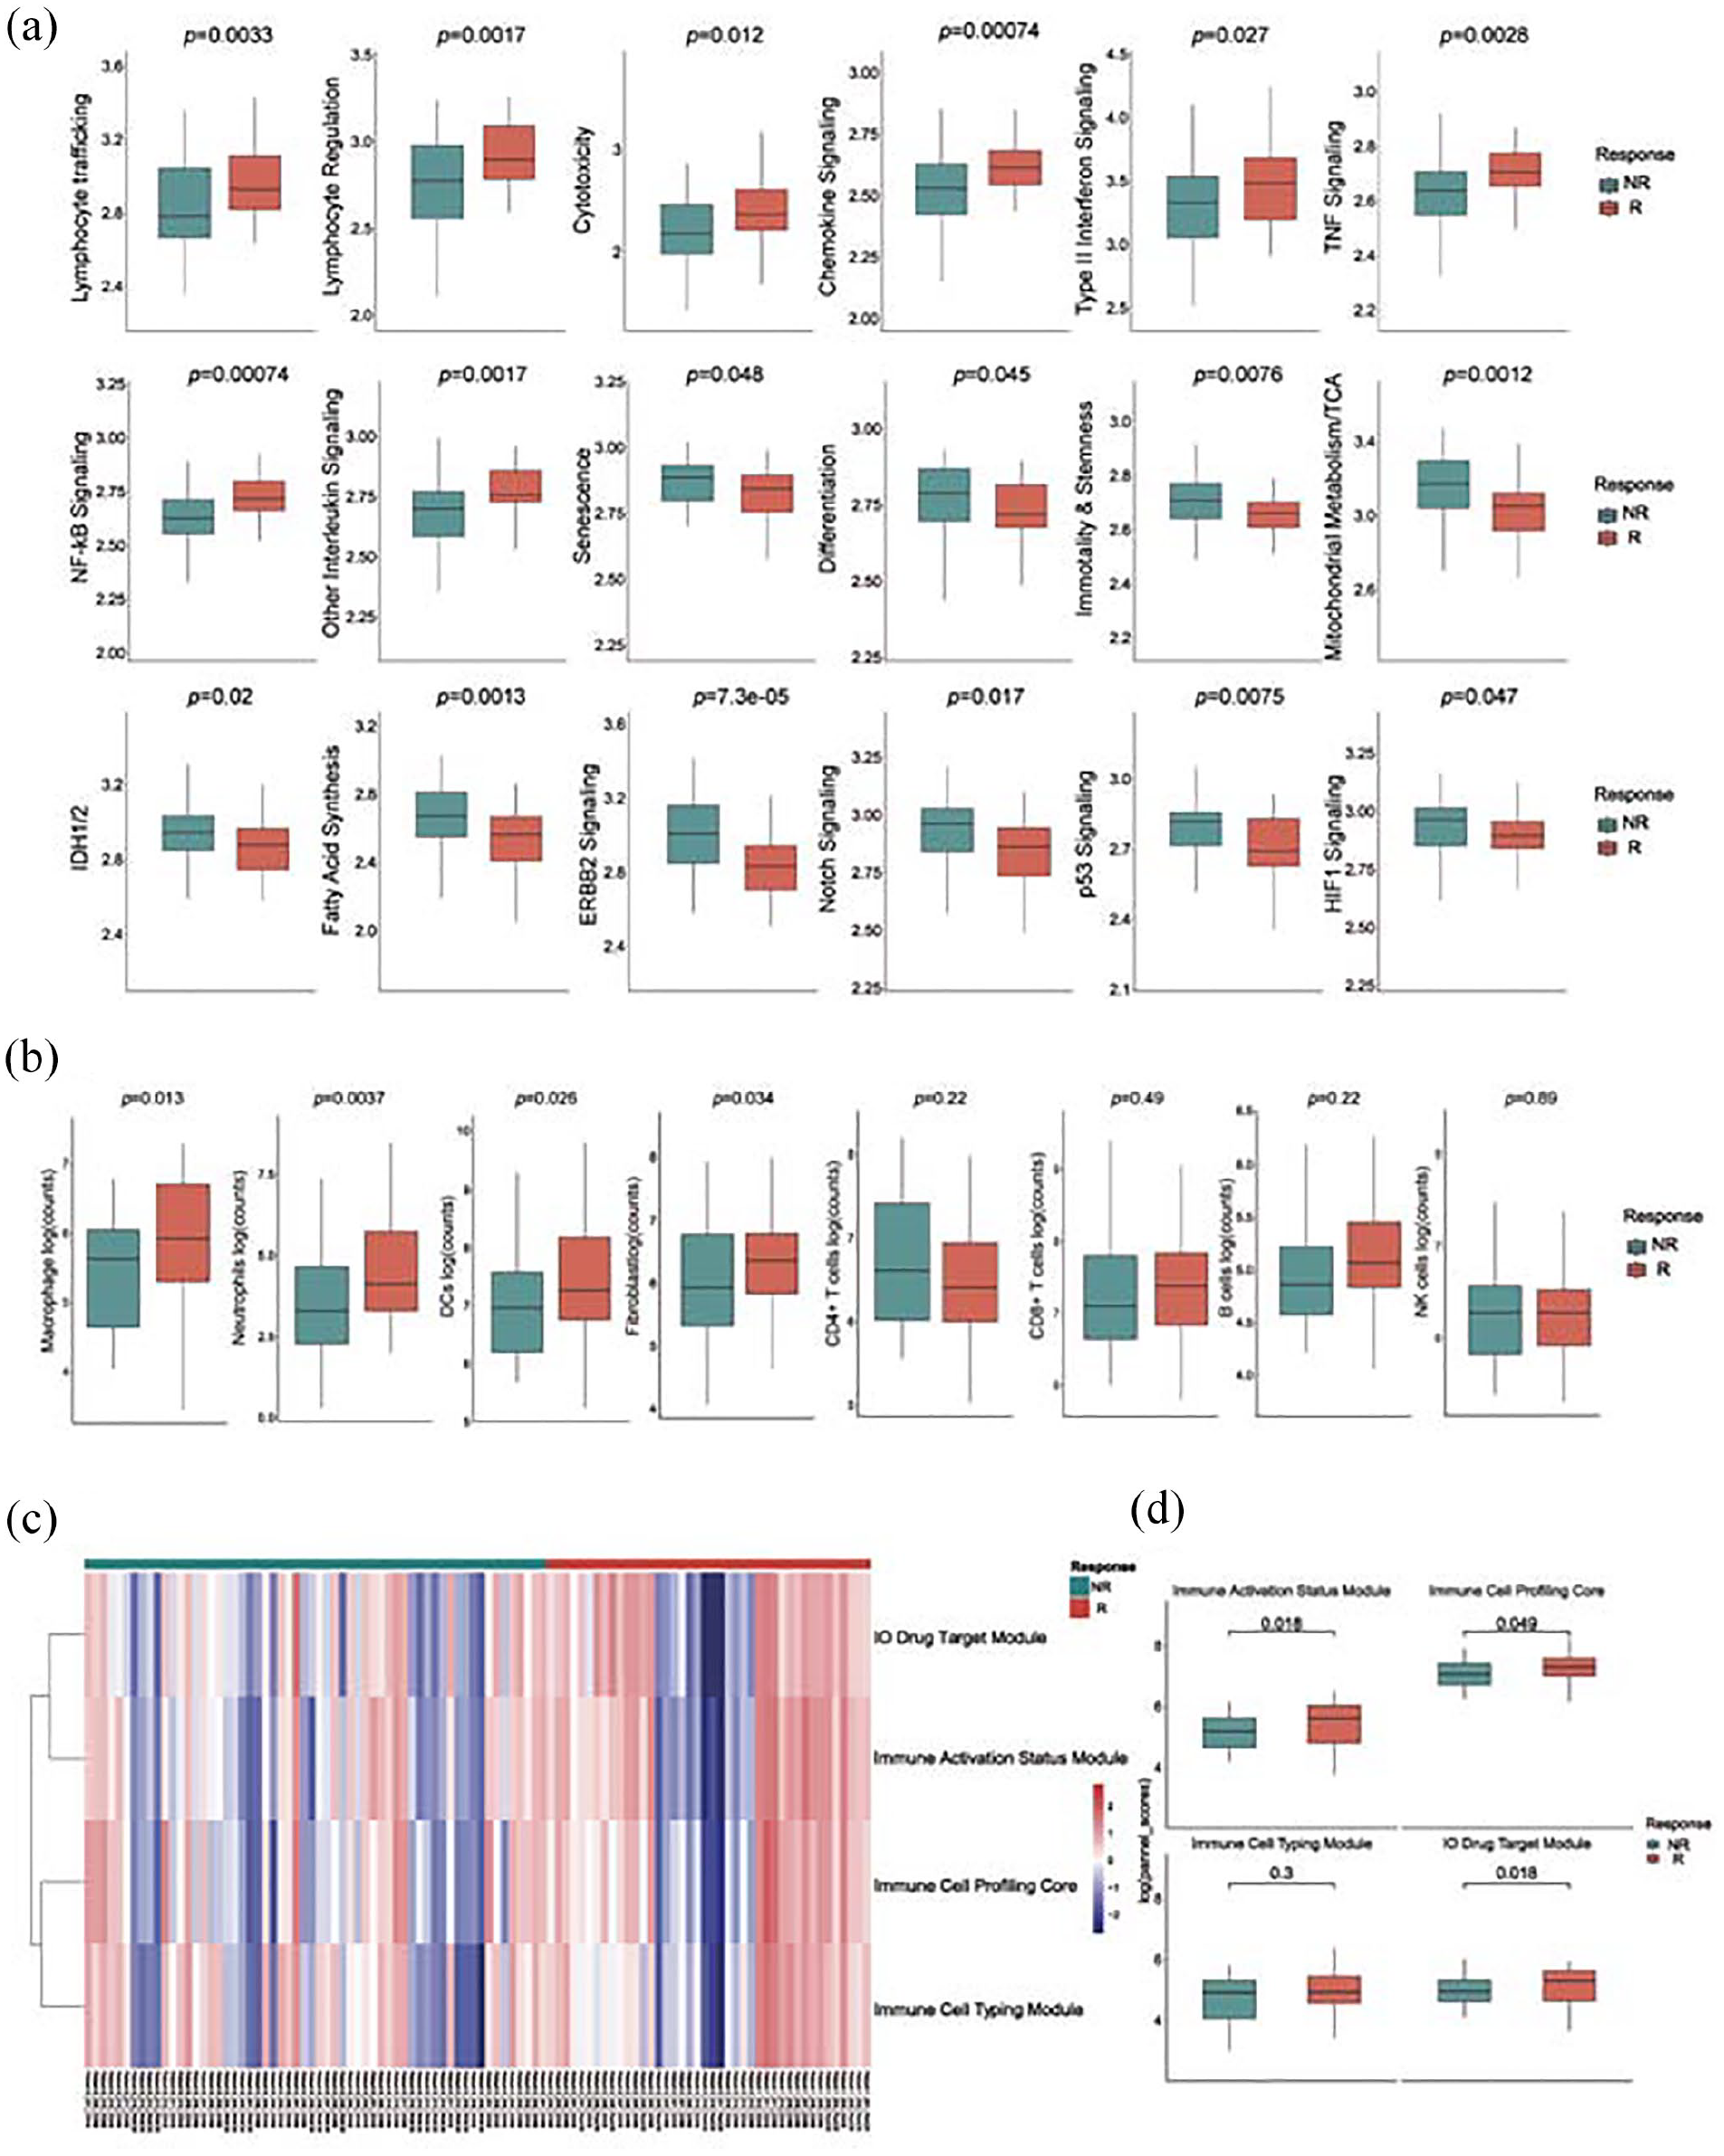
Gene expression signatures and immune cell infiltration in the tumor microenvironment associated with camrelizumab response. (a) Box plot of signatures about tumor and immune cell functions, metabolic processes, and signaling pathways to tumor and immune responses between responders and non-responders. (b) Box plots comparing immune cell infiltration abundance by proteomics between responders and non-responders. (c, d) Heatmap (c) and boxplot (d) of DSP protein panels (IO drug target module, immune activation status module, immune cell profiling core, and immune cell typing module) between responders and non-responders.
Further comparative analysis of immune cell infiltration between immunotherapy efficacy groups showed significantly higher levels of macrophages (p = 0.013), dendritic cells (p = 0.0026), neutrophils (p = 0.0037), and fibroblasts (p = 0.034) in the responders. By contrast, T cells (both CD4+ and CD8+), B cells, and NK cells did not differ significantly between groups (Figure 3(b)). Proteomic profiling also revealed that panels measuring immune activation (p = 0.018), immune cell typing (p = 0.3), core immune cell profiling (p = 0.049), and immunotherapy (IO) drug targets (p = 0.018) were more pronounced in patients with a favorable response to immunotherapy (Figure 3(c) and (d)). These findings underscore the complexity of the TME, indicating that distinct immune cell phenotypes and activation states may contribute to the varying clinical response to camrelizumab.
Identification of CD34 as a potential biomarker
In our quest to discern spatial biomarkers linked to camrelizumab efficacy, we engaged DSP technology to perform a differential analysis of protein markers across tumor, leukocyte, and macrophage compartments. The standard thresholds for selecting differential proteins were set as p < 0.05 and |log2FC| > 1. This comparative study between responders and non-responders to the immunotherapy highlighted the upregulation of CD40, CTLA-4, Tim-3, PD-L1, and IDO1 within the tumor regions of responders (Figure 4(a)). Furthermore, STING and CTLA-4 expressions were elevated in both leukocyte and macrophage compartments of the responder group. In addition, higher expressions of CD80, CD66b, and ARG1 were exclusively detected in macrophage regions (Figure 4(a)). These molecular distinctions were pronounced only upon the segregated analysis of these three areas. Intriguingly, non-responders exhibited significantly higher CD34 protein expression in macrophage and leukocyte areas compared to responders, while no significant difference was observed in the tumor region between groups. Pearson correlation analysis showed a strong correlation between CD34 expression and leukocytes (Figure 4(d), r = 0.51, p < 0.0001) and macrophages (Figure 4(e), r = 0.32, p < 0.0001), suggesting its potential as a spatial biomarker for camrelizumab resistance.

Identification of macrophage CD34 as a potential biomarker. (a, b) Volcano plot (a) and boxplot (b) of differentially expressed proteins between responders and non-responders within PanCK+, CD45+, and CD68+ compartments. (c) Violin plot of CD34 expression in the PanCK+, CD45+, and CD68+ compartment. (d) Correlation analysis between CD34 expression and leukocytes. (e) Correlation analysis between CD34 expression and macrophages. (f) Representative fluorescence region of low and high CD34 expression in the CD68+ compartment. The scale bar denotes 50 µm. PanCK (green), CD68 (red), CD34 (yellow), and DAPI (blue). (g) The MFI of CD34 in the CD68+ compartment compares responders and non-responders. (h) The proportion of responders and non-responders according to CD34 expression in the CD68+ compartment.
To corroborate the relevance of CD34 expression within the macrophage compartments in response to camrelizumab treatment, mIF analysis was conducted on a separate cohort comprising 45 patients who were administered first-line camrelizumab. Representative tissue images depicting the overall morphology and CD34 expression are presented in Supplemental Figure 6(A). Utilizing PanCK and CD68 as markers, we distinguished the tumor and macrophage areas within the mIF images. Tumor regions were demarcated by PanCK positivity, whereas macrophage regions were identified by CD68 positivity. We quantified the presence of CD34 by measuring the geometric MFI within the macrophage regions. Stratifying the IO cohort into groups with high and low CD34 expression based on X-tile optimized cutoff values revealed that non-responders exhibited a markedly elevated MFI of CD34 compared to responders, suggesting that increased CD34 is indicative of PD post-immunotherapy (Figure 4(f)–(h), p = 0.0123). In addition, we observed a stark contrast in immunotherapy response rates: 76% of non-responders manifested high CD34 levels, significantly higher than the 42% recorded within the high CD34 expressing responders (Figure 4(g), p = 0.032).
CD34: A prognostic indicator for progression-free survival
An exploration of the link between CD34 levels and patient survival outcomes revealed that higher CD34 expression is a notable indicator of shorter PFS (Figure 5(a), log-rank p = 0.012). Although a trend toward lower OS was observed in the high CD34 expression group, statistical significance was not attained (Figure 5(b), p = 0.555). Our analysis extended to a multivariate context, assessing the impact of CD34 alongside factors like age, gender, KPS score, TNM stage, smoking history, drinking history, adjuvant radiotherapy, and PD-L1 expression. Initial univariate Cox regression identified high CD34 levels (p = 0.027, hazard ratio (HR) = 5.160; 95% confidence interval (CI): 1.209–22.026) alongside PD-L1 expression (p = 0.046, HR = 0.320; 95% CI: 0.104–0.980) and drinking history (p = 0.082, HR = 2.193; 95% CI: 0.905–5.312) as predictors of PFS (Figure 5(d)). Factors meeting the p < 0.10 threshold in univariate analysis were subsequently evaluated in a multivariate Cox regression, where CD34 expression persisted as an independent risk factor for PFS (p = 0.042, HR = 5.011; 95% CI: 1.057–23.752, Figure 5(e)), after adjusting for confounders. Moreover, DCA was utilized to appraise the potential clinical utility of the CD34 spatial marker. DCA provides a quantitative method to measure the net benefit across different threshold probabilities, incorporating patient preferences regarding the risks of both undertreatment and overtreatment, thereby facilitating more informed decisions regarding model selection and application. 36 The DCA curve indicated that the predictive capability of CD34 expression for PFS surpassed that of both the TNM stage and PD-L1 expression (Figure 5(c)). The clinical effectiveness of CD34 was demonstrated by the CIC. The number of patients identified as high risk (positives) closely matched the number of true positives (high-risk subjects with outcomes). When the threshold probability was above 65% (Supplemental Figure 6(B)). Moreover, the Area Under Curve (AUC) values of CD34 expression, TNM stage, and PD-L1 expression were 0.690, 0.621, and 0.595, respectively (Supplemental Figure 6(C)). Thus, the data demonstrate a distinct advantage of CD34 expression in prognostic prediction and in evaluating the clinical response to camrelizumab compared to traditional markers.
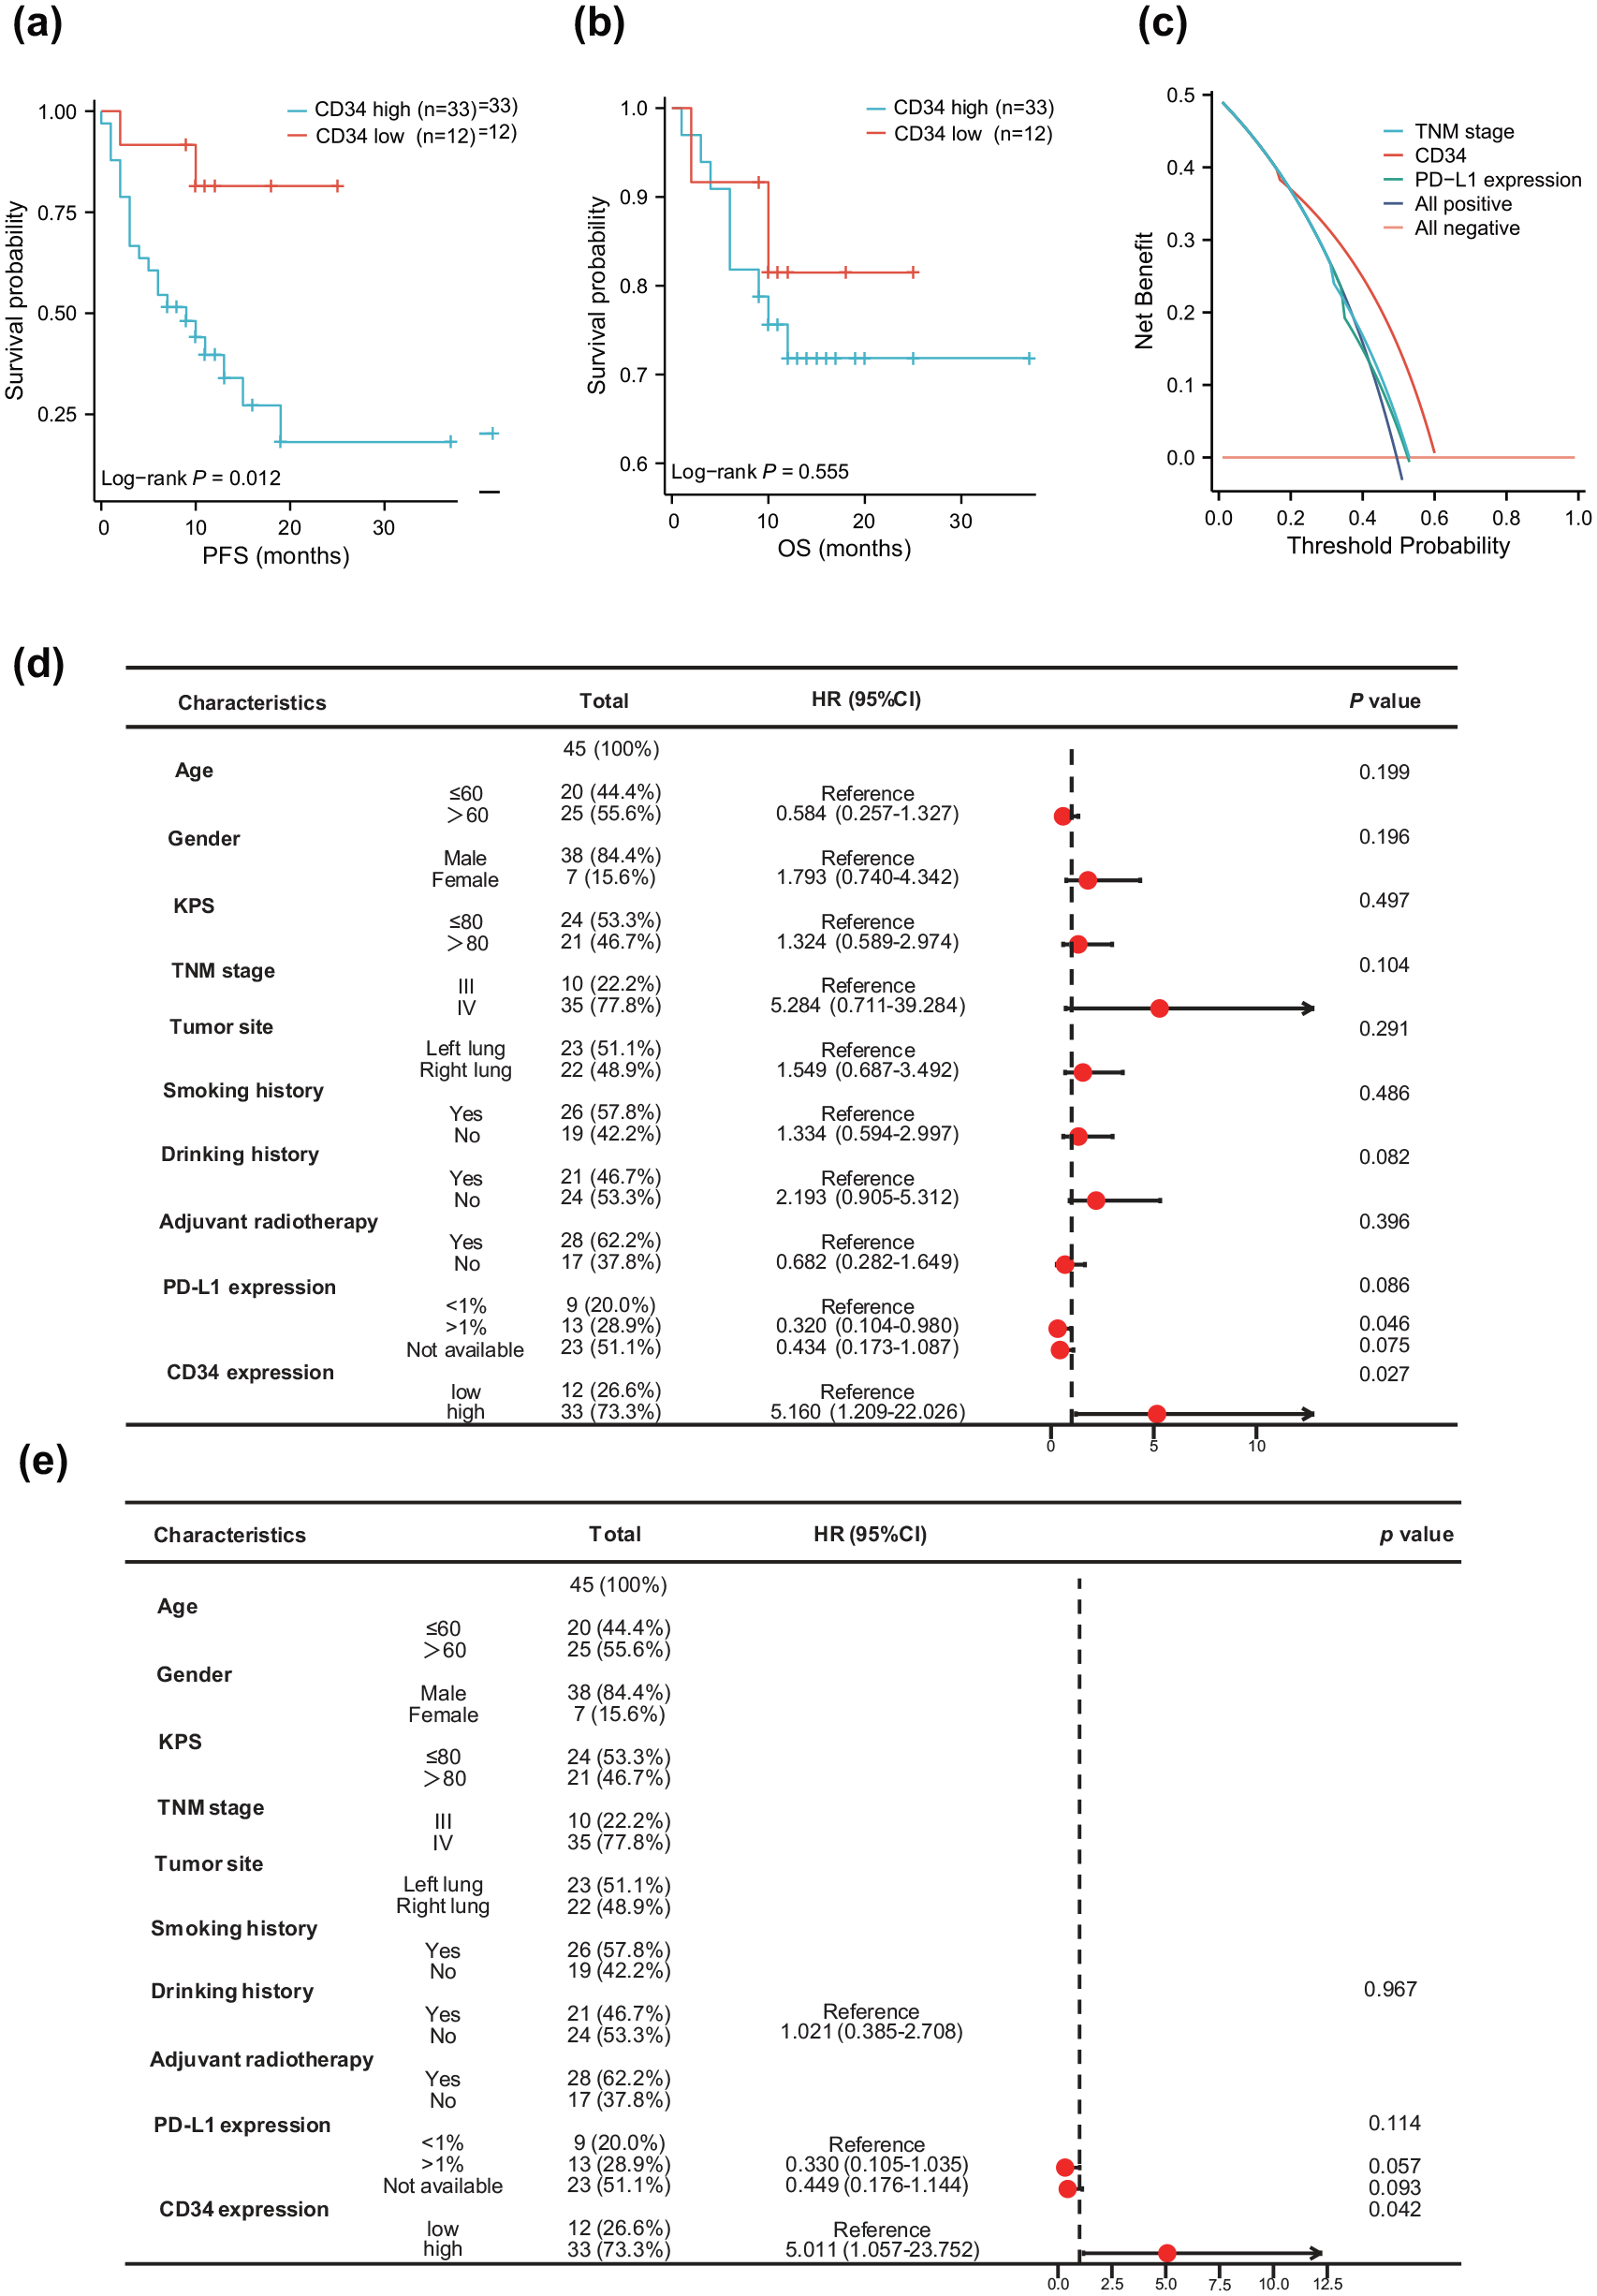
CD34 independently predicts clinical outcomes. (a, b) Kaplan–Meier curves of PFS (a) and OS (b) stratified by macrophage CD34 expression as measured by DSP. (c) DCA curve comparing the predictive efficacy of CD34 expression, PD-L1 expression, and TNM stage in the validation cohort. (d, e) Forest plots illustrating the impact of macrophage CD34 expression on PFS via univariate (d) and multivariate (e) Cox regression analyses.
Discussion
This study employed the NanoString GeoMx DSP platform to conduct a comprehensive spatial transcriptomic and proteomic analysis of FFPE tumor samples from eight patients enrolled in a clinical trial. By spatially mapping molecular profiles within distinct TME regions, we aimed to identify predictive biomarkers of response to camrelizumab in NSCLC. Our study revealed that distinct regions within individual samples, and across different patient samples, exhibited unique molecular and immune expression signatures that correlated with therapeutic outcomes. Moreover, by comparing the spatial expression of biomarkers between groups with varying therapeutic efficacies, we identified overexpression of CD34 in the macrophage compartment, rather than in the tumor compartment, to be closely linked with tumor progression and poorer clinical outcomes. Subsequent mIF analysis of an independent validation cohort of 45 patients reinforced the value of DSP in identifying spatial biomarkers predictive of immunotherapy resistance. To our knowledge, this study represents the first to identify CD34 as a potential prognostic biomarker for camrelizumab efficacy in NSCLC.
Camrelizumab, a humanized monoclonal antibody targeting PD-1, disrupts the interaction between PD-1 on T cells and PD-L1 on tumor cells. This interruption is crucial in reactivating immune cells’ ability to recognize and eradicate tumor cells, thereby intensifying the immune response against cancer. 8 Although camrelizumab has demonstrated considerable antitumor activity and maintained a favorable safety profile across various clinical trials, the absence of robust biomarkers to predict treatment efficacy and patient prognosis has kept its objective response rate suboptimal, with a subset of patients experiencing significant adverse events. Our findings underscore the critical need for integrating spatial biomarker analysis into clinical practice to enhance the predictive precision of immunotherapy responses and guide treatment strategies for aNSCLC.
The predictive power of current primary biomarkers for immunotherapy, notably PD-L1 37 and TMB, 11 remains suboptimal. Studies like those by Kazdal et al. 38 demonstrate significant spatial variability in TMB across tumor regions, while Wang et al. 39 highlight that dynamic and spatially heterogeneous PD-L1 expression in tumor cells undermines the efficacy of PD-L1-targeted therapies. Consistently, ITH is increasingly recognized as a pivotal factor contributing to resistance to immunotherapy,40–42 and it is frequently associated with a poor prognosis across various cancer types, including NSCLC.43–47
The recent advancements in high-throughput spatial sequencing have catalyzed a surge of studies dissecting tumor spatial heterogeneity. Among them, DSP stands out with its high-dimensional, multi-omics capabilities. DSP synergizes quantitative expression data with in situ tissue analysis, allowing for the simultaneous examination of hundreds of proteins and thousands of mRNAs within FFPE tissue sections, thereby harmoniously integrating histopathology, tumor immunity, and expression profiling.32,48 Early investigations using DSP for melanoma immunotherapy marker identification found PD-L1 expression in CD68+ cells rather than tumor cells, signifying its prognostic value for PFS and OS. 49 Jon et al’s exploratory work with NSCLC employed DSP for proteomic analysis on TMA samples, uncovering that a high density of CD56+ immune cells within the stroma markedly correlates with extended PFS and OS 50 . Furthermore, DSP studies on NSCLC TMA samples have successfully pinpointed CD44 as a marker indicative of sensitivity to anti-PD-1 treatment. 51 While spatial analyses provide a substantial advancement over preceding bulk sequencing techniques, the ROI strategy of TMA in prior studies limits the potential to attribute markers to specific cell types, thus constraining the depth of ITH analysis. Our research transcends this limitation by segmenting the TME of aNSCLC patients receiving camrelizumab, creating specific AOIs that capture the nuance of intra- and inter-tumoral heterogeneity. The differential analysis of these spatial regions revealed distinct biomarker expression patterns between tumor and immune regions. This study, in concert with prior research, underscores the critical role of spatial segmentation in obtaining profound insights into the NSCLC spatial niche during ICI treatment.
To mitigate the impact of ITH on biomarker discovery for camrelizumab efficacy, our analysis compared therapeutic responses across various spatial domains. GeoMx DSP data highlighted CD34’s significant correlation with resistance to camrelizumab, particularly within the leukocyte and macrophage compartments. Further validation through mIF reaffirmed the higher differential expression levels of CD34 in the macrophage area, consistent with our DSP observations.
CD34, a highly glycosylated member of the sialomucin family, is prevalent in progenitor cells and is a recognized marker for hematopoietic lineage. 18 In addition, it is also recognized as a marker for non-hematopoietic stem cells, which is expressed in various cancer stem cells,52–57 highlighting its broader role beyond hematopoietic tissues. In our study, analysis of CD34 expression in the validation cohort revealed that high CD34 levels were associated with poor prognosis in aNSCLC patients. This finding is consistent with previous studies that have established CD34 as a prognostic marker in several cancer types. For instance, in low-grade glioma, CD34 has been identified as a marker of poor prognosis for both PFS and OS. 22 Similarly, in NSCLC, high CD34 expression is linked to unfavorable prognosis, 56 while in gastrointestinal stromal tumors, elevated CD34 levels correlate strongly with reduced PFS. 23 In neuroblastoma, high CD34 expression is associated with lower patient survival rates. 24 Besides, patients who did not respond to camrelizumab exhibited significantly higher CD34 expression in macrophage regions compared to responders. This suggests that elevated CD34 in aNSCLC may contribute to a TME that predisposes patients to increased resistance to ICIs, consistent with previous literature.58–60 However, prior studies have been limited by a lack of spatial context analysis, highlighting the need for further research to better define the optimal patient populations for targeted therapies.
Given the association of CD34 with poor prognosis and resistance to ICIs, integrating CD34-targeted therapies with existing immunotherapy regimens could offer a promising strategy for overcoming treatment resistance. Combining CD34 inhibition with PD-1/PD-L1 blockers may enhance the efficacy of immunotherapy by modifying the TME to become more responsive to immune interventions. Preclinical studies exploring the potential of such combination therapies are warranted, as they could pave the way for novel therapeutic approaches that improve outcomes for aNSCLC patients who exhibit high CD34 expression.
Our differential expression analysis identified several biomarkers intricately associated with camrelizumab’s therapeutic efficacy. A pivotal element within this landscape is STING, a cornerstone molecule of innate immunity that orchestrates the spontaneous antitumor immune response. Notably, STING expression was markedly enhanced within the leukocyte and macrophage AOIs of patients who responded to camrelizumab treatment. The current trajectory of research is harnessing STING agonists to leverage this pathway for formidable antitumor effects. 61 Yet, despite the anticipatory immune response that STING agonists elicit, attenuating tumor proliferation, prolonged administration at high doses paradoxically results in immune tolerance, T-cell apoptosis, and upregulation of PD-L1 and IDO1—events that ultimately facilitate tumor immune escape.62–65 This phenomenon echoes the elevated levels of PD-L1 and IDO1 identified in the white cell regions in our investigation. The duality of STING activation, as our findings suggest, underlines its ambiguous nature in tumor immunity, serving both as a facilitator of immune activation and, conversely, as a potential pathway to immune resistance.
Our study also uncovered differential expression of CD80 and ARG1 in macrophage AOIs, indicating potential avenues for TAM re-education as a strategy to counteract immunotherapy resistance.66,67 Moreover, our findings indicate substantial co-expression of STING with the neutrophil marker CD66b in camrelizumab-responding patients, as recent literature underscores their significance in cancer immunotherapy.68,69 The expression of CTLA-4, a pivotal modulator of T-cell activity and self-tolerance, was also prevalent in the macrophage domains of responders, suggesting its involvement in the efficacy of ICI therapies. 70
Conclusively, the collective insights from mRNA, protein, and mIF analyses in our study have underscored the superior predictive efficacy of CD34 over traditional prognostic indicators like TNM staging and PD-L1 expression. This suggests that novel spatially resolved markers, such as CD34, can not only complement but also enhance the predictive capacity of established biomarkers. Such findings reaffirm the utility of DSP in the identification of reliable biomarkers for immunotherapy responses, marking a significant stride in precision medicine.
There are several limitations to consider, despite the promising insight gained from this study. The modest sample size and retrospective nature of this single-center study might introduce selection bias. In addition, due to the finite area of puncture samples and the complex heterogeneity of the TME, there is a potential for misrepresenting biomarker expression when extrapolating to the entirety of the tissue section. The rigidity in FFPE section quality requirements further restricted the comprehensive proteomic analysis to a subset of patients, potentially leading to incomplete correspondence between transcriptomic and proteomic data. Consequently, a cautious interpretation of these results is advised. Future studies with expanded cohorts and multi-center participation are anticipated to corroborate and extend upon these preliminary findings. Moreover, while CD34 demonstrated significant predictive value, the precise mechanisms by which macrophage CD34 modulates the immune response within the TME remain unclear. Further research is necessary to determine whether CD34 participates in an interactive network with other cellular components within the TME.
Conclusion
In summary, our study provides new insights into understanding the ITH of aNSCLC prior to ICI therapy and identifies potential markers predictive of differential responses to immunotherapy. By leveraging the DSP, we reveal distinct molecular and immune profiles associated with patient outcomes. Specifically, elevated CD34 expression within the macrophage compartment emerged as a potential prognostic indicator of poor response to camrelizumab therapy. These results underscore the importance of spatial analysis for understanding immunotherapy resistance and suggest CD34 as a promising biomarker for patient stratification. Further validation in larger cohorts is warranted to solidify these findings and inform the development of optimized treatment strategies.
Supplemental Material
sj-docx-1-tam-10.1177_17588359241289671 – Supplemental material for CD34 as a potential prognostic indicator for camrelizumab response in advanced non-small-cell lung cancer: insights from digital spatial profiling
Supplemental material, sj-docx-1-tam-10.1177_17588359241289671 for CD34 as a potential prognostic indicator for camrelizumab response in advanced non-small-cell lung cancer: insights from digital spatial profiling by Xinyi Huang, Baoqing Tian, Ziyuan Ren, Jingxin Zhang, Weiwei Yan, You Mo, Jupeng Yuan, Yujiao Ma, Ruiyang Wang, Rufei Liu, Minxin Chen, Jinming Yu and Dawei Chen in Therapeutic Advances in Medical Oncology
Supplemental Material
sj-docx-2-tam-10.1177_17588359241289671 – Supplemental material for CD34 as a potential prognostic indicator for camrelizumab response in advanced non-small-cell lung cancer: insights from digital spatial profiling
Supplemental material, sj-docx-2-tam-10.1177_17588359241289671 for CD34 as a potential prognostic indicator for camrelizumab response in advanced non-small-cell lung cancer: insights from digital spatial profiling by Xinyi Huang, Baoqing Tian, Ziyuan Ren, Jingxin Zhang, Weiwei Yan, You Mo, Jupeng Yuan, Yujiao Ma, Ruiyang Wang, Rufei Liu, Minxin Chen, Jinming Yu and Dawei Chen in Therapeutic Advances in Medical Oncology
Supplemental Material
sj-docx-3-tam-10.1177_17588359241289671 – Supplemental material for CD34 as a potential prognostic indicator for camrelizumab response in advanced non-small-cell lung cancer: insights from digital spatial profiling
Supplemental material, sj-docx-3-tam-10.1177_17588359241289671 for CD34 as a potential prognostic indicator for camrelizumab response in advanced non-small-cell lung cancer: insights from digital spatial profiling by Xinyi Huang, Baoqing Tian, Ziyuan Ren, Jingxin Zhang, Weiwei Yan, You Mo, Jupeng Yuan, Yujiao Ma, Ruiyang Wang, Rufei Liu, Minxin Chen, Jinming Yu and Dawei Chen in Therapeutic Advances in Medical Oncology
Supplemental Material
sj-docx-4-tam-10.1177_17588359241289671 – Supplemental material for CD34 as a potential prognostic indicator for camrelizumab response in advanced non-small-cell lung cancer: insights from digital spatial profiling
Supplemental material, sj-docx-4-tam-10.1177_17588359241289671 for CD34 as a potential prognostic indicator for camrelizumab response in advanced non-small-cell lung cancer: insights from digital spatial profiling by Xinyi Huang, Baoqing Tian, Ziyuan Ren, Jingxin Zhang, Weiwei Yan, You Mo, Jupeng Yuan, Yujiao Ma, Ruiyang Wang, Rufei Liu, Minxin Chen, Jinming Yu and Dawei Chen in Therapeutic Advances in Medical Oncology
Supplemental Material
sj-docx-5-tam-10.1177_17588359241289671 – Supplemental material for CD34 as a potential prognostic indicator for camrelizumab response in advanced non-small-cell lung cancer: insights from digital spatial profiling
Supplemental material, sj-docx-5-tam-10.1177_17588359241289671 for CD34 as a potential prognostic indicator for camrelizumab response in advanced non-small-cell lung cancer: insights from digital spatial profiling by Xinyi Huang, Baoqing Tian, Ziyuan Ren, Jingxin Zhang, Weiwei Yan, You Mo, Jupeng Yuan, Yujiao Ma, Ruiyang Wang, Rufei Liu, Minxin Chen, Jinming Yu and Dawei Chen in Therapeutic Advances in Medical Oncology
Supplemental Material
sj-eps-10-tam-10.1177_17588359241289671 – Supplemental material for CD34 as a potential prognostic indicator for camrelizumab response in advanced non-small-cell lung cancer: insights from digital spatial profiling
Supplemental material, sj-eps-10-tam-10.1177_17588359241289671 for CD34 as a potential prognostic indicator for camrelizumab response in advanced non-small-cell lung cancer: insights from digital spatial profiling by Xinyi Huang, Baoqing Tian, Ziyuan Ren, Jingxin Zhang, Weiwei Yan, You Mo, Jupeng Yuan, Yujiao Ma, Ruiyang Wang, Rufei Liu, Minxin Chen, Jinming Yu and Dawei Chen in Therapeutic Advances in Medical Oncology
Supplemental Material
sj-eps-11-tam-10.1177_17588359241289671 – Supplemental material for CD34 as a potential prognostic indicator for camrelizumab response in advanced non-small-cell lung cancer: insights from digital spatial profiling
Supplemental material, sj-eps-11-tam-10.1177_17588359241289671 for CD34 as a potential prognostic indicator for camrelizumab response in advanced non-small-cell lung cancer: insights from digital spatial profiling by Xinyi Huang, Baoqing Tian, Ziyuan Ren, Jingxin Zhang, Weiwei Yan, You Mo, Jupeng Yuan, Yujiao Ma, Ruiyang Wang, Rufei Liu, Minxin Chen, Jinming Yu and Dawei Chen in Therapeutic Advances in Medical Oncology
Supplemental Material
sj-eps-6-tam-10.1177_17588359241289671 – Supplemental material for CD34 as a potential prognostic indicator for camrelizumab response in advanced non-small-cell lung cancer: insights from digital spatial profiling
Supplemental material, sj-eps-6-tam-10.1177_17588359241289671 for CD34 as a potential prognostic indicator for camrelizumab response in advanced non-small-cell lung cancer: insights from digital spatial profiling by Xinyi Huang, Baoqing Tian, Ziyuan Ren, Jingxin Zhang, Weiwei Yan, You Mo, Jupeng Yuan, Yujiao Ma, Ruiyang Wang, Rufei Liu, Minxin Chen, Jinming Yu and Dawei Chen in Therapeutic Advances in Medical Oncology
Supplemental Material
sj-eps-7-tam-10.1177_17588359241289671 – Supplemental material for CD34 as a potential prognostic indicator for camrelizumab response in advanced non-small-cell lung cancer: insights from digital spatial profiling
Supplemental material, sj-eps-7-tam-10.1177_17588359241289671 for CD34 as a potential prognostic indicator for camrelizumab response in advanced non-small-cell lung cancer: insights from digital spatial profiling by Xinyi Huang, Baoqing Tian, Ziyuan Ren, Jingxin Zhang, Weiwei Yan, You Mo, Jupeng Yuan, Yujiao Ma, Ruiyang Wang, Rufei Liu, Minxin Chen, Jinming Yu and Dawei Chen in Therapeutic Advances in Medical Oncology
Supplemental Material
sj-eps-8-tam-10.1177_17588359241289671 – Supplemental material for CD34 as a potential prognostic indicator for camrelizumab response in advanced non-small-cell lung cancer: insights from digital spatial profiling
Supplemental material, sj-eps-8-tam-10.1177_17588359241289671 for CD34 as a potential prognostic indicator for camrelizumab response in advanced non-small-cell lung cancer: insights from digital spatial profiling by Xinyi Huang, Baoqing Tian, Ziyuan Ren, Jingxin Zhang, Weiwei Yan, You Mo, Jupeng Yuan, Yujiao Ma, Ruiyang Wang, Rufei Liu, Minxin Chen, Jinming Yu and Dawei Chen in Therapeutic Advances in Medical Oncology
Supplemental Material
sj-eps-9-tam-10.1177_17588359241289671 – Supplemental material for CD34 as a potential prognostic indicator for camrelizumab response in advanced non-small-cell lung cancer: insights from digital spatial profiling
Supplemental material, sj-eps-9-tam-10.1177_17588359241289671 for CD34 as a potential prognostic indicator for camrelizumab response in advanced non-small-cell lung cancer: insights from digital spatial profiling by Xinyi Huang, Baoqing Tian, Ziyuan Ren, Jingxin Zhang, Weiwei Yan, You Mo, Jupeng Yuan, Yujiao Ma, Ruiyang Wang, Rufei Liu, Minxin Chen, Jinming Yu and Dawei Chen in Therapeutic Advances in Medical Oncology
Footnotes
Acknowledgements
We extend our deepest gratitude to the patients whose participation was instrumental to this study. Our sincere appreciation goes to the technologists at Shandong Fynn Biotechnologies Ltd, whose expertise was pivotal in conducting the DSP assays. We also wish to acknowledge Feng Xu and Xinpin Zhuang from Shandong PhenoScience Biotechnology Ltd for their invaluable assistance in the automated quantification of cell types and markers. In addition, we express our thanks to Jiangsu Hengrui Pharmaceuticals Co., Ltd, not only for supplying camrelizumab for the study but also for their collaboration in providing access to relevant clinical trial data.
Declarations
ORCID iDs
Supplemental material
Supplemental material for this article is available online.
References
Supplementary Material
Please find the following supplemental material available below.
For Open Access articles published under a Creative Commons License, all supplemental material carries the same license as the article it is associated with.
For non-Open Access articles published, all supplemental material carries a non-exclusive license, and permission requests for re-use of supplemental material or any part of supplemental material shall be sent directly to the copyright owner as specified in the copyright notice associated with the article.