
Abstract
Background and objectives:
To evaluate the prognostic value of an integrated model consisting of tumour response to induction chemotherapy (IC) and gross tumour volume (GTV) after IC in nasopharyngeal carcinoma (NPC) and elucidate optimal cumulative cisplatin dose (CCD) in concurrent chemoradiotherapy (CCRT) for different subgroups.
Design and methods:
This retrospective study enrolled 896 patients with NPC diagnosed from 2010 to 2017 receiving IC plus radiotherapy. The primary endpoint was disease-free survival (DFS). Cut-off points for GTV were combined with IC response to develop an integrated model. Propensity score matching (PSM) was used to adjust for potential confounders. Survival outcomes and acute toxicity were compared between the different CCD groups.
Results:
Unsatisfactory IC response and large GTV after IC were correlated with poor survival outcomes; the AUC increased to 0.668 when these factors were incorporated. The integrated model classified patients into three groups. After PSM, radiotherapy alone and CCRT demonstrated similar efficacy in the low-risk group (complete response (CR)/partial response (PR) and GTV <68 cm3 after IC). In the intermediate-risk group (CR/PR but GTV ⩾68 cm3), CCD of >200 mg/m2 and 101–200 mg/m2 increased the 5-year DFS rates (83.7% vs 81.1% vs 65.3%, p = 0.042). In the high-risk group (stable disease/progressive disease and any GTV), the use of different CCDs did not result in significantly different survival outcomes (p = 0.793). Additionally, high CCD was significantly associated with increased incidence of grade 1–4 acute toxicity.
Conclusion:
The integrated model incorporating IC response and GTV after IC demonstrates satisfactory value in risk stratification and the potential to guide individualised decision-making in CCD selection. Balancing toxicity and efficacy, RT alone seems to be the optimal treatment for patients in low-risk groups and 200 mg/m2 might be the optimal dose for intermediate-risk groups. Moreover, increasing CCD does not benefit patients in high-risk groups, and treatment options for these patients require further consideration.
Keywords
Introduction
Nasopharyngeal carcinoma (NPC) is an endemic malignancy that is particularly prevalent in Southeast Asia, especially South China.1,2 Radiotherapy and chemotherapy are the main treatments for NPC because of their deep-seated anatomical location and biological characteristics of invasion and metastasis. In recent years, studies have shown that cisplatin-based concurrent chemoradiation therapy (CCRT) and induction chemotherapy (IC) are beneficial in improving the prognosis of patients with locoregionally advanced nasopharyngeal carcinoma (LANPC).3–6 According to the latest guidelines from the National Comprehensive Cancer Network (version 4. 2024) and the Chinese Society of Clinical Oncology, IC plus CCRT is the standard treatment regimen for patients with stage III–IVA LANPC.7,8 Although the addition of chemotherapeutic agents improves the prognosis, 20%–30% of patients still experience treatment failure with distant metastasis, locoregional relapse or both. 9 Moreover, the increase in treatment intensity may reduce the patient’s tolerance. Therefore, it is important to identify different risk subgroups in patients with LANPC for individualised therapy. Patients in the low-risk subgroup should not receive excessive treatment to reduce the toxicity risk, whereas the treatment for those in the high-risk subgroup should be more aggressive to improve survival rates.
Several studies10,11 have reported the prognostic value of cumulative cisplatin dose (CCD), which is defined as the total cumulative dose of cisplatin used during CCRT. However, the optimal CCD remains controversial for patients treated with IC plus CCRT. Our previous studies12,13 have shown that tumour response to IC is an independent prognostic factor and serves as a guide for optimising the suitable CCD for CCRT. Other studies14–16 have shown that restaging after IC and post-IC gross tumour volume (GTV) are even better prognostic predictors of NPC than the TNM staging. Wen et al. 17 attempted to use post-IC GTV instead of traditional response evaluation as an indicator of the efficacy of IC. However, it is not comprehensive enough to analyse these two aspects separately. IC response, usually calculated by measuring the maximum diameter of the tumour, reflects the shrinkage or enlargement of the tumour without considering the remaining tumour burden. 18 Meanwhile, GTV provides three-dimensional information and takes tumour burden into account. However, GTV neglects the comparison of volume before and after chemotherapy. No relevant study has yet considered both tumour response to IC and tumour volume after IC.
In this study, we analysed the prognostic value of integrating IC response and GTV after IC. In addition, we conducted a subgroup analysis to compare the therapeutic value of CCD in different risk subgroups to help clinicians choose the optimal CCD.
Methods
Patients
From May 2010 to December 2017, 896 patients newly diagnosed with LANPC at the Sun Yat-sen University Cancer Center were included in this retrospective study. The eligibility criteria were as follows: (1) patients with pathologically confirmed NPC stage III–IVA (based on the American Joint Committee on Cancer Union for International Cancer Control, UICC/AJCC eighth edition staging system); (2) Karnofsky Performance Scale score >70; (3) patients who received IC plus RT (without concurrent chemotherapy or with cisplatin-based concurrent chemotherapy regimen); (4) available imaging evaluation data after IC; (5) no secondary pregnancy, lactation or other malignant diseases and (6) adequate level of organ function. All patients underwent serial evaluations including routine physical examination, head and neck magnetic resonance imaging (MRI) with contrast, direct and indirect nasopharyngoscopy, electrocardiography, chest radiography/computed tomography (CT) with contrast, abdominal ultrasonography/CT with contrast, bone scanning, plasma Epstein–Barr virus (EBV) DNA load by quantitative PCR before treatment and EBV serology at baseline. This study adhered to The Strengthening the Reporting of Observational Studies in Epidemiology Statement guidelines. 19
Treatment and tumour response evaluation
All the included patients received IC. The IC regimens included the following: taxanes with cisplatin, cisplatin with fluorouracil and taxanes plus cisplatin with fluorouracil. T indicates taxane in any form, including docetaxel (60–75 mg/m2, day 1, intravenous infusion, infusion for 1 h), liposomal paclitaxel (135 mg/m2, day 1, intravenous infusion, infusion for 3 h) and protein-bound paclitaxel (240–260 mg/m2, day 1, intravenous infusion, infusion for 30 min). P indicates cisplatin (60–80 mg/m2, day 1, intravenous infusion, infusion for 3 h). F indicates fluorouracil (600–1000 mg/m2, continuous intravenous infusion for 120 h). Each regimen was administered at 3-week intervals for two to four cycles.
The radiotherapy modality used was an intensity-modulated RT (IMRT), with cumulative doses ranging from 66 to 70 Gy and daily partial doses ranging from 2.00 to 2.36 Gy. Radiotherapy was started 22 days (days 20–24) after the last cycle of IC. The remaining IMRT programme characteristics followed previously published principles.4,20–22 If cisplatin chemotherapy was administered concurrently during radiotherapy, the dose of cisplatin used was 80–100 mg/m2 every 3 weeks or 30–40 mg/m2 every week.23,24
Due to the advantages of the high soft-tissue resolution, multipara-metric imaging and non-ionising radiation,7–9 MRI of the nasopharynx and neck was performed before treatment and after IC, and the results were obtained for response evaluation. If patients have contraindications, MRI is replaced by CT. Treatment response was assessed according to RECIST 1.1. 18 Tumour lesions with the longest diameter of >10 mm in the nasopharynx and metastatic cervical lymph nodes (CLNs) with a short axis of >15 mm were defined as the target lesions. Complete response (CR) was defined as no definite soft tissue mass in the nasopharyngeal region, with the short axis of all CLNs being <10 mm. Partial response (PR) was defined as at least a 30% decrease in the sum of the diameters of the target lesions compared with the baseline sum of diameters. Progressive disease (PD) was defined as at least a 20% increase in the sum of the diameters of the target lesions and an absolute increase of at least 5 mm, or the appearance of one or more new lesions. Stable disease (SD) was defined as insufficient tumour shrinkage or increase in size to qualify for PR or PD, respectively.
GTV measurement
The patients were immobilised in the supine position using a head, neck and shoulder thermoplastic mask. After contrast-enhanced CT imaging, the scope of each scan was performed at a thickness of 3 mm from the head to 2 cm below the sternoclavicular joint. Images were transferred to the radiotherapy planning system, in which the GTVs of the nasopharynx (GTVnx) and cervical lymph nodes (GTVnd) were manually delineated by two radiation oncologists specialising in NPC.
Diagnoses of primary lesions and CLNs were based on the findings of MRI of the nasopharynx and neck before treatment, according to published radiological criteria.25–27 The soft tissue area in the GTVnx was delineated according to imaging examinations after IC, whereas the skull base bones were delineated according to imaging before IC.28,29 Retropharyngeal lymph node involvement was included in GTVnx. If the primary tumour was to be directly contiguous with regional lymph nodes, we used the cut-off level of the mid-C2 vertebral body to separate the primary tumour from the positive lymph nodes. 30 The delineation range of CLNs was based on the imaging size after IC. Finally, GTVnx and GTVnd were calculated automatically using the treatment planning system to multiply the entire area.
Outcomes and follow-up
The primary endpoint of this study was disease-free survival (DFS), defined as the period from the first day of IC to the date of disease relapse (either locoregional failure or distant metastasis) or death from any cause. The secondary endpoints were overall survival (OS), local–regional relapse-free survival (LRFS) and distant metastasis-free survival (DMFS), defined as the period from the first day of IC to the date of death from any cause, local or regional relapse and distant metastasis, respectively. The patients were followed up according to the routine practice at the study institute. Patients were evaluated by nasopharyngoscopy, MRI of the head and neck, chest radiography, abdominal sonography and plasma EBV DNA measurement every 3 months during the first 3 years after the completion of treatment, every 6 months during the next 2 years and annually thereafter until death. The final follow-up was on April 2023. Positron emission tomography-CT and other diagnostic modalities were considered when necessary. Acute haematologic toxicity during CCRT was graded according to the Common Terminology Criteria for Adverse Events (version 5.0).
Statistical analysis
Correlations between different groups and clinical characteristics were assessed using the Chi-square and Fisher’s exact probability tests. The cut-off points for GTV and EBV DNA were determined using receiver operating characteristic (ROC) curve analysis. Survival outcomes were analysed using the Kaplan–Meier survival curves and log-rank test. Univariate and multivariate Cox analyses were performed to investigate the prognostic value using stepwise regression. ROC curve and decision curve analysis (DCA) were used to evaluate and compare prediction capabilities. The AUC of the ROC curve was compared using the ‘roc.test’ embedded in the R language package ‘pROC’ (version 4.2.0). 31 Propensity score matching (PSM) was used to adjust for potential confounders with the nearest neighbour-matching method embedded in the R language package ‘MatchIt’ (version 4.2.0). All other statistical analyses were performed using the SPSS Statistics for Windows (version 25.0; IBM Corp., Armonk, NY, USA). All statistical analyses were two-sided. Statistical significance was set at p < 0.05.
Results
Patient characteristics and survival outcomes
A total of 896 patients were included. For the entire cohort, the median age was 43 (range 8–77) years, with 219 females (24.4%) and 677 males (75.6%). The tumour response to IC was as follows: 20 (2.2%) patients experienced CR, 654 (73.0%) were evaluated as PR, 217 (24.2%) achieved SD and 5 (0.6%) experienced PD. Among the patients, 18.8% (n = 168) received CCD <100 mg/m2, 60.9% (n = 546) received CCD 101–200 mg/m2 and 20.3% (n = 182) received CCD ⩾200 mg/m2.
The median GTV was 64.95 cm3 (range 2.20–328.10 cm3). Based on the ROC curve, the cut-off value of GTV was 67.95 cm3 for DFS (sensitivity, 58.2%; specificity, 69.1%; AUC = 0.641; p < 0.001). Therefore, a uniform cut-off value of 68 cm3 (>68 vs ⩽68 cm3) was selected to stratify all patients into large and small GTV groups for survival analysis. The clinical characteristics of the patients and the differences between the CR/PR and SD/PD groups and between large and small GTV after IC groups are shown in Table 1.
Baseline characteristics of the included patients.

TNM stage was based on the eighth edition of the UICC/AJCC staging system.
Tumour response was evaluated according to the Response Evaluation in Solid Tumors (RECIST version 1.1) guidelines.
Values in bold indicate p < 0.05.
CCD, cumulative cisplatin dose; CR, complete response; EBV, Epstein–Barr virus; GTV, gross tumour volume; IC, induction chemotherapy; PD, progressive disease; PF, cisplatin with fluorouracil; PR, partial response; SD, stable disease; TP, taxanes with cisplatin; TPF, taxanes plus cisplatin with fluorouracil.
The median duration of follow-up for the entire cohort was 62 months (range 2.5–142.5 months). The 5-year DFS, OS, DMFS and LRFS rates in the entire cohort were 78.0%, 91.9%, 87.8% and 90.5%, respectively.
Integrated model of GTV and IC response
An unsatisfactory tumour response (SD/PD) predicted poorer clinical outcomes than a satisfactory tumour response (CR/PR) at all endpoints (Supplemental Figure S1). Similarly, a large GTV after IC (GTV ⩾68 cm3) predicted poorer clinical outcomes than a small GTV after IC (GTV <68 cm3) at all endpoints. Multivariate analysis showed that IC response (SD + PD vs CR + PR: hazard ratio (HR): 1.77, 95% CI: 1.25–2.51, p = 0.001) and GTV after IC (<68 vs ⩾68 cm3: HR: 2.02, 95% CI: 1.39–2.95, p < 0.001) were independent prognostic factors for DFS (Table 2).
Multivariable analysis of prognostic factors.
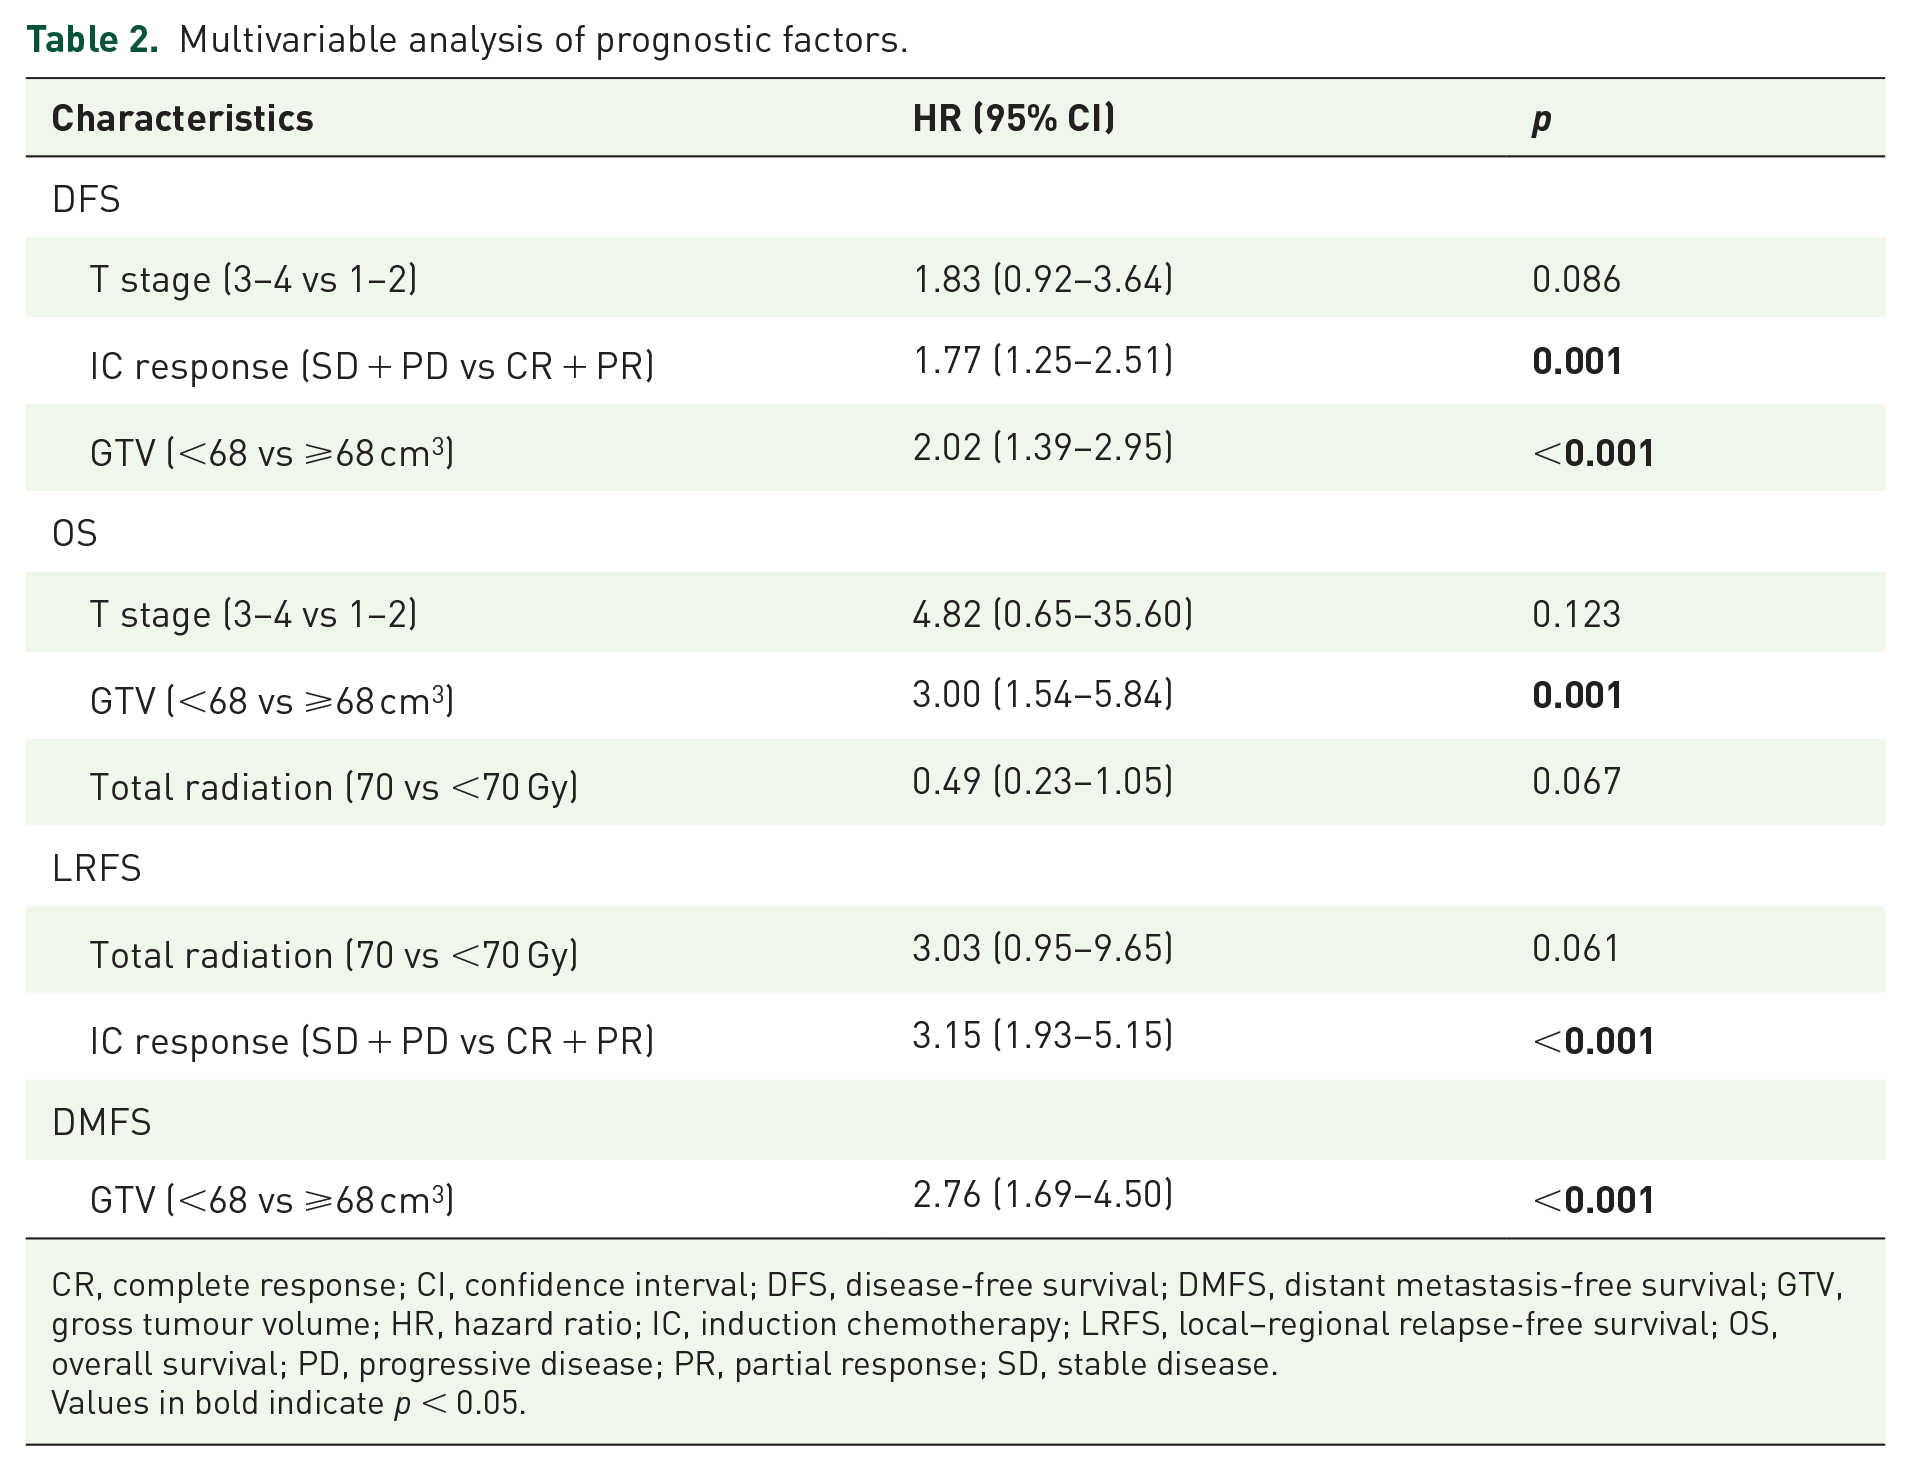
CR, complete response; CI, confidence interval; DFS, disease-free survival; DMFS, distant metastasis-free survival; GTV, gross tumour volume; HR, hazard ratio; IC, induction chemotherapy; LRFS, local–regional relapse-free survival; OS, overall survival; PD, progressive disease; PR, partial response; SD, stable disease.
Values in bold indicate p < 0.05.
To address the question of whether GTV plus IC response would be a more effective prognostic tool than either one alone, patients were classified into four groups as follows: Group A (GTV <68 cm3 and CR/PR), Group B (GTV ⩾68 cm3 and CR/PR), Group C (GTV <68 cm3 and SD/PD) and Group D (GTV ⩾68 cm3 and SD/PD). Multivariate analysis indicated that the new grouping was an independent and significant prognostic factor (Supplemental Table S1). The Kaplan–Meier survival curves showed that the survival rates at all endpoints of Group A were significantly higher than those of Groups B, C and D (all p < 0.05, Figure 1(a), Supplemental Figure S2(A)–(C)). Moreover, Group B had a higher 5-year DFS rate than Group D and a higher 5-year LRFS rate than Groups C and D (all p < 0.05). Further paired comparisons revealed no significant differences in survival rates at all endpoints between Groups C and D. Subsequently, Group A was classified as a low-risk subgroup (GTV <68 cm3 and CR/PR), Group B as an intermediate-risk subgroup (GTV ⩾68 cm3 and CR/PR) and Groups C and D as high-risk subgroups (any GTV and SD/PD). Patients in the low-risk group presented favourable survival outcomes, whereas those in the high-risk group presented poor outcomes at all endpoints (DFS: 88.6% vs 72.9% vs 65.6%, p < 0.001, Figure 1(b); OS: 97.2% vs 87.6% vs 87.1%, p < 0.001, Supplemental Figure S2(D); LRFS: 94.6% vs 91.7% vs 81.8%, p = 0.003, Supplemental Figure S2(E) and DMFS: 93.3% vs 83.7% vs 82.7%, p < 0.001, Supplemental Figure S2(F)).
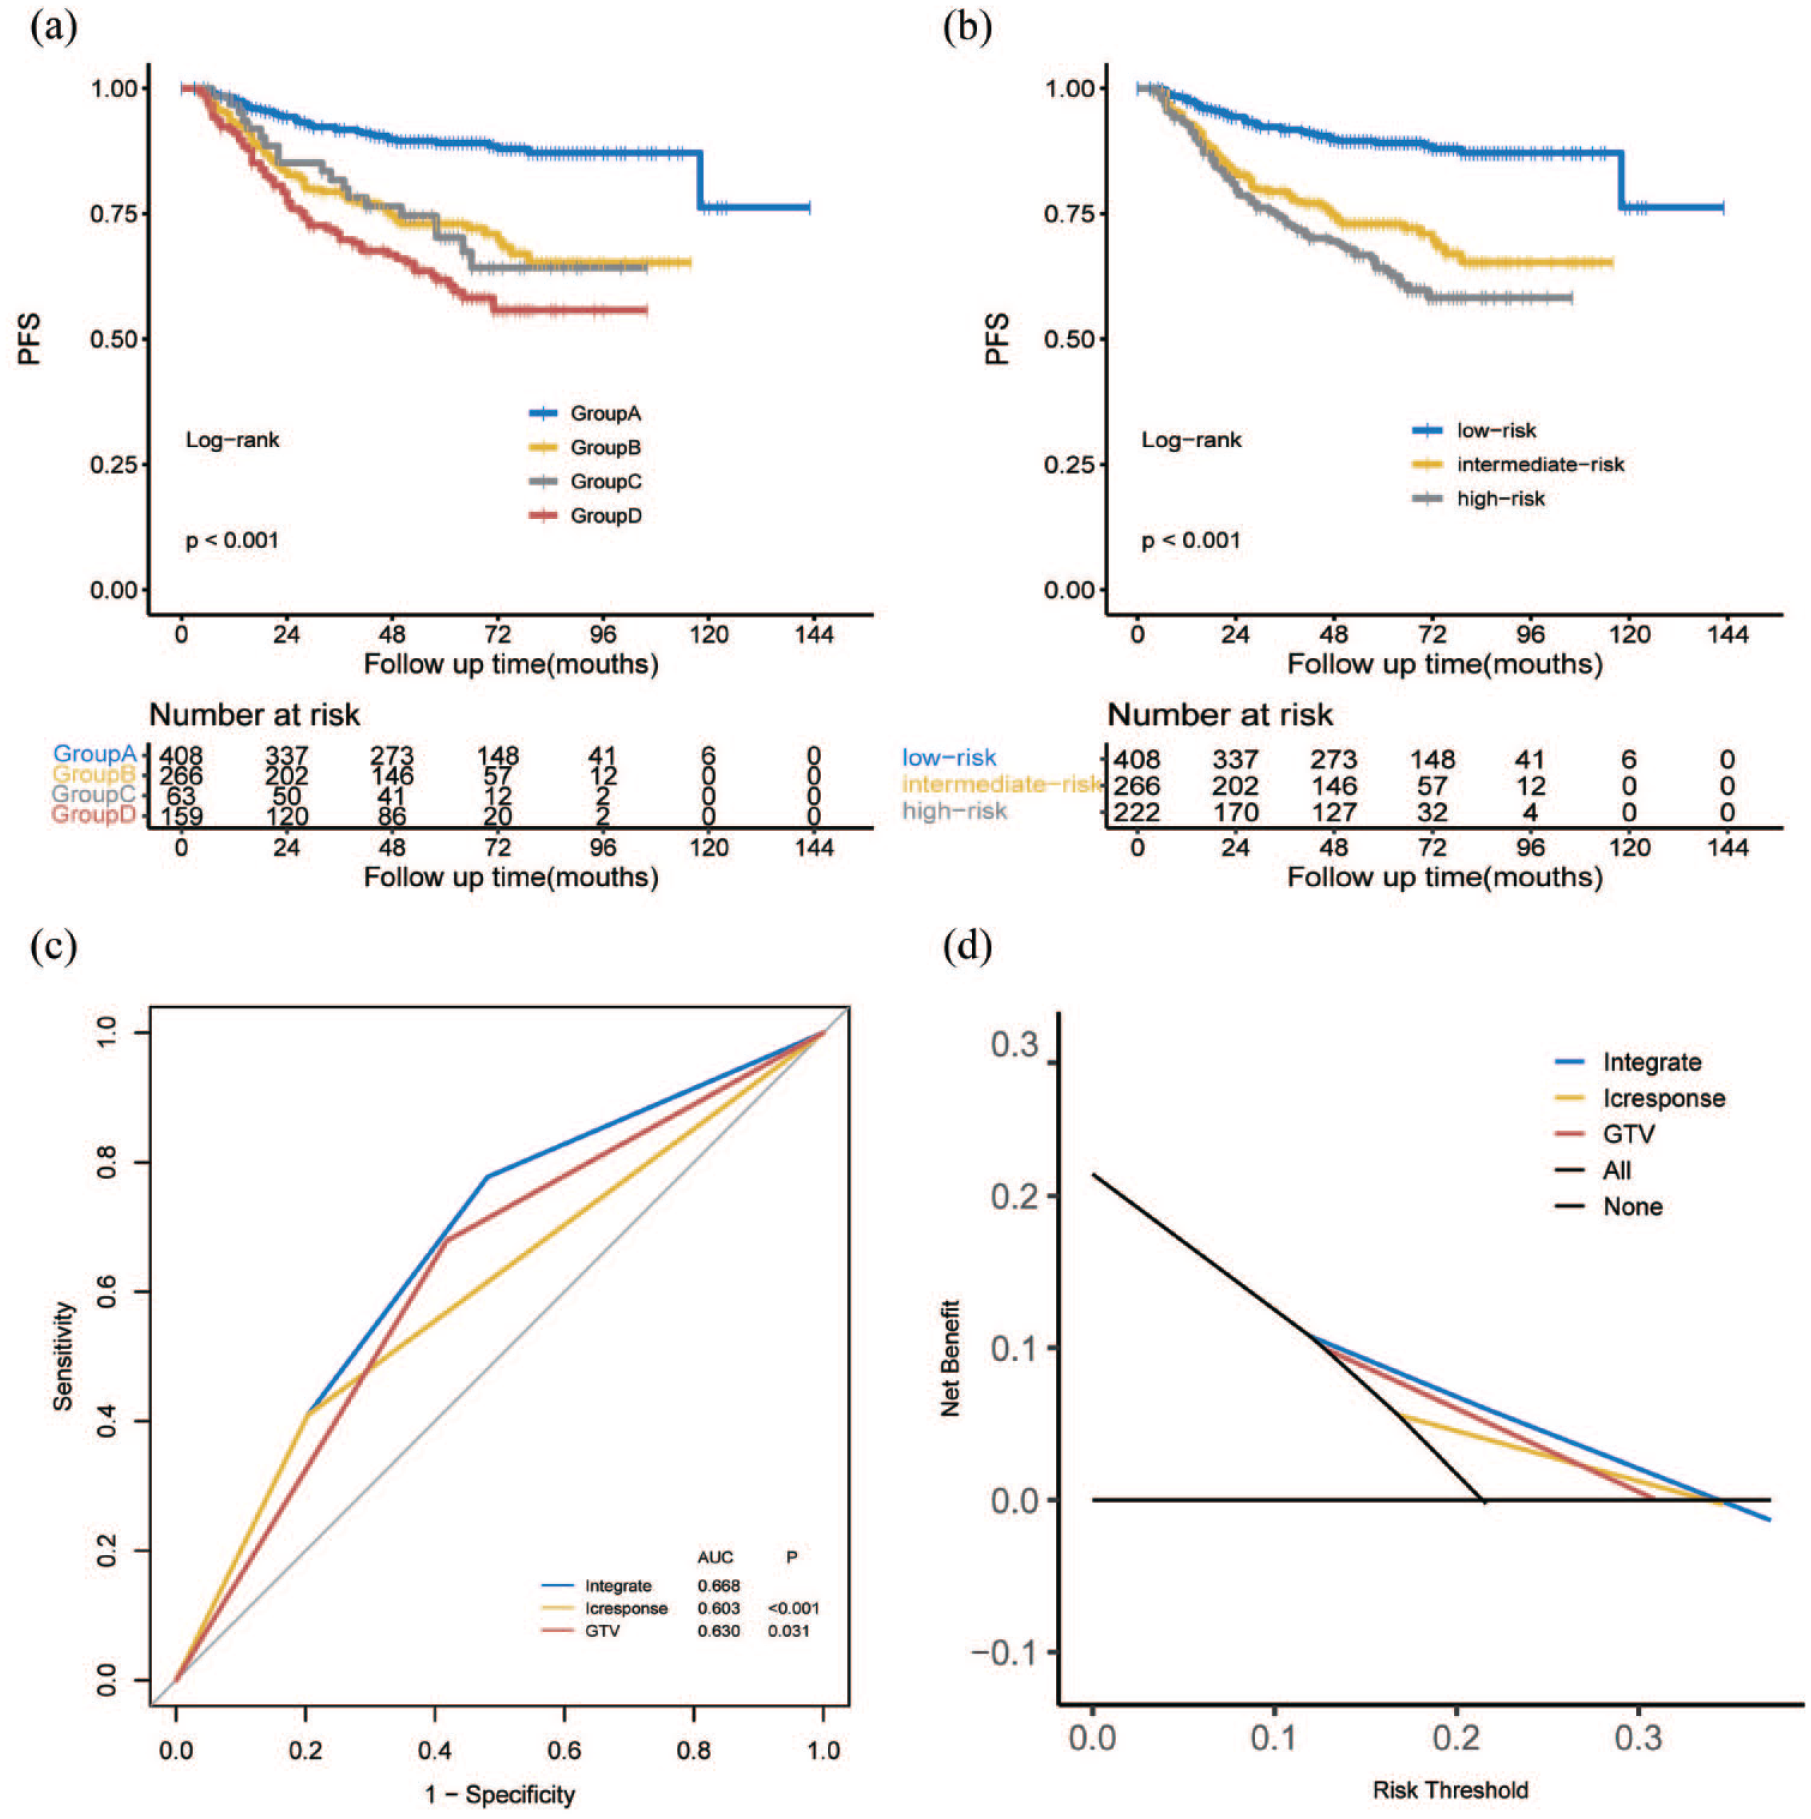
Kaplan–Meier curves for DFS (a and b) for 896 patients with NPC stratified into four prognostic groups and by different risk stratification. ROC curve (c) and decision curve (d) comparing the prediction of the integrated model with IC response and GTV after IC.
ROC curves were used to compare the prognostic validity of the integrated model, GTV and IC response. The AUC for DFS in all 896 patients was 0.630 for GTV and 0.603 for IC response and increased to 0.668 when these two factors were considered in the analysis (all p < 0.05, Figure 1(c)). In addition, DCA also demonstrated that the application of the integrated model to predict DFS provided a higher net benefit, suggesting its effectiveness in clinical decision-making (Figure 1(d)).
Prognostic significance of the integrated model for patients with different CCD
As patients in different risk subgroups exhibited different treatment failure rates, we comparatively evaluated the prognostic impact of CCD in this study. In the low-risk subgroup, the 5-year DFS rates were 94.9%, 88.6% and 86.5% (p = 0.621) in the low, medium and high CCD groups, respectively (Figure 2(a)). The analyses of OS, LRFS and DMFS showed similar outcomes: the survival rates of the low-CCD (<100 mg/m2) group were slightly higher than those of the high-CCD (>100 mg/m2) groups, but the difference was not statistically significant (Supplemental Figure S3(A)–(C)). We further compared the survival in patients treated with radiotherapy alone with those undergoing CCRT. After PSM, all 57 patients in the RT alone group were 1:1 matched with 57 patients in the CCRT group. The two groups were well-balanced according to pre-treatment EBV DNA, N stage, IC cycles and other variables (Supplemental Table S2). The 5-year DFS, OS, LRFS and DMFS for patients receiving RT alone or CCRT were 94.9% versus 87.0% (p = 0.749, Figure 3(a)), 100.0% versus 92.1% (p = 0.762, Figure 3(b)), 95.1% versus 94.4% (p = 0.919, Figure 3(c)) and 100.0% versus 92.4% (p = 0.145, Figure 3(d)), respectively. There was no significant difference in all endpoints between the two groups.

Kaplan–Meier curves for DFS with the groups stratified into CCD ⩽100 mg/m2, CCD 101–200 mg/m2 and CCD >200 mg/m2 in the low- (a), intermediate- (b)- and high-risk (c) groups.

Kaplan–Meier curves for DFS (a), OS (b), LRFS (c) and DMFS (d) with patients stratified into receiving RT alone and CCRT in the low-risk group.
In the intermediate-risk subgroup, patients receiving a medium CCD (101–200 mg/m2) showed higher 5-year DFS (81.1% vs 65.3%, p = 0.051) than patients receiving a CCD of ⩽100 mg/m2, and patients receiving a CCD of >200 mg/m2 displayed higher 5-year DFS rates (83.7% vs 65.3%, p = 0.027), than those receiving a CCD of ⩽100 mg/m2 (Figure 2(b)). The medium-dose group showed similar efficacy to the high-dose group for LRFS and OS in the intermediate-risk subgroup (Supplemental Figure S3(D)–(F)).
In addition, in the high-risk subgroup, the 5-year DFS, OS, LRFS and DMFS for patients receiving CCD <100 mg/m2, CCD = 101–200 mg/m2 and CCD >200 mg/m2 were 63.4% versus 63.4% versus 66.4%, 82.0% versus 88.5% versus 87.3%, 81.4% versus 80.8% versus 79.3% and 86.9% versus 80.8% versus 82.7%, respectively. The use of different CCDs did not result in significantly different survival outcomes (Figure 2(c), Supplemental Figure S3(G)–(I)).
In the multivariate analysis, CCD was an independent prognostic factor for DFS (>200 vs ⩽100 mg/m2: HR: 0.28, 95% CI: 0.10–0.79, p = 0.015; 101–200 vs ⩽100 mg/m2: HR: 0.28, 95% CI: 0.11–0.72, p = 0.008) and DMFS (>200 vs ⩽100 mg/m2: HR: 0.26, 95% CI: 0.08–0.82, p = 0.021; 101–200 vs ⩽100 mg/m2: HR: 0.15, 95% CI: 0.05–0.49, p = 0.001) in the intermediate-risk subgroup (Supplemental Table S3), but was not significantly associated with any survival outcome in the low- or high-risk subgroups.
Acute toxicity
We evaluated the occurrence of acute toxicity at the time when toxicity and side effects were most obvious during CCRT and compared this among different CCD groups. High CCD was significantly associated with increased incidence of leucocytopenia (all grades: 32.1% vs 87.4% vs 87.4%, p < 0.001; grade 3–4: 8.93% vs 17.9% vs 25.3%, p < 0.001), neutropenia (all grades: 39.9% vs 65.4% vs 72.5%, p < 0.001), anaemia (all grades: 50.6% vs 86.6% vs 84.1%, p < 0.001; grade 3–4: 3.57% vs 6.04% vs 11.50%, p = 0.007), thrombocytopenia (all grades: 13.7% vs 24.7% vs 30.2%, p = 0.001) and creatinine increase (all grades: 14.3% vs 29.5% vs 35.2%, p < 0.001) (Table 3). An intergroup analysis evaluating for the increase in the level of aspartate transaminase did not find any significant differences between the groups (p > 0.05).
Grade 1–4 acute toxicities due to CCRT between the three different CCD groups.

p values were calculated by Chi-square test.
p values were calculated using Fisher’s exact test.
Values in bold indicate p < 0.05.
ALT, alanine aminotransferase; AST, aspartate aminotransferase; CCD, cumulative cisplatin dose; CCRT, concurrent chemoradiotherapy.
Discussion
The results of this study illustrated that both tumour response to IC and GTV after IC were independent prognostic factors, which is consistent with the results of previous studies.13,15 In this study, ROC curves showed that the AUC for DFS increased when these two factors were incorporated, which was significantly higher than that when each was used separately. DCA curves also reflected that the integrated model was useful in clinical decision-making. These results suggest that the integrated model of GTV and IC response can be more effective in prognostic prediction. This reveals that it is one-sided to use tumour response or GTV separately, as patients with high tumour burden before treatment but satisfactory tumour response to IC, and patients with low tumour burden but poor IC response, may have similar GTV after IC; however, this does not mean that their outcomes are similar. To our knowledge, this is the first study to investigate the prognostic value of combining tumour response and GTV after IC and to develop an integrated model for individualised CCD for LANPC patients.
Previous studies10,11 have shown that CCD of >200 mg/m2 can significantly improve the prognosis of NPC. Li et al. 32 further suggested that 200 mg/m2 cisplatin could be an alternative treatment option for patients with low-risk LANPC. With the development and addition of IC, it is important to explore suitable low-risk subgroups of patients to receive appropriate de-escalation of CCRT. Therefore, after verifying the satisfactory value of the integrated model in risk stratification, we explored individualised CCD selection in different risk subgroups. We stratified patients sensitive to IC according to GTV after IC and identified a new low-risk subgroup (CR/PR and GTV <68 cm3). The survival rates of the CCD <100 mg/m2 group were slightly higher than those of 101–200 mg/m2 and >200 mg/m2 groups for low-risk patients but the difference was not statistically significant. Therefore, we further compared the survival in patients treated with radiotherapy alone with those undergoing CCRT and found that there was no significant difference between the two groups in all endpoints. Furthermore, our results show that high CCD significantly increased the cumulative toxicity of chemotherapy. Thus, CCRT was not superior to RT alone in terms of survival for patients with LANPC in the low-risk group. This indicates that patients with CR/PR after IC and a small tumour burden will attain a post-IC GTV that is sufficiently small. For these patients, increasing the CCD would not only fail to further improve their prognosis but also increase the cumulative toxicity of chemotherapy. As the evidence recommended by previous guidelines for CCRT mainly comes from clinical trial data during two-dimensional conventional radiotherapy, a multicentre prospective phase III clinical study explored whether patients with low-risk NPC still need CCRT with the development of IMRT. 33 The results showed that for patients in low risk, the survival of patients in the IMRT-alone group was similar to those of CCRT, with lower incidence of grade 3–4 adverse events and better quality of life. Chen et al. 34 similarly concluded that IC + IMRT group has similar 3-year survival rates to IC + CCRT group in patients with stage III–IV NPC. Based on these, we concluded that IC plus radiotherapy alone appears to be the optimal treatment for patients in the low-risk group in the IMRT era.
Moreover, we found that patients with intermediate risk (CR/PR but a GTV ⩾68 cm3) who received CCD >200 mg/m2 and 101–200 mg/m2 exhibited higher 5-year DFS rates than patients who received CCD <100 mg/m2. 101–200 mg/m2 had similar efficacy to >200 mg/m2, but with fewer grade 1–4 acute toxicities. Previous studies35,36 suggested that CCD >200 mg/m2 increased survival in patients with large tumour despite increasing treatment-related toxicity. These results are consistent with ours, which suggests that an increased CCD could provide a survival benefit for patients sensitive to chemotherapy with large tumour burden. However, our results suggest that it is not necessary to give a dose of cisplatin higher than 200 mg/m2 for these patients. While increasing CCD improves their prognosis, it also increases the cumulative toxicity of chemotherapy. Therefore, balancing toxicity and efficacy, 200 mg/m2 seems to be the optimal CCD dose in the intermediate-risk group.
In this study, we also found that there was no statistically significant difference in the prognosis of patients who received different CCDs in the high-risk group (SD/PD, GTV >68 or ⩽68 cm3). Our results indicated that increasing CCD could not improve prognosis in IC-nonresponsive patients, even if they have a huge tumour burden. This is consistent with our previous reports that IC response could be a valuable factor informing treatment options of NPC patients. 13 While other studies only focused on the impact of pure tumour burden on the benefit of CCD,17,36 our study proved that the combined use of IC response with tumour burden can better inform the use of CCD. Moreover, this study suggests that patients who received SD/PD after IC but with a small GTV that is clinically overlooked may still experience more treatment failure, especially relapse (Supplemental Figure S2, Supplemental Table S4). Previous studies have elaborated on the molecular mechanisms by which patients develop resistance to anti-cancer drugs, which may help to further understand this relationship. Studies have shown that increased expression of ANX-I, ATP-binding cassette (ABC) and Jab1/CSN5 was significantly associated with drug resistance and poor prognosis in NPC patients treated with cisplatin-based concurrent chemotherapy.37–39 Therefore, it is necessary to choose more appropriate concurrent treatment for patients in high-risk groups. It has been suggested that the combination of drugs with different mechanisms of action during the concurrent phase of radiotherapy may help eliminate these resistant clones. In recent years, there have been many related studies on the application of anti-epidermal growth factor receptor (EGFR) therapies such as cetuximab and nimotuzumab for locally advanced NPC.40–43 Wang et al. 44 found that cetuximab plus CCRT improved the CR (relative risk (RR) = 1.92, 95% CI: 1.61–2.30), reduced SD/PD (SD: RR = 0.67, 95% CI: 0.51–0.88; PD: RR = 0.24, 95% CI: 0.15–0.40), and improved the survival rates at all endpoints in NPC patients. Besides, there are also related studies on the application of immunotherapy with chemoradiotherapy.45–48 The latest study of Liu et al. 49 shown that the addition of sintilimab (200 mg intravenously once every 3 weeks for 12 cycles) to chemoradiotherapy improved event-free survival in LANPC (86% (95% CI: 81–90) vs 76% (70–81), p = 0.019). Our centre and other medical centres are conducting clinical trials of combining immune checkpoint inhibitors in the concurrent or adjuvant phase to further improve outcomes (CinicalTrials.gov identifiers: NCT04072107, NCT03427827, NCT03267498; ChiCTR2100042602). In conclusion, increasing CCD does not benefit patients in the high-risk group, and treatment options for these patients, such as the addition of targeted agents or immunotherapy, require further exploration.
This study has several limitations. First, as this was a retrospective study, there was an inevitable selection bias. Second, as this was a single-centre study, these results must be validated using other datasets. Third, the number of patients undergoing radiotherapy alone was insufficient and some confounding factors could not be fully matched between groups even using PSM. Furthermore, EBV DNA was not included in the integrated model because there remains no standard for its determination or reference range. Future research should focus on improvements based on these aspects.
Conclusion
The integrated model incorporating IC response and GTV after IC demonstrates satisfactory value in risk stratification and the potential to guide individualised decision-making in CCD selection. Balancing toxicity and efficacy, RT alone seems to be the optimal treatment for patients in low-risk groups and 200 mg/m2 might be the optimal dose for intermediate-risk groups. Moreover, increasing CCD does not benefit patients in high-risk groups, and treatment options for these patients require further consideration.
Supplemental Material
sj-docx-1-tam-10.1177_17588359241286222 – Supplemental material for Individualised cumulative cisplatin dose for locoregionally advanced nasopharyngeal carcinoma patients based on induction chemotherapy response and tumour volume
Supplemental material, sj-docx-1-tam-10.1177_17588359241286222 for Individualised cumulative cisplatin dose for locoregionally advanced nasopharyngeal carcinoma patients based on induction chemotherapy response and tumour volume by Jie-Yi Lin, Zi-Jian Lu, Su-Chen Li, Dong-Hua Luo, Ting Liu, Wan-Ru Zhang, Zhen-Chong Yang, Hao-Yuan Mo, Hai-Qiang Mai and Sai-Lan Liu in Therapeutic Advances in Medical Oncology
Supplemental Material
sj-docx-2-tam-10.1177_17588359241286222 – Supplemental material for Individualised cumulative cisplatin dose for locoregionally advanced nasopharyngeal carcinoma patients based on induction chemotherapy response and tumour volume
Supplemental material, sj-docx-2-tam-10.1177_17588359241286222 for Individualised cumulative cisplatin dose for locoregionally advanced nasopharyngeal carcinoma patients based on induction chemotherapy response and tumour volume by Jie-Yi Lin, Zi-Jian Lu, Su-Chen Li, Dong-Hua Luo, Ting Liu, Wan-Ru Zhang, Zhen-Chong Yang, Hao-Yuan Mo, Hai-Qiang Mai and Sai-Lan Liu in Therapeutic Advances in Medical Oncology
Supplemental Material
sj-docx-3-tam-10.1177_17588359241286222 – Supplemental material for Individualised cumulative cisplatin dose for locoregionally advanced nasopharyngeal carcinoma patients based on induction chemotherapy response and tumour volume
Supplemental material, sj-docx-3-tam-10.1177_17588359241286222 for Individualised cumulative cisplatin dose for locoregionally advanced nasopharyngeal carcinoma patients based on induction chemotherapy response and tumour volume by Jie-Yi Lin, Zi-Jian Lu, Su-Chen Li, Dong-Hua Luo, Ting Liu, Wan-Ru Zhang, Zhen-Chong Yang, Hao-Yuan Mo, Hai-Qiang Mai and Sai-Lan Liu in Therapeutic Advances in Medical Oncology
Footnotes
References
Supplementary Material
Please find the following supplemental material available below.
For Open Access articles published under a Creative Commons License, all supplemental material carries the same license as the article it is associated with.
For non-Open Access articles published, all supplemental material carries a non-exclusive license, and permission requests for re-use of supplemental material or any part of supplemental material shall be sent directly to the copyright owner as specified in the copyright notice associated with the article.