
Abstract
Objective:
To investigate whether pre-treatment and middle-treatment plasma Epstein–Barr virus (EBV) DNA loads are useful predictors of prognosis and indicators of therapy modification in nasopharyngeal carcinoma (NPC) patients undergoing radical concurrent chemoradiotherapy (CCRT).
Methods:
Plasma EBV DNA load was measured by quantitative polymerase chain reaction before treatment (pre-DNA) and during the second cycle of DDP (mid-DNA). The primary endpoint was 5-year progression-free survival (PFS).
Results:
A total of 775 NPC patients treated with CCRT were included. In total, 553 patients with pre-DNA <4000 copies/mL and 222 with ⩾4000 copies/mL. A total of 559 patients had mid-DNA undetectable and 216 had detectable. Multivariate analysis showed that pre- and mid-DNA were independent prognostic predictors of PFS [hazard ratio (HR), 2.035; 95% confidence interval (CI), 1.406–2.944; p < 0.001; HR, 1.597; 95% CI, 1.101–2.316; p = 0.014]. The area under the curve of the combination of pre-DNA and mid-DNA for 5-year PFS was higher than that of pre-DNA, mid-DNA, and tumor node metastasis (TNM) stage (0.679 versus 0.622, 0.608, 0.601). In the low-risk group (pre-DNA <4000 copies/mL and undetectable mid-DNA), patients receiving ⩽200 mg/m2 showed similar efficacy as those receiving >200 mg/m2 cumulative cisplatin dose (CCD) but were associated with fewer all-grade late toxicities. However, in the high-risk group (pre-DNA ⩾4000 copies/mL or detectable mid-DNA), patients receiving >200 mg/m2 CCD showed a higher 5-year PFS (73.1% versus 58.6%, p = 0.027) and locoregional relapse-free survival (88.5% versus 76.1%, p = 0.028) than those receiving ⩽200 mg/m2 CCD.
Conclusion:
The combination of pre-DNA and mid-DNA could be particularly useful for guiding risk stratification and early treatment modification for NPC treated with CCRT. A total of 200 mg/m2 cisplatin seemed to be the optimal dose for the low-risk patients, while >200 mg/m2 cisplatin may be adequate to achieve satisfactory survival outcomes in the high-risk group.
Introduction
Nasopharyngeal carcinoma (NPC) is an endemic malignancy in South China.1,2 Despite advances in treatment modalities and techniques, 20–30% of patients experience distant metastasis or locoregional relapse. 3 Cisplatin (DDP)-based concurrent chemoradiotherapy (CCRT) with or without induction chemotherapy (IC) or adjuvant chemotherapy (AC) has been recommended as the fundamental treatment for stage II–IVa NPC by the National Comprehensive Cancer Network guidelines. 4 Cisplatin administered at 100 mg/m2 every 3 weeks is the standard regimen for CCRT. Many previous studies have indicated that a cumulative cisplatin dose (CCD) of 200 mg/m2 can significantly improve the prognosis of NPC.5 –8 Nevertheless, owing to the tumor heterogeneity, the survival benefit of intensity of concurrent DDP remains inconclusive in NPC, particularly for patients with a high risk of recurrence.9,10 Therefore, developing reliable methods to detect progression at an early stage may help identify high-risk patients who could benefit from intensive doses of DDP.
Plasma Epstein–Barr virus (EBV) DNA is the most useful biomarker for prognostication, predicting treatment response, and disease surveillance.11,12 Many previous studies have reported NPC patients with high levels of EBV DNA before treatment (pre-DNA) and detectable EBV DNA after radiotherapy (RT) completion (post-DNA) have a high risk of recurrence and distant metastasis.12,13 Recently, with increasing evidence demonstrating that EBV DNA load at treatment midcourse is a significant predictor of clinical outcome and an indicator for AC, prognostication has shifted from post-RT to completion of IC.14,15 Unlike patients who receive IC, mid-RT instead of IC completion EBV DNA may be a suitable time point for early outcome prediction among NPC patients treated with definitive CCRT.16,17 However, the EBV DBA load shows dynamic changes, and estimating the risk of treatment failure with EBV DNA at a single time point may be unreliable. Therefore, the prognostic value of the combination of different time points of EBV DNA is worth investigating.
In this study, we aimed to compare the prognostic value of pre-DNA and mid-DNA levels in NPC patients treated with DDP-based CCRT. We then combined pre-DNA and mid-DNA to construct risk stratification. Furthermore, a subgroup analysis was conducted to compare the therapeutic value of CCD in different risk groups. Our findings could help clinicians to better predict NPC prognosis and guide treatment strategies for these patients.
Patients and methods
Patients
A total of 775 patients with locally advanced NPC who underwent treatment at Sun Yat-sen University Cancer Center between 2012 and 2018 were included in our study. The eligibility criteria were as follows: (1) pathologically confirmed NPC at stage II–IVa according to the eighth edition of the International Union Against Cancer/American Joint Committee on Cancer TNM staging system; (2) treatment with intensity-modulated radiotherapy (IMRT) and received DDP dose of 100 mg/m² every 3 weeks concurrent chemotherapy regimen; (3) complete data of plasma EBV DNA load measured by quantitative polymerase chain reaction (PCR) before treatment and second-cycle DDP; (4) no pregnant women, lactating women or suffering from prior/concurrent second primary malignant tumors; and (5) adequate organ function. The study flowchart is presented in Figure 1. All included patients underwent complete physical examination, EBV serology, electrocardiography, fiberoptic nasopharyngoscopy, nasopharyngeal and neck magnetic resonance imaging, chest radiography/tomography (CT), abdominal sonography/CT, bone scan, or whole-body fluorodeoxyglucose positron emission tomography.

Flowchart for patient selection.
Real-time quantitative EBV DNA
Peripheral venous blood (5 mL) was collected before treatment and before the second cycle of DDP. Plasma EBV DNA loads were routinely measured by real-time quantitative PCR. The details of the assay have been published previously. 18 The cutoff value of the pre-DNA level was previously established (4000 copies/mL), 13 whereas the cutoff value of the mid-DNA level was based on a detectable/undetectable status (0 copies/mL).16,19
Treatment
All the patients were treated with DDP-based CCRT. RT was delivered using IMRT. The prescribed radiation doses for planning target volume (PTV)nx, PTVnd, PTV1, and PTV2 were 68–72, 64–70, 60–64, and 50–54 Gy, respectively, in 30–33 fractions, delivered daily at five fractions per week over 6–7 weeks. DDP was administered at 100 mg/m² every 3 weeks during RT. Concurrent targeted therapy consisted of cetuximab (400 mg/m2 for week 1 and 250 mg/m2 weekly thereafter) or nimotuzumab (200 mg weekly) throughout IMRT weekly for five–six cycles.
Outcome and follow-up
Our primary endpoint was progression-free survival (PFS), which was calculated from the start of treatment to the date of disease progression or death from any cause. The secondary endpoints were distant metastasis-free survival (DMFS) (defined as the period from the first therapy to the date of distant metastasis), locoregional relapse-free survival (LRRFS) (defined as the time from the first day of first therapy to the date of local/regional relapse), and overall survival (OS) (defined as the period from the first day of first therapy to the date of death from any cause). After completing treatment, physical examination, nasopharyngoscopy, chest radiography, abdominal sonography, magnetic resonance imaging (MRI) of the head and neck, and plasma EBV DNA testing were performed every 3–6 months in the first 3 years, and then every 6 months thereafter until death. Late toxicities were recorded according to items from the Radiation Therapy Oncology Group.
Statistical analysis
Categorical variables of the different subgroups were compared using the χ2 (chi-square) or Fisher’s exact test. Survival curves were estimated using the Kaplan–Meier method with the log-rank test. The Cox proportional hazards regression model was used to analyze prognostic factors for survival (backward stepwise). All the potential prognostic factors were considered in the model (age, gender, T stage, N stage, CCD, pre-DNA, mid-DNA, pre-DNA + mid-DNA). Receiver operating characteristic (ROC) curve analysis and concordance index (C-index) were performed to compare the prognostic value of the TNM stage, pre-DNA, mid-DNA, and the combination of pre-DNA and mid-DNA. All statistical analyses in our study were performed using R version 4.0.2 (https://www.r-project.org/, Austria) and SPSS 26.0 software (IBM, Chicago, USA). p values < 0.05 were considered significant.
Results
Patient characteristics
The median age of the 775 patients was 45 (range, 13–74) years, with 212 (27.4%) females and 563 (72.6%) males. Among all patients, 553 (71.4%) had pre-DNA <4000 copies/mL and 222 (28.6%) had ⩾4000 copies/mL. A total of 559 (72.1%) patients had undetectable mid-DNA and 216 (27.9%) had detectable mid-DNA. Only 42 (5.42%) patients received concurrent target RT (cetuximab or nimotuzumab) throughout IMRT. The differences in demographics and clinical characteristics between the different DNA-level groups are shown in Table 1. The χ2 test showed higher pre-DNA and detectable mid-DNA were significantly associated with advanced N category and TNM stage (p < 0.001). In addition, patients with pre-DNA ⩾4000 copies/mL and detectable mid-DNA were more likely to receive a high CCD dose (>200 mg/m2).
Clinical characteristics (n = 775).
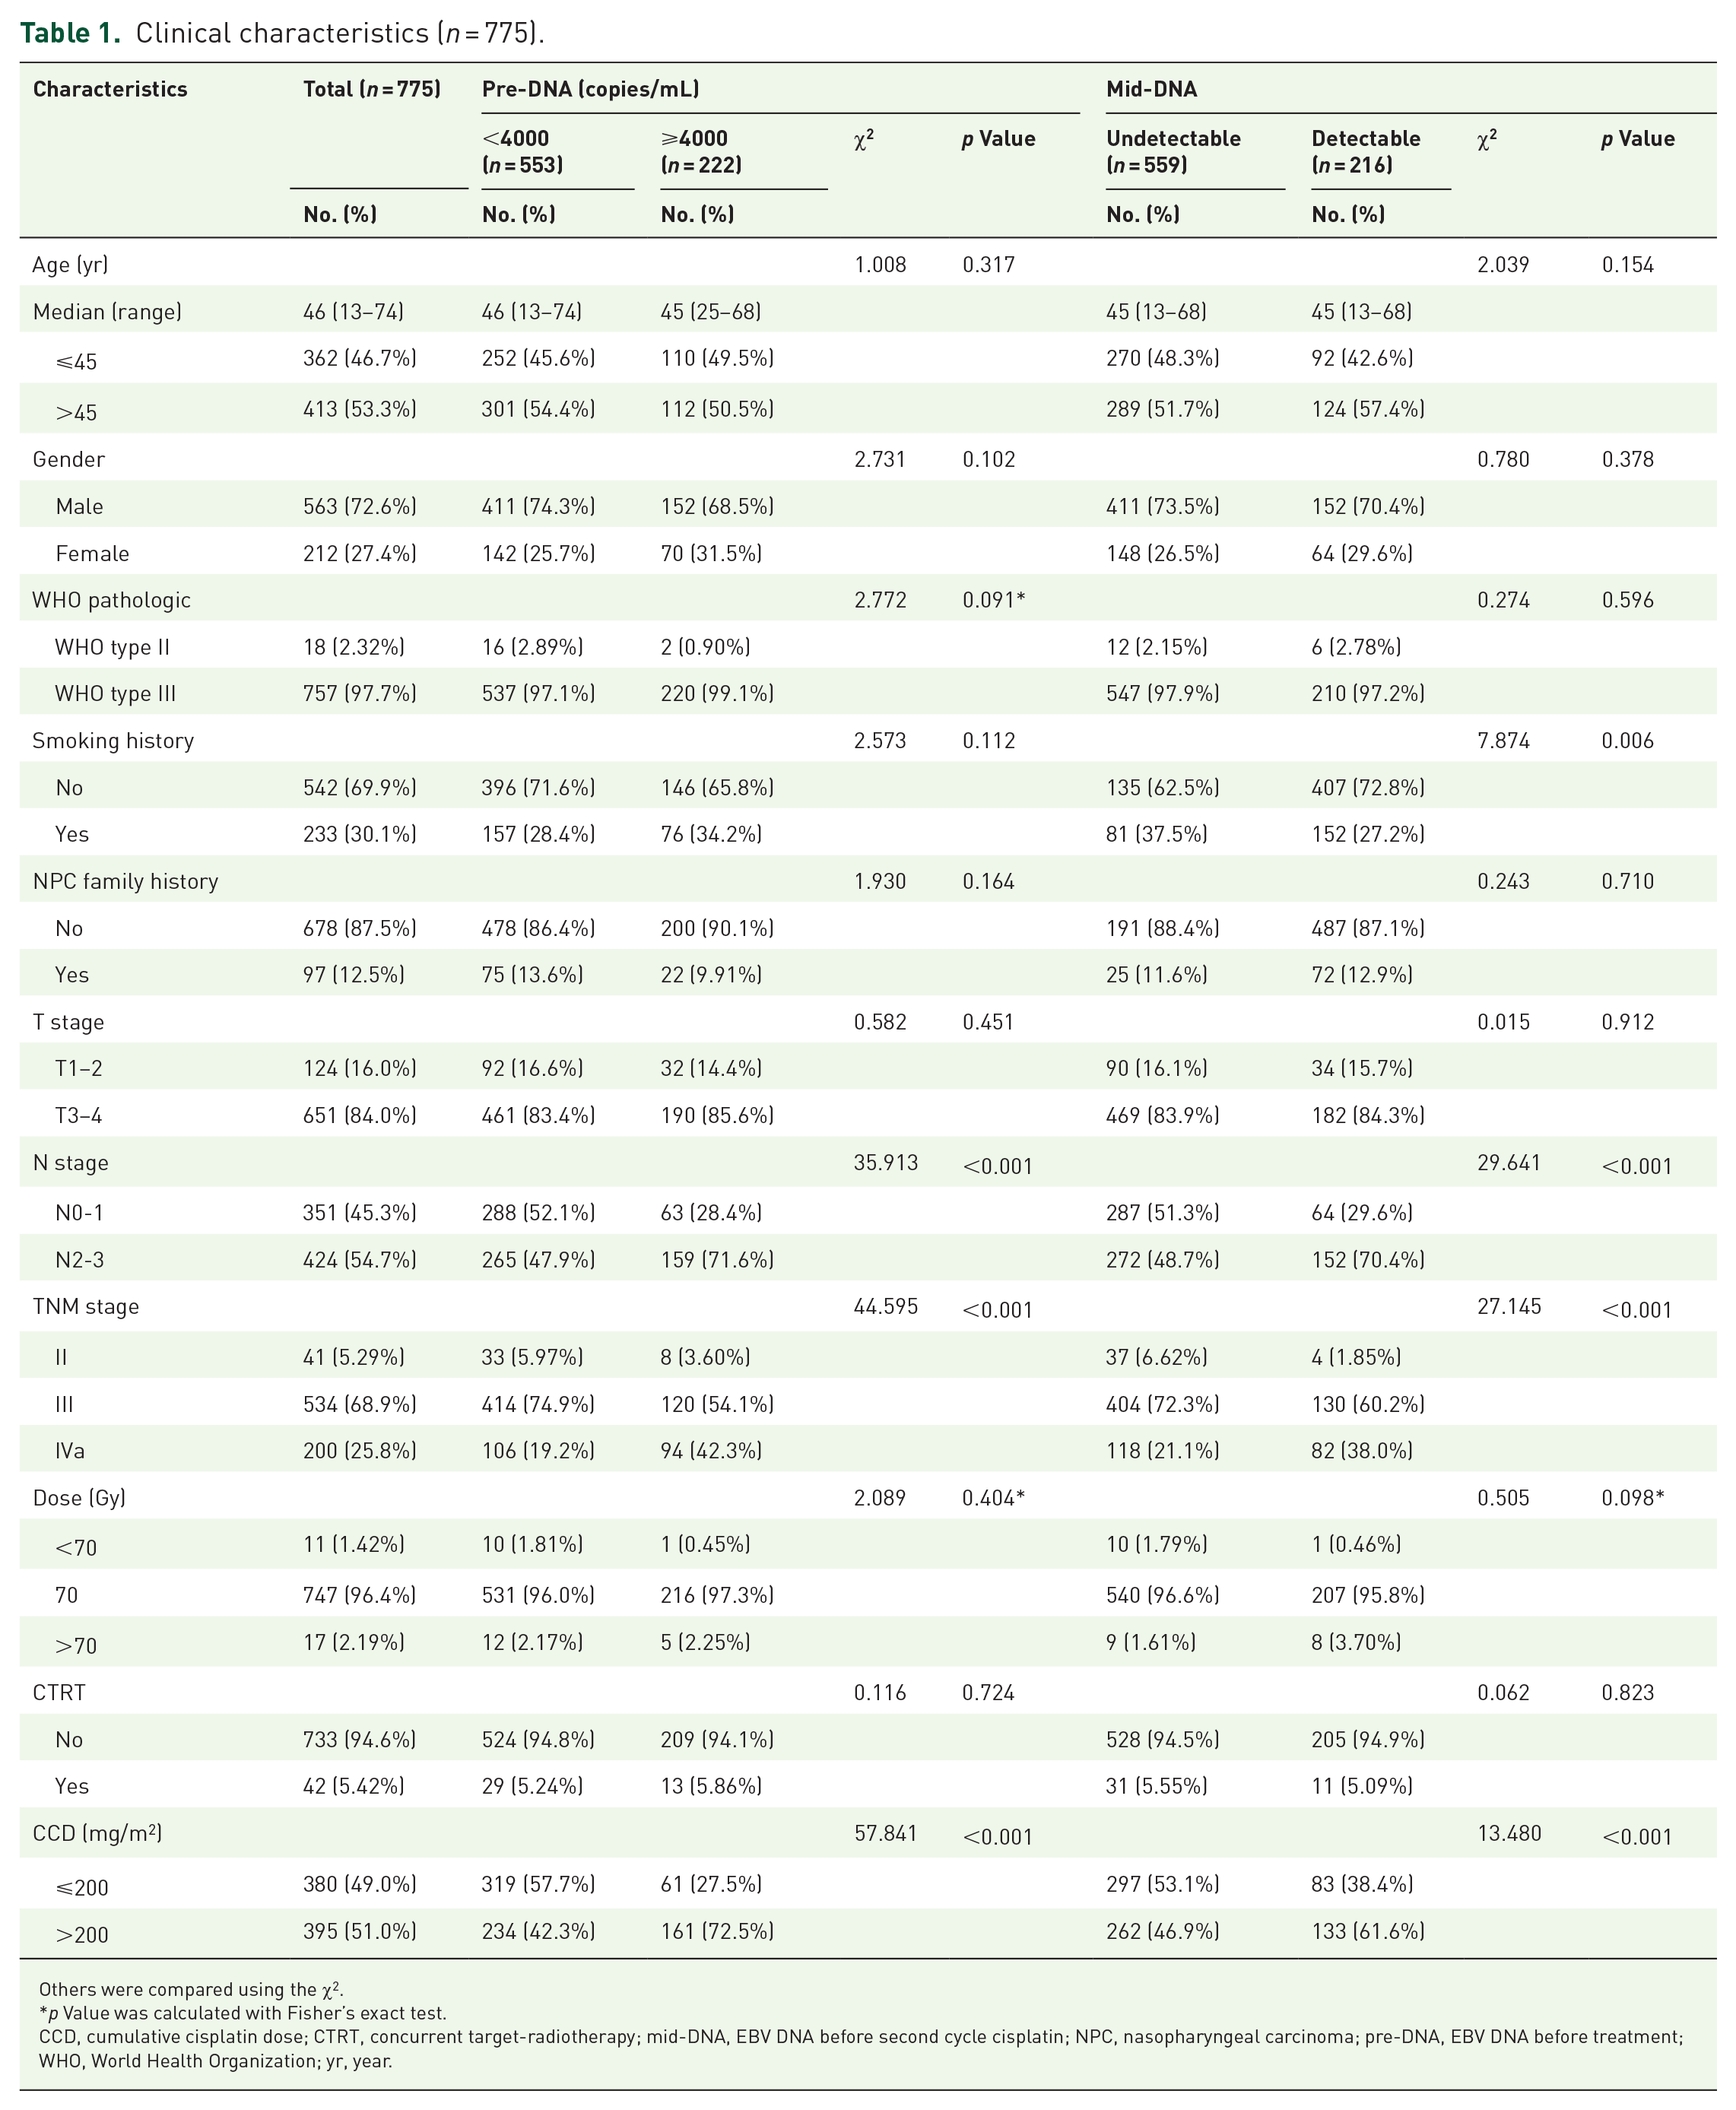
Others were compared using the χ2.
p Value was calculated with Fisher’s exact test.
CCD, cumulative cisplatin dose; CTRT, concurrent target-radiotherapy; mid-DNA, EBV DNA before second cycle cisplatin; NPC, nasopharyngeal carcinoma; pre-DNA, EBV DNA before treatment; WHO, World Health Organization; yr, year.
Prognostic value of pre-DNA and mid-DNA on survivals
The median follow-up time was 51.6 months (range, 3.6–119 months). A total of 34 patients (4.4%) had died and 134 (17.3%) with disease progression during follow-up. As shown in Figure 2, patients with higher pre-DNA (⩾4000 copies/mL) had significant inferior 5-year PFS (67.0% versus 85.4%, p < 0.001), DMFS (78.5% versus 93.5%, p < 0.001), and OS (89.4% versus 96.7%, p < 0.001) but not LRRFS (85.7% versus 91.2%, p = 0.062) compared with those with lower pre-DNA (<4000 copies/mL). In addition, detectable mid-DNA had significantly inferior 5-year PFS (68.2% versus 84.4%, p < 0.001), DMFS (82.4% versus 91.8%, p = 0.001), and LRRFS (83.0% versus 92.0%, p = 0.003) but not OS (93.5% versus 95.2%, p = 0.171), compared to those undetectable mid-DNA. As shown in Table 2, the following variables were considered in the Cox proportional hazards model: age, gender, T stage, N stage, pre-DNA, and mid-DNA. Multivariate analysis showed that pre-DNA was a significant predictor of PFS [hazard ratio (HR), 2.242; 95% confidence interval (CI), 1.532–3.281; p < 0.001], DMFS (HR, 2.990; 95% CI, 1.799–4.969; p < 0.001), and OS (HR, 4.118; 95% CI, 1.938–8.751; p < 0.001), whereas mid-DNA was the significant predictors of PFS (HR, 1.652; 95% CI, 1.138–2.399; p = 0.008) and LRRFS (HR, 1.965; 95% CI, 1.144–3.374; p = 0.014). In addition, we found that mid-DNA had significantly interacted with pre-DNA (Supplemental Figure S1). For patients with pre-DNA <4000 and ⩾4000 copies/mL, the probabilities of detectable mid-DNA were 108 of 553 and 108 of 222, respectively (19.5% versus 48.6%, p < 0.001). Moreover, patients with pre-DNA <4000 copies/mL and undetectable mid-DNA had significantly better PFS (88.2% versus 67.2%, p < 0.001), DMFS (95.3% versus 81.0%, p < 0.001), OS (97.0% versus 91.5%, p < 0.001), and LRRFS (93.8% versus 83.5%, p < 0.001) than the subgroup with detectable mid-DNA or pre-DNA ⩾4000 copies/mL (Figure 3).

Kaplan–Meier for PFS, DMFS, LRRFS, and OS for all 775 patients with NPC stratified by pre-DNA (<4000 versus ⩾4000 copies/mL; a–d) and mid-DNA (undetectable versus detectable; e–h).
Multivariable analysis of prognostic factors.

CI, confidence interval; DMFS, distant metastasis-free survival; HR, hazard ratio; LRRFS, locoregional relapse-free survival; OS, overall survival; PFS, progression-free survival.

Kaplan–Meier for PFS (a), DMFS (b), LRRFS (c), and OS (d) between the high- and low-risk groups.
Next, we compared the performance of pre-DNA and mid-DNA for prognostication. The area under the ROC curves (AUC) is shown in Figure 4. The AUC for combination of pre-DNA and mid-DNA was greater than that for pre-DNA, mid-DNA and TNM stage for predicting 5-year PFS (0.679 versus 0.622, 0.608, 0.601; p = 0.105, p = 0.004, p = 0.024, respectively) and DMFS (0.694 versus 0.654, 0.608, 0.599; p = 0.005, p = 0.002, p = 0.014, respectively). However, AUC for a combination of pre-DNA and mid-DNA compared to pre-DNA alone for predicting 5-year PFS was non-significant (0.679 versus 0.622, p = 0.105). The comparison of the C-index of risk stratification with the TNM stage is listed in Supplemental Table S1. The C-index of a combination of pre-DNA and mid-DNA in predicting PFS was 0.642, which was significantly higher than that for the TNM stage, with values of 0.558 (p < 0.001). Similarly, the C-index for DMFS and LRRFS prediction was 0.668 and 0.602 based on the combination of pre-DNA and mid-DNA, which was significantly higher than the C-index by TNM stage, with a value of 0.568 and 0.537 (p < 0.001, p = 0.040, respectively). However, the predictive value of the combination of pre-DNA and mid-DNA on OS is lower than that of the TNM stage.

ROC analysis comparing the prognostic value of pre-DNA, mid-DNA, the combination of pre-DNA and mid-DNA, and TNM stage in 5-year progression (a), 5-year metastasis (b), 5-year locoregional failure (c), and 5-year death (d).
Subgroup analysis for whole patients based on risk stratification
Accordingly, we divided the patients into low-risk (pre-DNA <4000 copies/mL and undetectable mid-DNA) and high-risk groups (pre-DNA ⩾4000 copies/mL or detectable mid-DNA) groups. The patient characteristics according to the risk group are listed in Supplemental Table S2. There were 445 (57.4%) and 330 (42.6%) patients in the low- and high-risk groups, respectively. Further multivariate analysis also showed that the combination of pre-DNA and mid-DNA was an independent prognostic factor (Supplemental Table S3).
In the entire cohort, we found CCD was an independent prognostic factor for PFS. We then evaluated the prognostic impact of CCD in two subgroups. The median CCD was 200 mg/m2 in the low-risk group and 280 mg/m2 in the high-risk group, respectively. Because CCD of 200 mg/m2 was the threshold for achieving satisfactory survival in the published data, we used CCD of 200 mg/m2 as the cutoff value. In the low-risk group, 262 (58.9%) patients received CCD of ⩽200 mg/m2, and 183 (41.1%) patients received CCD of >200 mg/m2. Patients receiving CCD of >200 mg/m2 and ⩽200 mg/m2 had similar 5-year PFS (88.3% versus 88.6%, p = 0.753), DMFS (96.4% versus 94.5%, p = 0.312), LRRFS (94.8% versus 93.2%, p = 0.772), and OS (96.3% versus 95.8%, p = 0.364). Notably, most patients (226/262, 86.2%) in the ⩽200 mg/m2 CCD subgroups received a DDP dose of 200 mg/m2. However, in the high-risk group, 118 (35.8%) patients received CCD of ⩽200 mg/m2 and 212 (64.2%) patients received CCD of >200 mg/m2. Patients receiving CCD of >200 mg/m2 showed improved 5-year PFS (73.1% versus 58.6%, p = 0.027) and LRRFS (88.5% versus 76.1%, p = 0.028) than those receiving CCD ⩽200 mg/m2 (Figure 5). Moreover, CCD was an independent prognostic factor for PFS (HR, 1.570, 95% CI, 1.031–2.391, p = 0.036) in the high-risk group, whereas it was not significantly associated with any survival outcome in the low-risk group (Table 3).

Kaplan–Meier for PFS (a), DMFS (b), LRRFS (c), and OS (d) curves for 445 NPC patients stratified by CCD ⩽200 and >200 mg/m2 in a low-risk group. PFS (e), DMFS (f), LRRFS (g), and OS (h) curves for 330 NPC patients stratified by CCD ⩽200 and >200 mg/m2 in the high-risk group.
Summary of multivariate analysis of prognostic factors in high- and low-risk groups.

CCD, cumulative cisplatin dose; CI, confidence interval; DMFS, distant metastasis-free survival; HR, hazard ratio; LRRFS, locoregional relapse-free survival; OS, overall survival; PFS, progression-free survival.
No patients dead in stage T1-2 patients.
Late radiation-related toxicity
Data from 436 patients were excluded owing to missing or inadequate documentation. Regarding late toxicities, dry mouth was the most common chief complaint during patients’ routine follow-up visits among all late radiation-related toxicities (243 patients; 71.7%). In addition, 188 patients (55.5%) had hearing impairment and 85 (25.1%) developed skin fibrosis. No treatment-related deaths occurred in either of the groups. In addition, patients receiving >200 mg/m2 CCD exhibited a higher proportion of peripheral neuropathy (18.3% versus 8.24%, p = 0.006) and a marginally higher proportion of all-grade hearing impairment (59.8% versus 51.2%, p = 0.114), dry mouth (75.1% versus 68.2%, p = 0.161), and skin fibrosis (29.6% versus 20.6%, p = 0.058) than those receiving ⩽200 mg/m2 CCD. However, the incidence of grade 3–4 late toxicities was comparable between the two groups (Table 4).
Major late adverse events.

p Values were calculated using the Fisher test.
CCD, cumulative cisplatin dose.
Discussion
Based on a relatively large number of patients, we found that both pre-DNA and mid-DNA were powerful predictors of clinical outcomes in NPC patients treated with CCRT. Patients with pre-DNA <4000 copies/mL and undetectable mid-DNA showed a better prognosis than those with other combinations. ROC analysis demonstrated that the calculated AUC for 5-year PFS and DMFS of the combination of pre-DNA and mid-DNA had a better prognostic value than the TNM stage. Accordingly, we identified pre-DNA <4000 copies/mL with undetectable mid-DNA as low risk and pre-DNA ⩾4000 copies/mL or detectable mid-DNA as high risk. In the low-risk group, patients who received ⩽200 and >200 mg/m2 CCD had similar prognoses. However, in the high-risk group, patients receiving >200 mg/m2 CCD showed significantly improved 5-year PFS and LRRFS than those receiving ⩽200 mg/m2, and CCD was an independent prognostic factor for PFS.
Consistently, pre-treatment plasma EBV DNA level is a powerful supplement of TNM in predicting recurrence and metastasis in NPC.12,16,20 Multiple studies have indicated that pre-DNA ⩾4000 copies/mL have a significantly worse prognosis than pre-DNA <4000 copies/mL.13,16,21 In addition, an expanding body of data suggests that undetectable plasma EBV DNA during the midcourse of treatment correlates with better tumor control and survival.14 –16 Similarly, we found that pre-DNA and undetectable mid-DNA levels were independent prognostic factors for NPC treated with CCRT. It was also observed that patients with pre-DNA mid-DNA <4000 copies/mL and undetectable mid-DNA had significantly better clinical outcomes than other subgroups, and the combination of these two timepoints was better than either single timepoints or TNM stage for predicting the AUC of 5-year PFS and DMFS. Although AUC for 5-year PFS for a combination of pre-DNA and mid-DNA compared to pre-DNA was nonsignificant, there was a considerable improvement in accuracy. The possible reason might be related to the limitation of sample size, which led to lower statistical efficiency. Moreover, pre-DNA load may correlate with tumor load, while mid-DNA load is more likely to represent the sensitivity of chemoradiotherapy. Therefore, the combination of pre-DNA and mid-DNA could complement each other and contribute to early risk stratification and prognosis prediction. Further studies are required to validate this hypothesis.
In two-dimensional RT, a higher cumulative dose of cisplatin correlated with improved local control. In a combined analysis of NPC 9901 and NPC 9902 using two-dimensional radiotherapy (2DRT), the dose of cisplatin during the concurrent phase had a significant impact on locoregional failure and OS. 6 However, the benefit of a higher dose of cisplatin in the setting of IMRT is controversial. Previous studies have demonstrated that a CCD of 200 mg/m2 is associated with improved prognosis in NPC. Peng et al. 7 found that 200 mg/m2 CCD might be adequate to achieve a survival benefit for NPC patients treated with CCRT, while ⩾240 mg/m2 CCD was not observed as an independent prognostic factor. Similar results were observed by Wei et al., 22 indicating that CCD >200 mg/m2 improved the 5-year PFS rates and significantly improved DMFS compared to CCD ⩽200 mg/m2. However, because patients with NPC present with different prognoses, some predictors have been used to identify high-risk patients and modify the optimal dose of concurrent DDP. Guo et al. 5 reported no significant differences between groups receiving 101–200 mg/m2 and >200 mg/m2 CCD for low-risk NPC patients with pre-DNA <4000 copies/mL, which was confirmed by Li et al. 8 Liu et al. 10 found that enhancement of CCD (>200 versus <100 mg/m2 CCD) provided a survival benefit for patients who achieved complete tumor response/partial response after IC but not for patients who achieved stable disease/disease progression after IC. In addition, Ou et al. 9 identified that patients with N2-3 disease might benefit from higher CCD (⩾300 mg/m2). In our study, we divided the patients into low- and high-risk groups based on the combination of pre-DNA and mid-DNA levels. In the low-risk group, patients receiving ⩽200 mg/m2 CCD showed efficacy similar to that of >200 mg/m2 CCD but were associated with fewer all-grade late toxicities. Consistent with previous studies,7,22 balancing toxicity and efficacy, 200 mg/m2 seemed to be the optimal DDP dose for patients with pre-DNA <4000 copies/mL and undetectable mid-DNA. Among high-risk patients with pre-DNA ⩾4000 copies/mL or detectable mid-DNA, application of >200 mg/m2 CCD was significantly associated with improved PFS and LRRFS. Therefore, for patients with higher and sustainable monitoring EBV DNA load, except for the high dose of CCD to be considered during RT, the intensification of therapy such as maintenance treatment, targeted therapy, and immunotherapy might be augmented into the adjuvant period to improve the survival outcomes.
Despite these positive findings, our study has several limitations. First, because this was a retrospective study, there was an unavoidable selection bias, and the results need validation in further prospective studies. Second, because a very small proportion of patients received concurrent targeted therapy in this study, the survival benefit of targeted therapy between the risk subgroups was not discussed. Third, some patients were evaluated by chest radiography, abdominal sonography, and bone scan for distant disease evaluation before treatment, which might reduce and delay the detection of metastatic disease. Last but not least, the data were obtained exclusively from one center; therefore, a multicenter study is required.
Conclusion
Pre-DNA and mid-DNA levels were independent prognostic factors in NPC patients treated with CCRT. Balancing toxicity and efficacy, 200 mg/m2 appeared to be the optimal dose in the low-risk groups. Considering the higher proportion of treatment failures in the high-risk group, >200 mg/m2 might be required to achieve satisfactory disease control. The combination of pre-DNA and mid-DNA could help clinicians better identify patients at different risks of treatment failure and adjust the intensity of the CCD. Further investigation is necessary to confirm our findings.
Supplemental Material
sj-docx-1-tam-10.1177_17588359231221343 – Supplemental material for Combined pre-treatment and middle-treatment Epstein–Barr virus DNA load contributes to prognostication and treatment modification in nasopharyngeal carcinoma patients
Supplemental material, sj-docx-1-tam-10.1177_17588359231221343 for Combined pre-treatment and middle-treatment Epstein–Barr virus DNA load contributes to prognostication and treatment modification in nasopharyngeal carcinoma patients by Kaiqi Lan, Jingrong Mao, Xuesong Sun, Suchen Li, Siyi Xie, Rui Sun, Sailan Liu and Haiqiang Mai in Therapeutic Advances in Medical Oncology
Footnotes
References
Supplementary Material
Please find the following supplemental material available below.
For Open Access articles published under a Creative Commons License, all supplemental material carries the same license as the article it is associated with.
For non-Open Access articles published, all supplemental material carries a non-exclusive license, and permission requests for re-use of supplemental material or any part of supplemental material shall be sent directly to the copyright owner as specified in the copyright notice associated with the article.