
Abstract
Background and Aims:
Early-stage small intestinal neuroendocrine tumors (SI-NETs) are generally asymptomatic and difficult to diagnose. As a result, patients often present with late-stage incurable disease. SI-NETs originate from enterochromaffin (EC) cells, which develop enteroendocrine cell (EEC) clusters consisting of a subset of EC cells at the crypt bottom at an early stage of tumor progression. In a familial form of SI-NET, EEC clusters arise in a multifocal and polyclonal fashion. We sought to determine whether early detection and analysis of cryptal EEC clusters could provide insight into the development of SI-NETs and allow successful pre-symptomatic screening for at risk family members of patients with SI-NETs.
Methods:
Isolated crypts from endoscopic ileal biopsies or surgically removed specimens from 43 patients with familial SI-NET and 20 controls were formalin-fixed, immunostained for chromogranin A, and examined by confocal three-dimensional analysis for the presence of EEC cluster formations.
Results:
Examination of multiple areas of macroscopic tumor-free mucosa in surgically resected specimens from patients with familial SI-NET revealed widely distributed, independent, multifocal EEC micro-tumor formations of varying sizes. Consistent with this finding, randomly sampled ileal biopsy specimens identified aberrant crypt containing endocrine cell clusters (ACECs) in patients. ACECs were found exclusively in patients (23/43, 53%) and not in controls (0/20). Furthermore, analysis of positions and numbers of EECs in crypts and ACECs indicated significant increases in EECs at the crypt bottom, predominantly at positions 0 and 1′ (p < 0.0001 compared to controls), suggesting the progression of EEC accumulation below +4 position as the early process of ACEC formation. These findings also suggested that ACECs were precursors in the development of micro-tumors and subsequent macro-tumors.
Conclusion:
This study indicates that SI-NETs develop from deep crypt EC cells to become ACECs, micro-tumors, and ultimately gross tumors. This process occurs widely throughout the distal small intestine in patients with familial SI-NETs consistent with but not exclusively explained by germline disease. Finally, analysis of crypts from ileal biopsies could contribute in part to earlier diagnostic screening processes avoiding late-stage presentation of incurable disease.
Introduction
Small intestinal neuroendocrine tumors (SI-NET) also referred to as mid-gut carcinoids are usually well-differentiated, slow-growing serotonin-producing tumors of the distal small intestine. SI-NETs are the most common malignant tumors of the small intestine 1 and their incidence has increased more than sixfold from 1973 to 2012. 2 The malignant characteristics of SI-NETs have biological and genetic profiles that are distinct from other endocrine tumors.1,3 Their diagnosis is often delayed until an advanced stage of disease due to the slow-growing nature of the tumor that causes no or only mild nonspecific symptoms in early-stage disease. Most cases of SI-NETs are reported to be sporadic. Although reports are rare, a hereditary form of SI-NETs has been recognized. A recent population-based study indicated a relative risk (RR) of 13.4-fold in siblings of patients with SI-NET using a Utah Population Database. 4 The result of this study is consistent with the high RR of 9-fold to 11-fold and a standardized incidence of 13 in first-degree relatives observed in earlier studies using a Swedish Cancer Registry. 5 Moreover, family case studies have identified pedigrees with an autosomal dominant mode of inheritance.6–8 Although several predisposition genes such as MUTYH have been suggested, 7 to date, no linkage study has detected genes linked to familial SI-NETs except a single germline mutation in the inositol phosphate multi-kinase (IPMK) for one large family. 8
Discovery and characterization of precursor or early lesions of neoplastic tumors is central to early diagnostic and therapeutic interventions and the understanding of tumor development. Earlier studies proposed that SI-NETs originate from serotonin-producing enterochromaffin (EC) cells1,3,9,10 within the epithelial layer of the intestinal mucosa.11,12 The study of familial SI-NETs at the National Institute of Diabetes, Digestive and Kidney, NIDDK (NCT00646022) has enabled the investigation of early tumor formation using tissue sections as well as biopsy-derived isolated primary crypts. Consistent with the hypothesis from earlier studies, our previous studies identified early precursor lesions of tumors that were characterized by abnormal crypts containing a cluster of enteroendocrine cells (EECs) in both formalin-fixed tissue slides and in free-floating isolated crypts. 13 An RNA in situ hybridization study indicated that EEC clusters were made of reserve stem cell genes-expressing EC cells. 13 We termed these abnormal crypts ‘aberrant crypt containing endocrine cell clusters (ACEC)’. This crypt-oriented term helped focus our screening for early tumor precursor lesions within crypts where tumors initiate. Applying this method to tissue samples from the patients with familial SI-NETs revealed that ACECs were widely distributed in the macroscopic tumor-free mucosa throughout the jejuno-ileum. 13 In addition, mitochondrial DNA-based clonality analysis showed ACECs originated in clonally distinct crypts, suggesting widespread, polyclonal and multifocal genesis of the tumors. 13 This characteristic of familial SI-NET development was similar to other familial tumors with germline susceptible gene mutations, such as familial polyposis 14 or APC-mutant mouse models. 15
Similar to established hereditary tumor syndromes, early recognition of SI-NET family clusters followed by screening members for early diagnosis and resection of occult tumor is critical. As yet, no common genetic mutations responsible for familial SI-NETs have been found and thus genetic testing is not available. As 50% of family members are at risk of developing SI-NETS, adult blood-related relatives undergo periodic screening using a variety of diagnostic imaging studies to detect occult tumor. 8 These imaging studies are invasive, expensive, inconvenient, and resource limited with a sensitivity that is tumor size dependent. Earlier diagnosis of smaller tumors decreases the risk for advanced stage disease. In addition, identification of as many affected members as possible is critical for genetic linkage analysis success for this rare hereditary disease. Therefore, this study aimed to determine whether the presence of ACEC in endoscopic biopsies of the ileum from family members at risk for SI-NETs could be used for early detection of affected members.
Patients and methods
Patients and human tissue specimens
Jejuno-ileal tissue specimens were obtained from patients with familial SI-NETs. Patients were admitted to the NIH Clinical Research Center and underwent clinical evaluation per protocol and surgery as medically indicated. Familial cases were from families with at least two pre-existing cases of SI-NETs per family.8,16 Clinical profiles of patients are summarized in Table 1. All of the patients in this study had a familial form of SI-NET except one sporadic case. All the control samples were obtained during screening colonoscopy/ileoscopy after obtaining informed consent.
Clinical profile of patients.

The following subject samples were obtained from the same four patients: b3 (pre) and s13; b17 (pre) and s12; b23 (post) and s1; b26 (post) and s7.
d/p/b, duodenum/pancreas/bile duct.
Second surgery of b15.
NA, not available; pre, preoperative biopsy; post, postoperative biopsy; yr, years after surgery.
Crypt isolation
Intestinal tissue samples from ileal biopsy or surgically removed tissues were collected in a 50-ml tube containing ice cold 30 ml Dulbecco’s phosphate-buffered saline (DPBS), 100 U/ml penicillin-streptomycin, and 0.5 mM dithiothreitol. The tissues were washed several times with ice cold 30 ml DPBS and transferred to a 50 ml tube containing 30 ml cold chelation buffer (Ca2+ and Mg2+-free DPBS and 2mM EDTA). The tissues were cut into small pieces (less than 1 mm3) using surgical scissor or scalpels in a 5 cm Petri dish and transferred back to a 50 ml tube containing 30 ml cold chelation buffer. The tissues were shaken for 30 min at 4°C on an orbital shaker. The tissues were transferred into a 1% bovine serum albumin (BSA)-treated 50-ml tube and centrifuged at 200 g for 5 min. After removing the supernatant, the tissues were resuspended in 1% BSA-treated 15 ml tube containing 10 ml cold chelation buffer. The tissue fragments were vigorously pipetted and allowed to settle down to the bottom for 1 min. After careful removal of the supernatant, the fragments were resuspended in 10 ml chelation buffer. This sedimentation was repeated for five times to enrich crypts. The final resuspended fragments were collected into 1% BSA-treated 15-ml tube containing 10 ml cold DPBS, centrifuged at 200 g for 3 min and resuspended in 1 ml cold DPBS in a 1% BSA-treated microfuge tube for the immunostaining procedure.
Immunostaining and analysis of EECs in the crypts
The crypt-enriched tissue fragments in 1 ml cold DPBS in a 1% BSA-treated microfuge tube were centrifuged at 200 g for 3 min, resuspended in 700 µl DPBS containing 4% paraformaldehyde and incubated for 45 min at room temperature. Following the addition of 700 µl DPBS containing 0.1% triton X-100, the tissue fragments were incubated for 45 min. After washing three times with DPBS containing 0.1% triton X-100, the crypt-enriched tissue fragments were incubated in DPBS containing 5% fetal bovine serum for 1 h at room temperature and then immunostained with 1:500 mouse monoclonal anti-chromogranin A (ChgA) (LK2H10) (#MS-324-P, Thermo Scientific, Cheshire, UK) at room temperature for 1 h in DPBS containing 5% fetal bovine serum. After incubation with primary antibody, crypt-enriched tissue fragments were incubated with either Alexa Fluor 488- or 647-conjugated goat anti-mouse IgG secondary antibody (highly cross-adsorbed, Invitrogen, Carlesbad, CA, USA) for 30 min and with DAPI for 1 min at room temperature. Immunostained crypts were observed, imaged, and analyzed using Zeiss LSM510 Meta confocal microscope (Carl Zeiss, Dublin, CA, USA). For analysis of position and number of ChgA+ EECs, each crypt was scanned along the Z-axis to accurately acquire the position and number of the cells at different depths using the numbering system used previously (Figure 1). 17

Confocal 3D image analysis of ChgA+ EECs in the primary crypts isolated from ileal mucosa of normal controls. (a) The numbering system used in this study to record positions of the ChgA+ EECs in the crypt. (b) The confocal fluorescence images merged with bright-field images (left) and the corresponding 3D reconstruction from Z-stacked confocal images (right) from two representative crypts (top and bottom).
Statistical analysis
Statistical analysis was performed using Prism (version 9.1.2, GraphPad) software to compare groups (unpaired t-test) and determine correlations (simple linear regression analysis). A p value of less than 0.05 was considered significant.
Results
Establishment of ACEC criteria
Previous studies suggested a polyclonal and multifocal genesis of familial SI-NETs compared to a monoclonal genesis for sporadic disease. 13 Initially, the histological three-dimensional (3D)-based characteristics of the primary crypt preps were assessed to determine the criteria for ACECs using the position and number of EECs in crypts obtained from macroscopic tumor-free mucosa in a patient with familial SI-NET compared to a patient with a single sporadic SI-NET. For this initial analysis, we used surgical samples from a 45-year-old male familial SI-NET patient with more than 42 primary, well-differentiated (grade 1) SI-NETs and a 55-year-old female with a single sporadic SI-NET. In the crypt prep from macroscopic tumor-free mucosa from the familial SI-NET patient, 11 of 202 crypts contained more than nine EECs below position 10. Among these 10 crypts, one crypt exhibited a cluster of nine cells below position 4 (p4). In comparison, in the crypt prep from macroscopic tumor-free mucosa from the sporadic patient, no crypts contained more than nine EECs among 1479 crypts examined. Based on these findings, the presence of at least nine EECs below p4 was tentatively used to define ACECs in this study. The utility of this definition was confirmed in subsequent studies of ileal biopsies and surgical samples from patients with familial SI-NETs compared with ileal biopsies from control subjects.
ACECs are present in macroscopic tumor-free mucosa
The presence of ACECs in macroscopically appearing normal ileal mucosa at varying distances from the primary tumor was investigated in the following two representative cases. The first case (patient s6) underwent surgery for resection of recurrent tumor near the anastomosis from a previous partial ileal resection to remove multiple SI-NETs. Isolated crypts were prepared from two areas of macroscopic tumor-free ileal mucosa 10 and 20 cm from the isolated tumor and an area of the mucosa overlying the tumor that recurred 25 cm from anastomotic line (Figure 2(a)). ACECs were identified from these preps on the basis of ChgA IHC in all three mucosal areas (Figure 2(a)). Unlike the majority of patients with familial SI-NETs, the second case (patient s9) had only a single tumor near the ileocecal valve requiring a hemicolectomy. Isolated crypts were prepared from three areas of macroscopic tumor-free ileal mucosa 5, 11, and 17 cm from the tumor and a fourth area of the mucosa overlying the tumor (Figure 2(b)). ACECs were identified at high frequency in all four areas. The presence of ACECs in multiple areas of tumor-free mucosa at varying distances from the tumor in these two cases indicates a multifocal process of tumorigenesis and is not surprising for this germline disease. This widespread multifocal process of tumorigenesis offers the opportunity for phenotyping and early diagnosis of at-risk family members using random sampling of ileal biopsy specimens. In fact, extending this ChgA immunohistochemical analysis to a larger set of patients confirmed the value of this approach in which ACECs were identified in 12 of 28 (42.8%) ileal biopsies and 12 of 15 (80%) surgical samples from patients with SI-NETs as compared with no ACECs found in the 20 ileal biopsies from control subjects.

Distribution of ACECs in surgically resected specimens. (a) An illustration of surgically resected tissue indicates the anastomotic line (red) from previous surgery, a tumor (filled circle) and locations of mucosal specimens collected for analysis. The tumor was at 25 cm from the anastomotic line. Two specimens of macroscopic tumor-free ileal mucosa were at 10 and 20 cm from the tumor. The images below are confocal 3D images of ChgA+ EECs (white) in ACECs from each mucosal specimen. The number of ACECs per number of crypts examined is shown. (b) An illustration of surgically resected tissue indicates locations of a tumor (filled circle) and mucosal specimens collected for analysis (5, 11, and 17 cm from the tumor). The images below are confocal 3D images of ChgA+ EECs (white) in ACECs from each mucosal specimen. The number of EECs at 0′ and 1′ per 100 crypts, 0′ + 1′/>10 ratio, and number of ACECs per number of crypts examined are shown. As a reference for comparison, the number for each of these parameters from a control biopsy group are shown on the right.
Increase in crypt EECs below position 4 is diagnostic for familial SI-NET
We next examined whether the number of EECs at each position within the crypt could help distinguish between patients with familial SI-NETs and control subjects. Data from familial SI-NET ileal biopsies and surgical samples were analyzed separately to evaluate patient ileal biopsy (n = 28) compared to control ileal biopsy (n = 20). Results of the comparison of the numbers of EECs at different positions in the crypt, 0′, 1′, 2′, 4, 5–10, and >10 between the groups indicated significant increases in EECs at positions 0′, 1′, and 2′, especially at 0′ and 1′ in patient ileal biopsies (p = 0.000, n = 28) as well as in patient surgical samples (p < 0.0001, n = 15) when compared to control ileal biopsies (n = 20) (Figure 3). To evaluate if the numbers were influenced by general increases in the total number of EECs, that is, diffuse hyperplasia or diffuse with nodular hyperplasia (Figure 4), we examined the ratio of the combined numbers of EECs at 0′ and 1′ over the numbers of EECs positioned higher than 10 (0′ + 1′/>10 ratio). The 0′ + 1′/>10 ratio maintained significant increases in both patient ileal biopsies (p = 0.011) and surgical samples (p < 0.0001) when compared to control ileal biopsies (Figure 5(a)). In addition, there were significant correlations between the combined numbers of EECs at 0′ and 1′ and 0′ + +1′/>10 ratio in patient ileal biopsies (R2 = 0.29, p = 0.003), as well as in patient surgical samples (R2 = 0.32, p = 0.029) and in control ileal biopsies (R2 = 0.62, p < 0.0001) (Figure 6). These results indicate that the increased number of EECs at 0′ and 1′ was not due to a general increase in the number of EECs but specifically due to EEC accumulation below p4. Importantly, therefore, the EEC accumulations below p4 appear as precursors of ACECs.
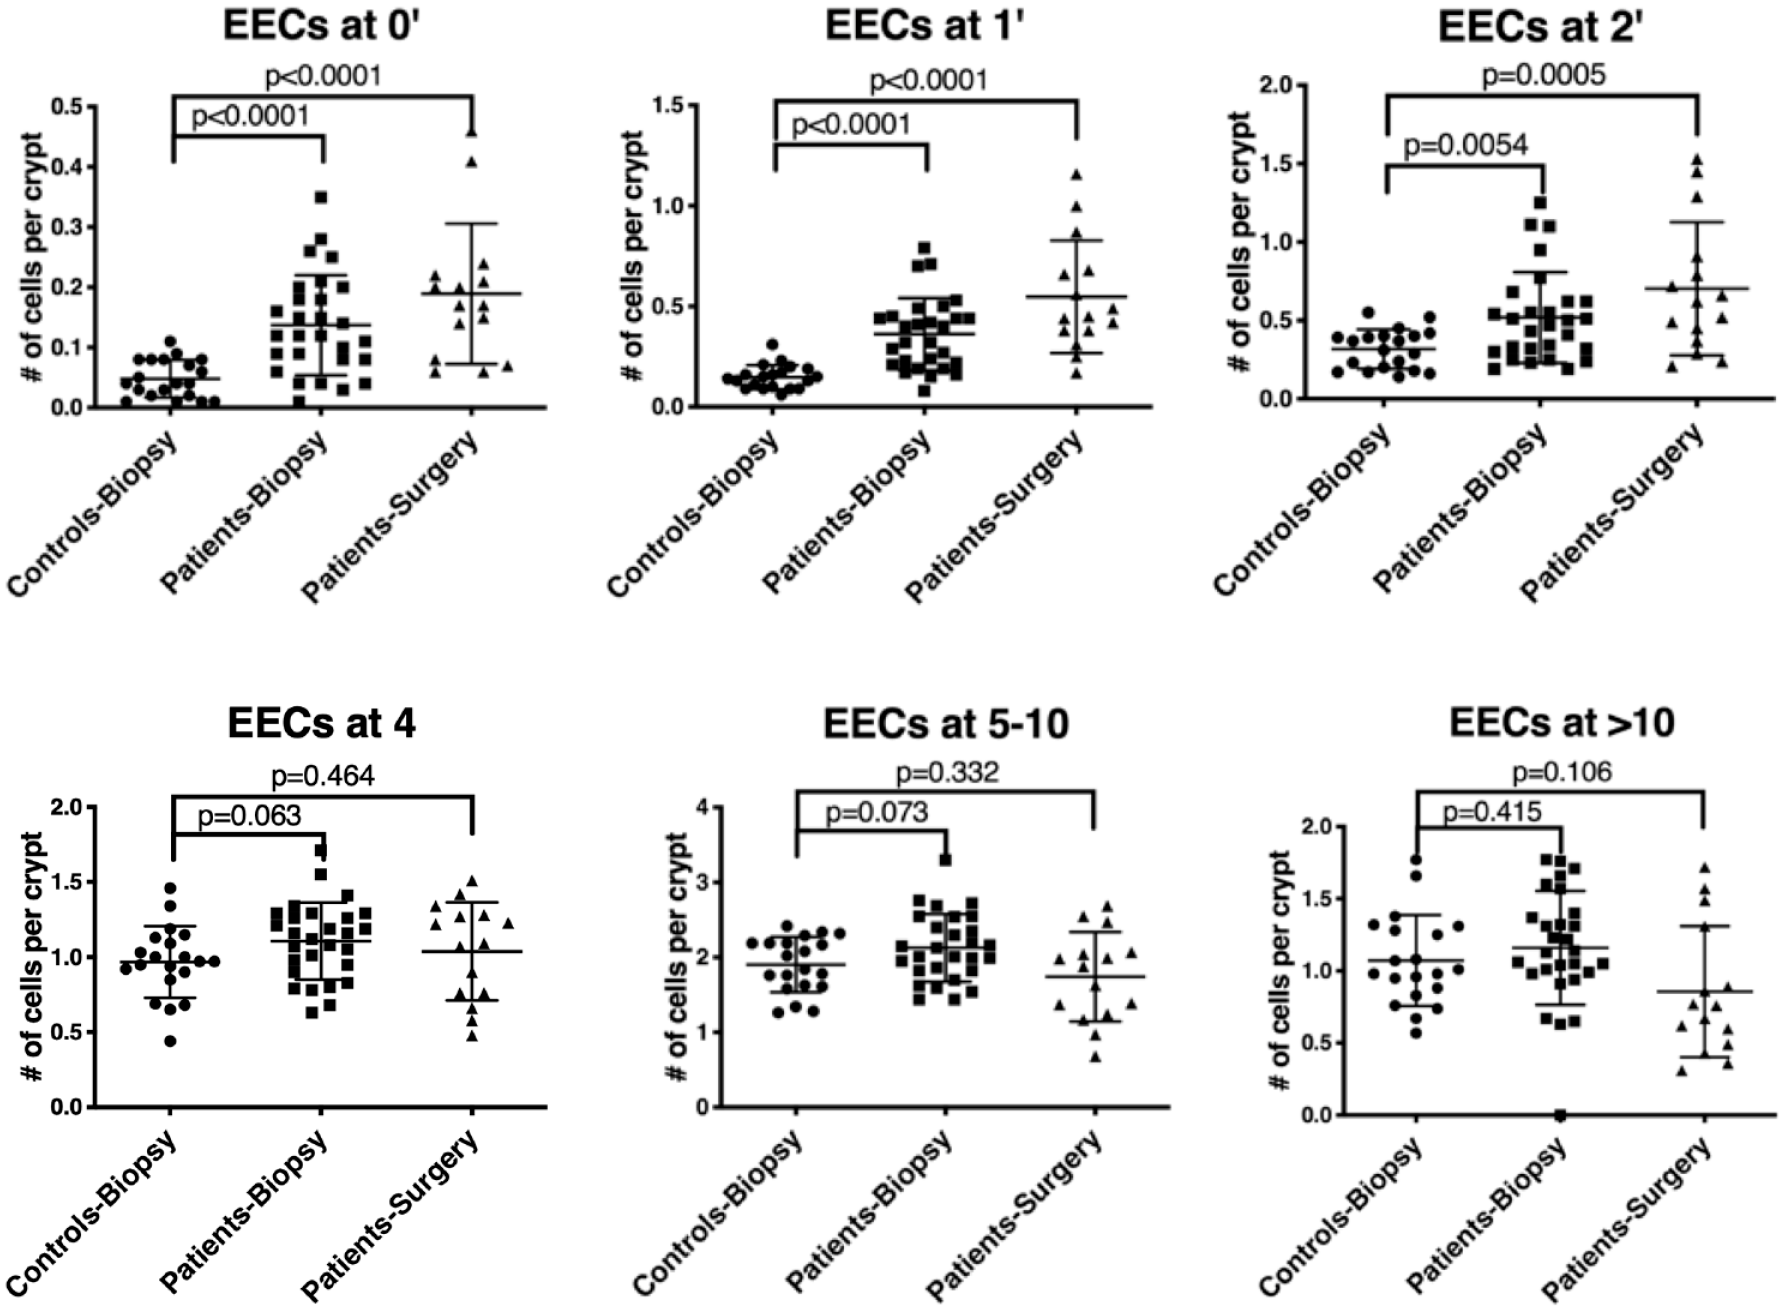
Comparison of the number (mean ± SD) of ChgA+ EECs at different positions, 0′, 1′, 2′, 4, 5–10, and >10 in the crypt from control biopsy (n = 20), a patient biopsy (n = 28), and a patient surgery (n = 15) groups. A p value less than 0.05 is statistically significant (unpaired t-test).

Confocal 3D images of ChgA+ EECs (white) in the primary crypts from macroscopic tumor-free ileal mucosa of patients with familial SI-NET. A crypt with diffuse hyperplasia, a crypt with mixed diffuse and nodular hyperplasia and two ACECs are shown.

(a) Comparison of the combined number of ChgA+ EECs at 0′ and 1′ and the ratio of the combined number of EECs at 0′ and 1′ over the number of EECs positioned higher than 10 (0′ + 1′/>10 ratio) in the crypts from control biopsy (n = 20), patient biopsy (n = 28), and patient surgery (n = 15) groups. (b) Comparison of the combined number of ChgA+ EECs at 0′ and 1′ and the 0′ + 1′/>10 ratio in the crypts from control biopsy (n = 20), ACEC negative (n = 16), and ACEC positive (n = 12) patients biopsy groups. A p value less than 0.05 is statistically significant (unpaired t-test).

Correlation between the combined number of ChgA+ EECs at 0′ and 1′ and the 0′ + 1′/>10 ratio in the crypts from control biopsy (n = 20), patient biopsy (n = 28), and patient surgery (n = 15) groups. The correlation in the crypts from a patient biopsy group was further analyzed based on the absence (n = 16) or presence of ACECs (n = 12) in the specimens. The red square indicates the cutoff values, the upper limits of 95% CI of 0′ + 1′/>10 ratio (0.35) and combined numbers of EECs at 0′ and 1′ (0.36) of a control biopsy group. The numbers of samples inside and outside of the red square are shown in red and black font, respectively. Note that one outlier in a patient biopsy group is excluded to avoid shrinkage of the graph. R2, the coefficient of determination (regression analysis).
To further explore the early process of ACEC formation, we analyzed SI-NET patient ileal biopsies after separating them into ACEC-positive (n = 12) and ACEC-negative (n = 16) groups and comparing them to each other as well as to the control subject group (n = 20) (Figure 5(b)). The number of EECs at positions 0′ and 1′ was significantly increased in both the negative (p = 0.0001) and positive (p < 0.0001) ACEC patient group compared to the control subject group (Figure 5(b)). Similarly, the 0′ + 1′/>10 ratio was significantly increased in both the negative (p < 0.0001) and positive (p = 0.0031) ACEC patient group compared to the control subject group (Figure 5(b)). There was a significant correlation between the combined numbers of EECs at 0′ and 1′ and 0′ + 1′/>10 ratio in the ACEC-negative patient group (R2 = 0.30, p = 0.029), but not in the ACEC-positive patient group (R2 = 0.20, p = 0.141) due to one outlier (Figure 6). These results indicate that EEC accumulation below +4 position occurs as a precursor to the formation of ACEC as evidenced by the significant increase in the number of EECs at 0′ and 1′ in an ACEC-negative patient ileal biopsy group.
Since the numbers of the tumors in the intestine were accurately recorded and available for the patient surgery group (Table 1), we also examined if the parameters, the combined numbers of EEC at 0′ and 1′ and 0′ + 1′/>10 ratio, were correlated with the numbers of the tumors in the intestine. Regression analysis, however, showed no correlation. Neither of these two parameters was correlated with age, or sex in the control biopsy group, the patient biopsy group, the patient surgery group, or combination of these three groups.
Assessment of SI crypt EEC number as a diagnostic screening test for familial SI-NET affection status
We evaluated the utility of crypt-based EEC number observed in crypt preps from ileal biopsies from asymptomatic family members at risk for familial SI-NETs as a diagnostic screening tool and also as a potential indicator for recurrent disease for patients following SI tumor resection. For this purpose, we examined two previously described parameters correlated with ACEC: the EEC position 0′ + 1′/>10 ratio and combined EEC number at positions 0′ and 1′ in the crypt. The mean and the standard deviation (SD) of the EEC position 0′ + 1′/>10 ratio in the control subject group were 0.19 and 0.08, respectively. The mean and the SD of the combined EEC number at positions 0′ and 1′ in the control subject group were 0.20 and 0.08. The 95% confidence interval (mean + 2SD) standard applied to determine cutoff values resulted in an upper limit of 0.35 and 0.36 for the 0′ + 1′/>10 ratio and the combined numbers of EECs at positions 0′and 1′, respectively. Applying these cutoff values to the analysis of 20 control subject biopsy samples achieved a 95% specificity with only one subject lying above this range (false positive) (outside of red square in Figure 6). Applying these same parameters to the 28-patient biopsy sample group resulted in a sensitivity of 71% with 8 patients lying below this range (false negative) (within red square, Figure 5). Importantly, the sensitivity for the ACEC-positive and ACEC-negative patient biopsy groups were 91.7% and 56.3%, respectively. Therefore, if ACEC are present in the ileal biopsy specimens, the sensitivity and the specificity of the test are 91.7% and 95%, respectively. If only the presence or absence of ACEC in ileal biopsy specimens are used as a pre-symptomatic screen, the test provides only 42.8% sensitivity and 100% specificity.
Crypt analysis compared to biochemical tests for SI-NETs
5-hydroxytryptamine (5HT, serotonin) and ChgA levels in serum and 5-hydroxyindoleacetic acid (5HIAA) levels in 24-h urine collection during the admission prior to surgery are shown for all the patients in the patient surgery group (Table 2). 5HT, ChgA, and 5HIAA tests indicated only 5, 3, and 2 positive test results, respectively, in a total of 15 subjects. However, crypt analysis was positive in 14 of 15 subjects and indicates superior sensitivity of crypt analysis compared to the commonly used biochemical tests for SI-NETs.
A comparison between crypt analysis and biochemical tests.

Normal values, bold font values are abnormal, 5HT and ChgA tests measured the levels in the blood, 5HIAA test measured the levels in 24-h urine.
5HT, 5-hydroxytryptamine, serotonin; 5HIAA, 5-hydroxyindoleacetic acid; ChgA, chromogranin A.
Discussion
This study investigated early formation and characteristics of ACECs using crypt-based confocal 3D tissue analysis in patients with SI-NETs. Comparison of confocal results between familial and sporadic cases indicated clear differences in numbers and positions of EECs in the crypts isolated from macroscopic tumor-free ileal mucosa in surgically resected specimens. The results not only helped us to confirm widespread multifocal genesis of familial SI-NETs, but also provided a tentative 3D-based criterion of ACEC, which is a crypt containing a cluster of at least nine EECs below p4. With this criterion, we examined the presence or absence of ACECs in the crypts isolated from ileal biopsy tissue samples to evaluate diagnostic feasibility of using ACEC detection as a pre-symptomatic screen for at risk members of families with SI-NETs. Although the detection rate was low (42.8%), we confirmed that ACECs were found only in patients with SI-NETs and not in control subjects. If the presence or absence of ACEC in ileal biopsy specimens are used as a pre-symptomatic screen, the test provides 100% specificity with 42.8% sensitivity. Importantly, examination of crypts isolated from macroscopic tumor-free ileal mucosa closer to the resected tumor detects ACECs 80% of the time. These results support our previous observation of the widespread, multifocal nature of tumors in familial SI-NET, 13 as well as the potential diagnostic value of whole-mount crypt analysis using randomly sampled ileal biopsy specimens.
To improve the sensitivity of ileal biopsies for screening at risk asymptomatic members of families with familial carcinoid, we examined the number and position of EECs within the crypts. Results from the analysis of the numbers of EECs at different positions in the crypt, 0′, 1′, 2′, 4, 5–10, and >10 indicated significant increases in EECs at positions 0′, 1′, and 2′, not only in surgically resected specimens from the patients, but also in ileal biopsy specimens from the patients. These results suggest that the increase in the numbers of EEC at positions 0′, 1′, and 2′, especially at 0′ and 1, is an early event of ACECs, as already seen in an ACEC (-) ileal biopsy group in the patients. Furthermore, the results suggested that the two parameters, 0′ + 1′/>10 ratio and the numbers of EECs at 0′ and 1′, which reflect the early accumulation of EEC at crypt base, are useful for a pre-symptomatic screening for family members of patients with familial SI-NETs. This was especially useful since the sensitivity and the specificity of the test using the two parameters were 71% and 95%, respectively. These values exceed those of 18F DOPA PET/CT. 18 Superior sensitivity of crypt analysis compared to routine biochemical tests, that is, 5HT, ChgA in blood, and 5HIAA in 24-h urine, was also apparent (Table 2). The incidence of SI-NETs increases with age.2,19 Although a bigger sample size is needed, neither of the two parameters nor the presence of ACEC was associated with age in this study.
The results of the crypt analysis of the initial two case studies of familial SI-NETs confirmed the general occurrence of ACECs in the macroscopic tumor-free mucosa and thus suggested the potential use of ileal biopsy specimens for evaluation of ACECs (Figure 2). The lower sensitivity of ileal biopsies located a distance from the tumor site suggests less risk of recurrent disease. However, the presence of early disease in ileal biopsies raises concern regarding appropriate surgical margins. In fact, case s6 suggests that the degree of resection of tumor at the first operation may have been inadequate resulting in reoperation for recurrent disease (Figure 2(a)). Although in this case, the resection margins were over 20 cm from the tumor for the second operation, this may still be inadequate since ACECs were detected near the distal resection margin. These results therefore call into question the criteria for determining the necessary length of surgical margins in patients with familial disease. Perhaps the analysis of surgical and endoscopic biopsies for the presence of ACEC may be a useful tool for further investigation.
One of the limitations of this study is unavailability of data for sporadic cases due to the clinical protocol design. Although our research focus is on genetics of familial hereditary form of the disease, comparison with sporadic tumors would help us understand tumorigenesis better. One might wonder if sporadic multifocal tumors share the pathogenesis which is similar to those in familial form. Importantly, recent studies of multiple primary SI-NETs from patients of presumed sporadic or unknown origin suggested independent polyclonal genesis of multifocal tumors.20–22 These findings are consistent with our earlier findings for familial SI-NETs. 13 Furthermore, there are many studies reporting frequencies of patients having multifocal SI-NETs, which ranged from 20% to 56%.19,23 However, it should be noted that proportions of sporadic and familial cases in all these studies are unknown. To classify that the tumor(s) is sporadic, surveying family history is essential, but may still be insufficient to rule out familial disease that can be subclinical, late-onset or even incompletely penetrant as understood from the Swedish autopsy study showing significantly higher annual incidence of SI-NETs, especially in an aging-related manner, than those estimated from population-based clinical data repository. 19 Rather, we should consider a possibility that familial cases are more common than generally thought. The current method may help identifying familial forms if applied to family members of the presumed-sporadic cases.
Our current hypothesis is that a subset of EC cells residing at +4 position in the crypt with active reserve stem cell function are the origin of SI-NETs and account for the genesis of the multifocal and polyclonal tumors observed in familial disease. 24 This study of crypts from ileal biopsy specimens supports our previous observation of the widespread, multifocal nature of familial tumors. Furthermore, the early accumulation of EC cells below +4 position at the crypt bottom demonstrated in our study offer the potential basis for the diagnostic screening value of whole-mount crypt analysis of ileal biopsy specimens for at risk members of families with SI-NETs.