
Abstract
Background:
The current model of clinical drug development in oncology displays major limitations due to a high attrition rate in patient enrollment in early phase trials and a high failure rate of drugs in phase III studies.
Objective:
Integrating transcriptomics for selection of patients has the potential to achieve enhanced speed and efficacy of precision oncology trials for any targeted therapies or immunotherapies.
Methods:
Relative gene expression level in the metastasis and normal organ-matched tissues from the WINTHER database was used to estimate in silico the potential clinical benefit of specific treatments in a variety of metastatic solid tumors.
Results:
As example, high mRNA expression in tumor tissue compared to analogous normal tissue of c-MET and its ligand HGF correlated in silico with shorter overall survival (OS; p < 0.0001) and may constitute an independent prognostic marker for outcome of patients with metastatic solid tumors, suggesting a strategy to identify patients most likely to benefit from MET-targeted treatments. The prognostic value of gene expression of several immune therapy targets (PD-L1, CTLA4, TIM3, TIGIT, LAG3, TLR4) was investigated in non-small-cell lung cancers and colorectal cancers (CRCs) and may be useful to optimize the development of their inhibitors, and opening new avenues such as use of anti-TLR4 in treatment of patients with metastatic CRC.
Conclusion:
This in silico approach is expected to dramatically decrease the attrition of patient enrollment and to simultaneously increase the speed and detection of early signs of efficacy. The model may significantly contribute to lower toxicities. Altogether, our model aims to overcome the limits of current approaches.
Introduction
Attrition rates are a critical issue in drug development especially within oncology, having direct impact on clinical trial outcomes. Furthermore, each drug that successfully reaches the market also has to bear the research and development costs of programs that failed, and the average cost of developing a new drug is $1 billion. 1
There are now more than 50 commercially available oncology drugs targeting the molecular pathways frequently aberrant in human tumors, 2 and hundreds of new targeted drugs including modulators of immune checkpoints are in clinical pipelines. However, the clinical development of oncology drug products still faces several major challenges: (1) the attrition rate within the oncology field as a whole is 82% for drugs that enter clinical development. For the subset of kinase inhibitors, the attrition rate is 53% 1 ; (2) phase III failure rates are as follows: (i) 45% due to lack of efficacy, (ii) 24% due to failure to prolong life compared to existing therapies, and (iii) 31% due to other reasons including toxicities and failure to identify cancer populations likely to respond to treatment. Therefore, there is a critical need to decrease the attrition rate for molecularly targeted agents and immune therapies in oncology. 1
Affordable technologies for tumor molecular profiling to refine prognosis and inform treatment decisions3–7 are available, but a predictive biomarker for patient selection and to guide clinical design remains an unmet need. Indeed, the current approach usually results in a high patient attrition rate because even when validated selection criteria are used, they are mostly based on DNA analysis, and the frequency of the potential drug targets is usually low in the population (3–5%). 8 As a consequence, most of the patients screened cannot be enrolled and only a minority end up being treated.
Expanding patient selection strategies beyond DNA and integration of transcriptomics is still infrequent. Two prognostic signatures, namely Oncotype and Mammaprint, are most commonly used today in clinical practice to inform potential benefit of adjuvant chemotherapies or hormonotherapies for patients with early stage breast cancer, but not to select the specific therapies most likely to be beneficial.9–12 For all other solid tumor types, despite numerous reports of molecular signatures developed to predict efficacy of specific treatments, there is no consensus on the use of molecular transcriptomic signatures in clinical oncology, and the reason is mostly related to difficulties in analytic interpretation (and reproducibility) of data, due to high interpatient variability.13,14
Integration of transcriptomics as a predictive biomarker to guide personalized therapies was tested in the WINTHER prospective clinical trial and demonstrated a significant increase (35%) in the fraction of patients who were candidates to receive targeted therapeutic options. 15 This trial of WIN consortium remains today the only reported trial using transcriptomics prospectively to navigate personalized cancer treatments. The major difference with other transcriptomic approaches employed in the WINTHER trial was the control of interpatient variability of gene expression using dual tumor and normal organ-matched tissue biopsies from the same patients. The data obtained in this study also enabled development of a novel algorithm to predict the duration of progression-free survival (PFS) under specific treatments known as the Digital Display Precision Predictor (DDPP) algorithm. 16
Building on these achievements, we present a new model for cancer drug development based on transcriptomics as well as genomics and a novel algorithm to improve matching of drugs with predictive biomarkers that, we believe, may overcome the limitations of current clinical drug development methods.
Methods
Our in silico analyses were based on data from the European Union funded WINTHER trial. 15
Patients with advanced cancer were enrolled prospectively in this trial and underwent biopsy of tumor tissue and organ-matched normal tissue, which was then analyzed using next-generation sequencing and transcriptomics. Clinical outcomes for 101 patients with advanced/metastatic solid tumors [38 colorectal cancers (CRC), 20 head and neck (HN) carcinomas, 18 non-small-cell lung cancers (NSCLC) and 25 were other cancers (including breast, bladder, esophagus, gastric and kidney, neuroendocrine tumors, rhabdomyosarcoma, leiomiosarcomas, and hepatocarcinomas]) were available. The median age of patients was 59 years (range, 26–82 years); Sixty percent (n = 60) were men. Patients enrolled in the WINTHER study were heavily pretreated with a median of 3 previous treatments (range from 1 to 7). The distribution of Eastern Cooperative Oncology Group (ECOG) status was as follows: ECOG, 0–35%; ECOG, 1–51%; ECOG, 2–11%; and ECOG, >2–3%.
The dataset used in our in silico analysis consists of Agilent microarray data generated from tumor and analogous organ-matched normal lung tissues from each patient. 15 Biopsies were stored in RNALater, then embedded and frozen in OCT. Histology quality control ensured a minimum of 50% tumor cells in tumor biopsies, and a minimum of 30% normal epithelial cells in bronchial mucosa biopsies (in the case of NSCLC for example).
C-MET inhibitors are currently approved for the treatment of NSCLC patients harboring MET exon 14 skipping and c-MET amplifications. Such indications based on DNA alterations have a prevalence of less than 5% in NSCLC patients. 8 We explored the hypothesis that integrating transcriptomics by measuring the differential expression of MET and/or its ligand HGF in biopsies from the tumor tissue and analogous normal tissue (histologically matched: e.g. normal bronchial mucosa obtained under bronchoscopy for NSCLC tissue) would potentially expand the clinical utility to a higher fraction of patients and extend the indications for c-MET inhibitor treatment to other types of metastatic cancers.
While HGF is the ligand which activates MET upon binding to it, our analysis also considered the activation of c-MET independently of HGF. Thus, we performed in silico the following steps: (1) we explored the prognostic value of the c-MET target and of its ligand HGF using the Kaplan–Meier (KM) PFS probability plots and Forest plots of a cox regression hazard ratios (HRs); (2) we built a predictor of PFS under c-MET inhibitor treatment using the recently published DDPP algorithm 16 to estimate the predicted PFS (pPFS) for all WINTHER study patients if they were treated with c-MET inhibitor; and (3) we designed a clinical study that would efficiently demonstrate the efficacy of c-MET inhibitors in the selected population.
With the same methodology, we explored the prognostic and predictive value of key IO targets: PDL1, CTLA4, TIGIT, TIM3, LAG3, TLR4, and ICOS in patients with metastatic CRCs and NSCLC, and identified the targets with highest potential for clinical drug developments programs.
The patients were classified into high and low groups based on the expression (differential expression tumor versus normal or expression in tumor alone) of their genes of interest based on the k-mean clustering method. 17 When using the differential expression tumor versus normal, the log2 of the ratio of the intensities was used. When using the expression in the tumoral tissue only, the log2 of the intensity was used. One patient was excluded from the analysis since the expression of MET of this patient was not available.
The survival of each of the expression level groups was estimated using the univariate KM plot. The difference between the survival curves of the groups was tested using the log-rank test. The median survival in months was estimated from the KM plots. A multivariate survival analysis was performed and visualized using the Forest Plot for Cox proportional hazard model. While various covariates were included in the analysis (sex, site/type of cancer, ECOG, and expression level group), in each covariate one of the subgroups was used as a reference and the HR of all other subgroups within the specific covariate were estimated against it. HR higher than 1 indicates that the subgroup is likely to prolong survival. HR lower than 1 indicates that the likelihood is to have a shorter survival. The range of the HR was estimated with a 95% confidence interval (CI) and the level of significant was provided by p value. The survival analyses were computed in R using the ‘survival’ and ‘survminer’ packages.18–20
mRNA and RNA-seq validation datasets were analyzed using the KMplotter tool which is publicly available and includes datasets from various sources such as Gene Expression Omnibus and The Cancer Genome Atlas. 21 We used one cohort (breast cancer) from the gene-chip repository and two cohorts from the RNA-seq repository (pancreatic ductal adenocarcinoma and HN squamous cell carcinoma). Since we generated KM which included more than one gene, we used the multiple genes feature in which we used the mean expression of the selected genes while each gene had an equal weight. Since there is no option to set a cutoff similarly to ours (k-mean clustering), we used the automatic-selected best cutoff feature which test all the possible thresholds between the lower and upper quartiles to classify the group into high and low, and used the best performing threshold as a cutoff. The cohorts used were not filtered by any characteristics (clinical or cellular). For the mRNA cohort, all probes of the MET and HGF genes were selected.
Generating a predictor using the DDPP algorithm: The predictor for c-MET inhibitor treatment efficacy was built based on the DDPP algorithm. 16 The algorithm uses a list of genes (selected based on previous knowledge) and correlates (using Pearson) each one of them alone against the survival values. The genes are then ranked (based on R and p values) and different combinations of the genes are tested by correlating the expression value of all the genes in a given combination against the survival values. The most correlated and significant combination is then selected and the equation of the linear regression is then used as a predictor (the equation links expression to survival values).
The key steps of the DDPP model are as follows: identification and ranking of key genes based on their differential expression in tumor compared to analogous normal tissue from the same patient and their Pearson correlation with PFS. In the example of c-MET inhibitors, the genes used to build the predictor were selected based on previous knowledge from the literature22–25: MET, HGF, HGFAC, ETS1, ETS2, TFAP2A, TCF7L2, SP1, TGFA, TGFB1, IL1A, IL1B, IL6, ST14, GRB2, SHC1, CRK, CRKL, PIK3CA, PLCG1, SRC, PTPN11, STAT3, GAB1, PTPRJ, PTPRF, PTPN1, PTPN2, ITGA6, ITGB4, CD44, EZR, RDX, MSN, SOS1, SOS2, KRAS, NRAS, HRAS, TIAM1, CTTN, DNM2, ICAM1, RAF, MAPK8, EGFR, EGF, ERBB2, ERBB3, MST1R, PDGFRA, PDGFRB, AXL, HIF1A, PTK2, ADAM17, CBL, ADAM10, PSENEN, SPSB3, PLXNB1, PIK3R1, SPSB1, SPSB2, INPP5D, INPPL1, RANBP9, RANBP10, LECT2, HSP90AA1, HSP90AB1, and AKT1. In the second step, the DDPP algorithm performs parametric-free feature summation selecting the optimal number of genes, and deriving a score based on the relative gene expression of the selected genes. The final DDPP regression equations link gene expression to clinical outcome. The regression equations are then used to estimate pPFS.
Selecting linear regression correlator using step-in analysis: The c-MET genes (mentioned above) of the three patients treated with c-MET inhibitors in the WINTHER trial were correlated (Pearson correlation) with their associated PFS values. The correlations were ranked based on their significance according to the DDPP methodology (ranked by p value and R). All possible combinations of gene sets, starting from a single gene (with highest correlation) and adding one more gene (the next most correlated gene) in each step were correlated with the PFS. A weighted expression value of the genes composed in each set was calculated using the mean, median, sum, fold, and absolute of the fold change values of the genes. Figure 2(b) shows the most significant gene set (based on p value and R) selected as the correlator: Y = 2.7852X − 5.97 where Y is the median of fold changes tumor versus normal multiplied by the intensity of expression in the tumor for each of the six genes: EZR, GRB2, SPSB3, CRKL, IL1B, and PSENEN, and X is PFS in months. The predictor performance was R = 1 and p = 0.0037. The reciprocal equation X = (Y + 5.97)/2.7852 was then used to determine the pPFS for all other patients of WINTHER study, if they would have received a c-MET inhibitor.
To define the main criteria for eligibility, we observed at the fold change tumor versus normal values. Patients who had fold change values higher than 1.5 for MET and/or HGF were considered to be eligible. Patients classified as low in both genes would not be matched to the potential study. On the other hand, patients classified as high will potentially have a benefit from the study.
Results
Prognostic value of c-MET target
We explored the differential gene expression levels of MET and HGF in the tumor and in the analogous normal tissues for NSCLC, CRC, HN, and other types of advanced solid tumors in patients from the WINTHER trial, while each patient being used as his/her own control. The KM survival analysis was used to visualize the impact of the differential expression level (high and low) on the OS probability
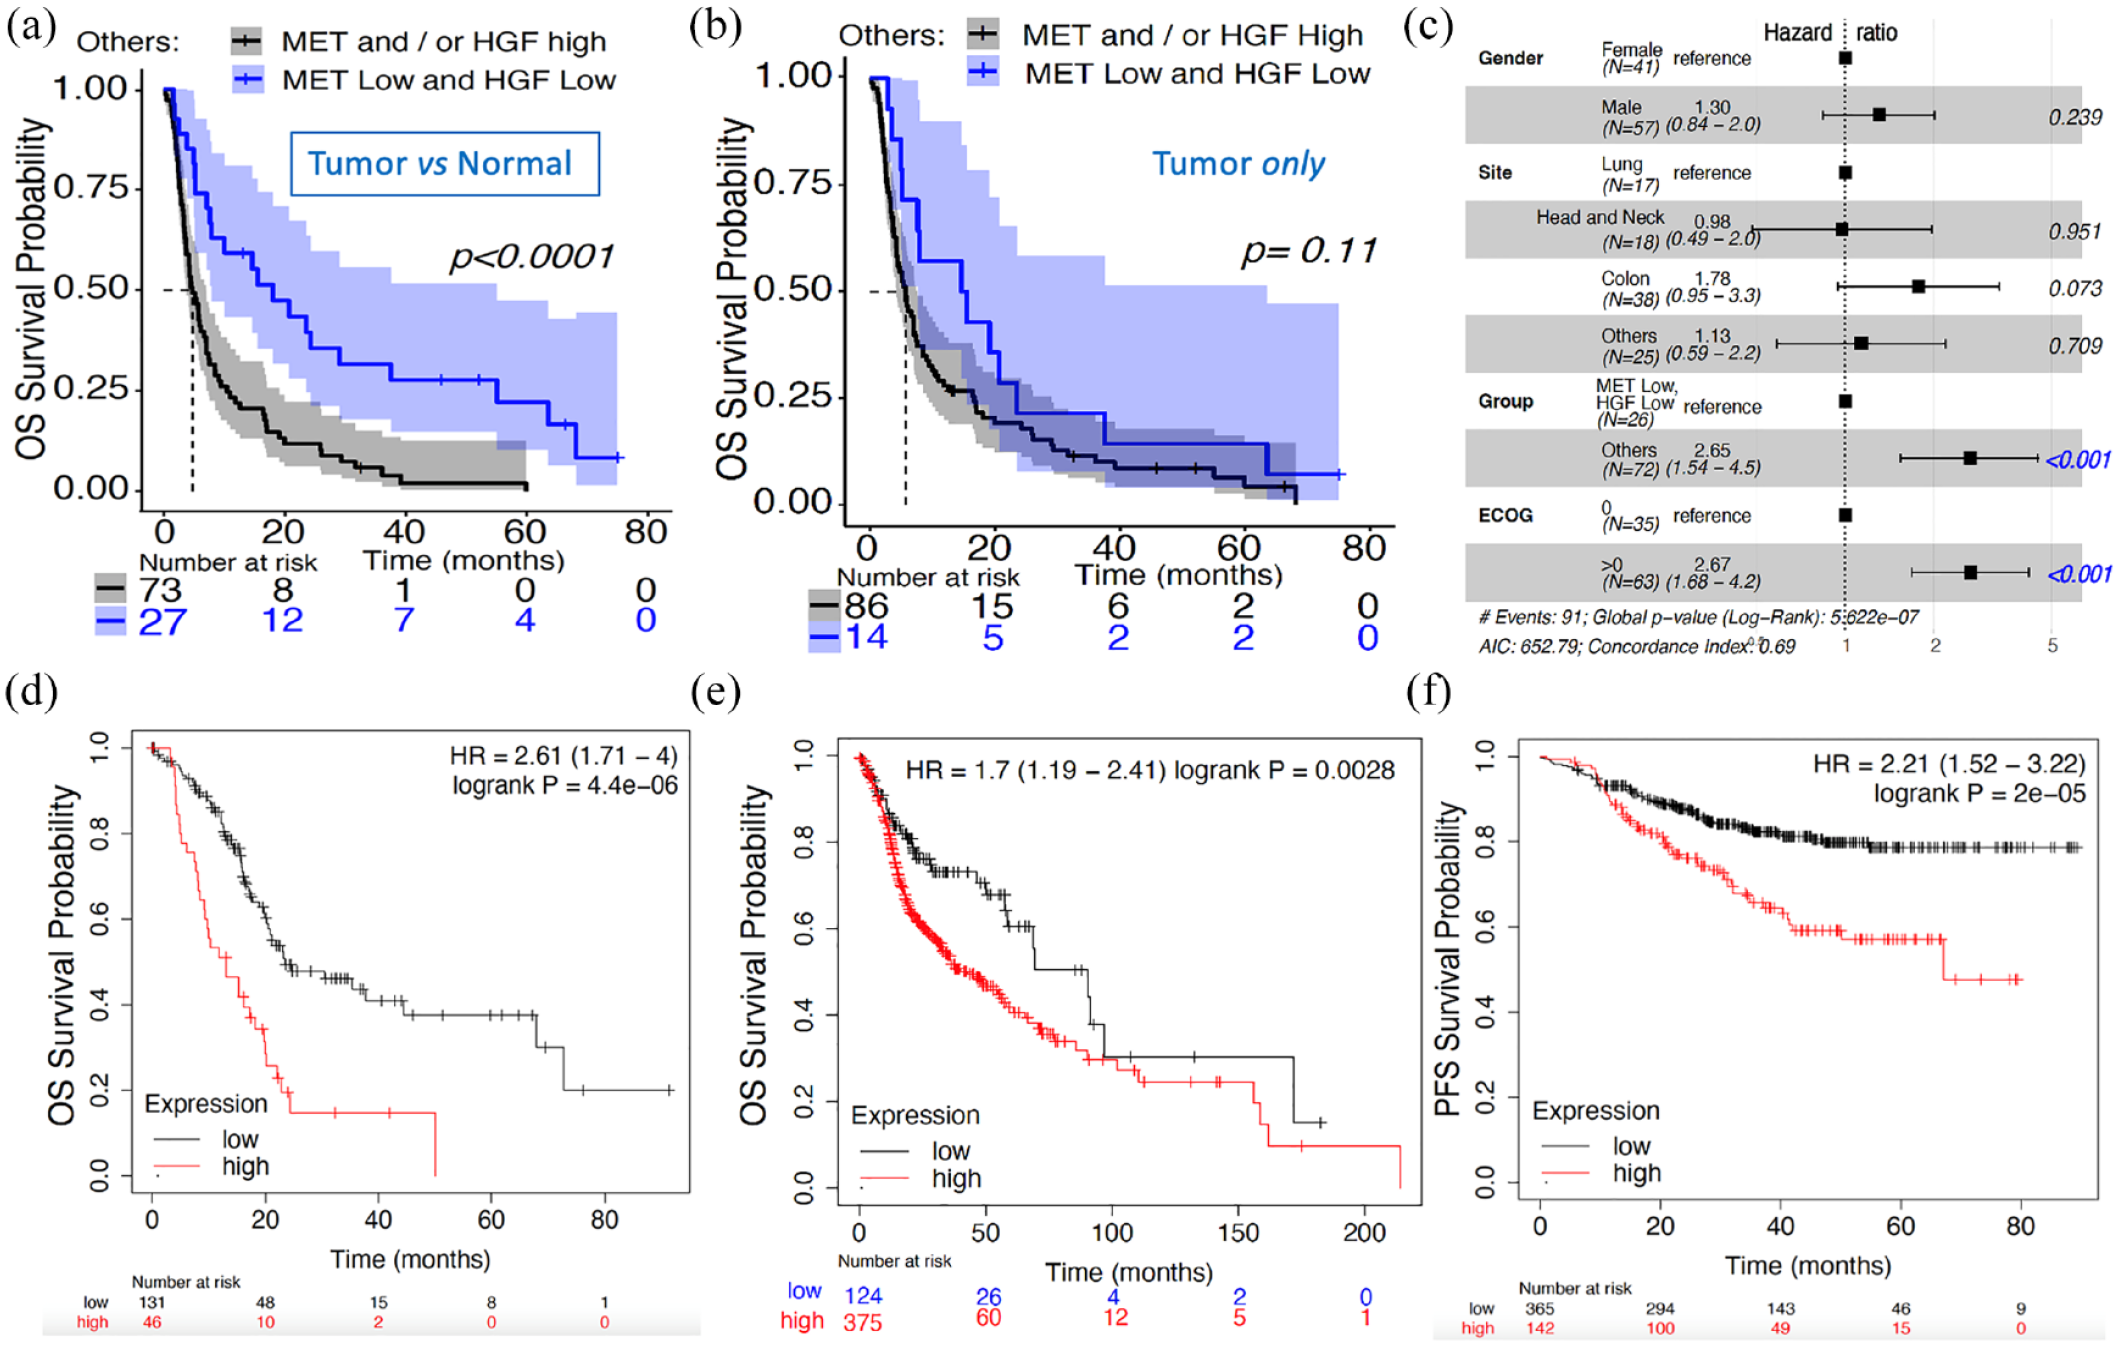
Differential expression (tumor versus normal tissues) and expression in tumor alone to assess prognostic value of MET and HGF. (a) KM OS survival probability of WINTHER patients with high and low differential expression of both MET and HGF based on the tumor and normal tissues: low expression level of both MET and HGF (n = 27, in blue color) with median survival of 18 months; high expression level of MET and/or HGF (n = 73, black color) with median survival of 4.7 months. X-axis: number of patients who were not censored in each time point. The log-rank p value < 0.0001. (b) KM OS survival curve of WINTHER patients with high and low expression of both MET and HGF based on the tumor expression only; low expression level (n = 14, blue color) with median survival of 15 months; high expression level of MET and/or HGF (n = 86, black color) with median survival of 5.7 months. The log-rank p value = 0.11. (c) Forest plot of HR based on a multivariate Cox proportional hazards model based on the tumor and normal tissues. The dotted line displayed at a HR of 1 indicates the HRs of the reference group. Hazard values are with 95% CI. (d) KM of OS survival probability in patients with high and low MET and HGF expression levels explored only in the tumor tissue biopsy in independent RNA-seq dataset of pancreatic ductal adenocarcinoma tumors (n = 177). (e) Independent RNA-seq dataset of HN squamous carcinoma tumors (n = 500). (f) RFS in an independent chip-seq dataset of breast cancers (n = 507). Validation datasets d, e, f available from the KMplotter tool. 21
The association between conventional clinical and biological characteristics of the patients with OS is illustrated by the Forest Plot for the Cox proportional hazard model analysis (Figure 1(c)). This analysis included gender, site/type of the tumor (NSCLC, CRC, HN, and others), ECOG performance score (0 or higher than 0), and the combined expression profile of MET and HGF genes (each classified into high versus low, as determined for each gene by k-means clustering). Taking as reference the combined low differential expression of MET and HGF genes, the HR of the combined high expression of MET and/or HGF was 2.65 with a 95% CI (1.54–4.5; p = 4.04 × 10−04). Site of the tumors was not significantly associated with OS. Taken together, high versus low expression of MET and HGF constitutes an independent prognostic marker, agnostic of tumor type, and type of treatment.
Other validation cohorts were sought to confirm the prognostic significance 21 of MET/HGF expression. Because none could offer both tumor and analogous normal tissue expression, we nevertheless explored several cohorts with tumor expression only based on the observation that there was a similar trend in both types of explorations (tumor versus normal or tumor alone): Figure 1(d) – pancreas carcinomas n = 177 (21 stage 1; 146 stage 2; and 10 unknown); Figure 1(e) – HN carcinomas n = 500 (25 stage 1; 69 stage 2; 78 stage 3; 259 stage 4; and the rest unknown) and Figure 1(f) – breast cancers n = 507 (6% stage 1, 50% stage 2, 29% stage 3, and 15% stage 4). In the breast cancer cohort, the nodal status was 71% positive nodes and 29% negative and ER-positive status concerned 59% patients. Prognostic significance was also confirmed in other types of solid tumors (NSCLC, stomach cancer, sarcomas – data not shown).
PFS predictor for c-MET inhibitors
The DDPP algorithm 16 is a tool that relates the tumor expression (both absolute and relative to normal tissue) of key mechanism-based genes to clinical outcome of patients with cancer of any histology. The DDPP prototype demonstrated that starting with as few as three patients treated with a drug and for whom response to the treatment (PFS) is available, it is feasible to estimate the PFS. Three patients were identified from the WINTHER study who were treated with MET inhibitors: ID005 NSCLC treated with SAR125844 with PFS 10.29 months; ID059 gastric cancer treated with CL1-49076-S49076 with PFS 1.25 months and ID004 HN cancer treated with SAR 125844 with PFS of 0.23 months. The DDPP predictor selection is detailed in section ‘Methods’. Figure 2(a) shows the most significant six gene sets (based on p value and R) selected as the correlator from among more than 50 genes selected based on literature review17,18,20,21: Y = 2.7852X − 5.97 where Y is the median of fold changes tumor versus normal multiplied by the intensity of expression in the tumor for each of the six genes: EZR, GRB2, SPSB3, CRKL, IL1B, and PSENEN, and X is PFS. The predictor performance was R = 1 and p = 0.0037. The reciprocal equation X = (Y + 5.97)/2.7852 was then used to determine the pPFS for all other patients of WINTHER study, if they would have received a c-MET inhibitor. It is important to be clear that the WINTHER patients were not treated with c-MET inhibitors (except for the three patients mentioned earlier) and our data represent an in silico modeling. The predictor did not retain expression of c-MET and HGF, suggesting that they have prognostic but not predictive value. 22 The drivers of the predictive signature are the expression of GRB2, EZR, SPSB3, and IL1B.

Determining the eligible patient population that could benefit from treatment with c-MET inhibitors using the DDPP predictor of PFS. (a) Pearson correlation plot of the six-gene predictor with the PFS of three patients treated with c-MET inhibitors. Y-axis: median value of log2-based fold-changes tumor versus normal multiplied by log1.1 intensity of expression in the tumor for each of the six genes selected; X-axis: PFS in months. (b) Criteria of eligibility. Y-axis: log2 of the fold change tumor versus normal multiplied by the intensity of expression in tumor for MET (blue triangles) and HGF (red dots); X-axis: example of the subcohort of 17 patients with metastatic NSCLC, ordered in increasing expression of MET. Non-logged fold change is shown: blue circles high MET, red circles high HGF, and dotted circles both high MET and high HGF.
Figure 2(b) shows an example of the operationalization of a strategy to select patient for MET inhibitor treatment based on differential expression between tumor versus normal of c-MET and its ligand HGF in a cohort of patients with metastatic NSCLC that does not harbor DNA mutation oncogenic drivers (such as EGFR, ALK, or ROS1 mutations), and estimate the predicted clinical benefit in this population. The main criteria is a fold change in tumor versus normal higher than 1.5 of MET and/or HGF. Values of the fold change <1 of MET may suggest potential toxic effects of MET inhibitors as the action of drugs will be prevalent on normal tissues.
Applying this analysis to 100 patients with various solid tumors from the WINTHER cohort (one patient was excluded from the analysis since the expression of MET of this patient was not available), 61% met this criteria (MET and/or HGF fold change >1.5). The threshold for considering a clinical benefit was objective tumor response or stable disease >6 months.
Our in silico modeling data (Table 1) suggest that the predicted clinical benefit (disease control rate) of >6 months would be overall achieved in 19 patients out of 100 (19%), representing a predicted disease control rate (defined as objective tumor response or stable disease of at least 6-month duration) of 31% (19 patients out of 61 patients with c-MET or HGF fold change tumor versus normal higher than 1.5): CRC 5%, HN 5%, NSCLC 4%, and other types 5%.
Characteristics of eligible patients with a predicted clinical benefit.

WINTHER patients with predicted clinical benefit if they had been treated with c-MET inhibitor (n = 19): ID, age, sex, tumor type, TP53 and RAS status, number of previous lines, ECOG status, the class of drugs given and observed, observed PFS, fold changes tumor versus normal for MET target and its ligand HGF and the pPFS. MET and HGF expressions have no predictive value. Toxicity area for MET fold change tumors versus normal <1.
ECOG, Eastern Cooperative Oncology Group; PFS, progression-free survival; pPFS, predicted PFS.
Most of the patients had tumor harboring mutations of TP53 or RAS. The in silico modeling suggests the possibility of extending the use of c-MET inhibitors for the treatment of metastatic CRC and HN cancer in particular in those malignancies harboring RAS mutation, the latter currently preventing the use of EGFR inhibitor cetuximab. 26 The selection of patients based on c-MET fold change tumor versus normal higher than 1.5 may also present the benefit to avoid the area of toxicity of MET inhibitors.
Clinical study design of c-MET inhibitors in advanced NSCLC and CRC
The conservative hypothesis retained for designing a trial was a clinical benefit of 25% from eligible patients.
Figure 3 shows the steps of the proposed design predicted efficacy of c-MET inhibitors. Considering the probability of good response p1 = 0.25 and a probability of poor response p0 at 0.05%, the number of patients to be included in a prospective study exploring the efficacy of c-MET inhibitors in NSCLC and CRC was calculated using the Simon two-stage approach statistics.27,28 In the example shown above, the optimal number of patients per cohort treated with c-MET inhibitors would be 17 (with 9 patients in the first stage and an additional 8 patients in the second confirmatory stage – subject to responses in the first stage).

(a) Proposed design of a study to confirm predicted efficacy of c-MET inhibitors. (b) All patients enrolled in stage I will be followed for at least 6 months and assessed at months 2, 4, 6 following c-MET inhibitor treatment initiation. If at least one patient in a cohort is observed to have CR, PR, or SD of at least 6 months duration according to RECIST v. 1.1, the cohort will be expanded in stage II to reach a total of 17 patients. If three or more patients out of the 17 are observed to have CR, PR, or SD of at least 6-month duration, the cohort will be declared to have a signal of drug activity. This design enables detection of signs of efficacy, rejecting null hypothesis (ORR < 5%) and retain the alternative hypothesis (ORR > 25%) with 80% power and a one-side type I error rate of 0.05. 36 patients are planned to be treated in the stage I and a maximum of 32 patients in the stage II, bringing a maximum number of patients treated to a total of 68, to assess which of the subcohorts are worth pursuing in phase III.
The selection of the four cohorts was made to fit with the current standard of care for patients with locally advanced or metastatic NSCLC or CRC. Inclusion will be allowed after at least one previous line of therapy. Patients would undergo the tumor tissue biopsy and the analogous normal tissue biopsies (normal bronchial mucosa by bronchoscopy for NSCLC and normal colonic mucosa by endoscopy for CRC). The main inclusion criteria of the proposed trial would be cohort (1) NSCLC with previously treated genomic alterations (HER2 amplification, RAS (G12C) mutation, ROS1, RET fusion, ALK fusion, NTRK fusion, MET exon 14 skipping and EGFR mutation); cohort (2) NSCLC without known actionable genomic alterations; cohort (3) CRC with RAS mutation [including KRAS and NRAS exons 2 (codons 12 and 13), 3 (codons 59 and 61), and 4 (codons 117 and 146)] or BRAF mutation; and cohort (4) CRC with RAS and BRAF wild type.
Immune oncology targets in advanced NSCLC and CRC
Figure 4 presents the Forest plot of HRs of PFS based on a multivariate Cox proportional hazards model based on the expression of key immune regulatory genes in tumor and normal tissues in NSCLC and CRC. This analysis suggests that inhibitors of TIGIT, CTLA4, TIM3, LAG3, and PDL1 have the greatest potential to improve outcome in NSCLC, consistent with data reported by recent clinical trials. High expression of TIGIT in tumor compared with normal bronchial mucosa had the most significant association with poor outcome: HR, 6.4 × 1002 with 95% CI (5.3–7.8 × 1004) and p value 0.008, followed by CTLA4, TIM3, and LAG3. In patients with metastatic CRC only, high expression of TLR4 had a significant association with shorter OS: HR, 4.73 with 95% CI, 4.73 (1.47–15.27) and p value 0.009. In contrast with NSCLC, exploration of TIM3 inhibitors would be of low priority in this population. Expression of IO targets was found to not depend on ECOG status and were independent prognostic variables.

Prognostic value of immune check point targets. Forest plot of HRs of PFS based on a multivariate Cox proportional hazards model based of relative gene expression in tumor and normal tissues. The dotted line displayed at a HR of 1 indicates the HRs of the reference group. Hazard values are with 95% CI. (a) Evaluation of prognostic value of IO targets in metastatic CRC. (b) Evaluation of prognostic value of IO targets in metastatic NSCLC.
Discussion
The current model of clinical drug development in oncology displays a major limitation due to a very high exclusion rate in patient enrollment in early phases, and a high attrition of drugs in phase III. 1 The rationale for selecting a compound to enter in phase III is usually informed by (1) preclinical evidence of bioactivity; (2) medical needs; (3) clinical trial results in one or a limited number of pathologies; and (4) limited drug–gene variant match (or none), most of the time based on DNA investigation, and in some cases based on immunohistochemistry or fluorescent in situ hybridization testing. This approach usually results in a high patient attrition rate because even when positive selection criteria are used, they are mostly based on DNA analysis, and mostly in lung cancers, and the frequency of the potential drug targets is usually low in the population (3–5%).8,17 As a consequence, most of the patients screened cannot be enrolled and only a minority end up being treated, pointing the need of continuing explorations to optimize the use of drugs such as MET inhibitors. 29
Our hypothesis was that transcriptomics might increase the fraction of patients that could benefit from c-MET inhibitors based on assessment of prognostic value of the high expression of MET and of its ligand HGF. The second step of our strategy consisted in building a predictor of the PFS for treatments with c-MET inhibitors. The predictor presented was built using the recently published DDPP algorithm 16 and was based on vectorial summation of expression of six genes out of more than 50 relevant genes for MET pathway selected based on literature review.30–33 The predictor did not retain the expression of c-MET and HGF, suggesting that they have prognostic but not predictive value 29 for the efficacy of treatments with c-MET inhibitors. The drivers of the predictor signature are the expression of GRB2, EZR, SPSB3, and IL1B which are key genes in the MET pathway. Indeed, recruitment of GRB2 by MET leads to the activation of several signaling cascades including the RAS-ERK, PI3 kinase-AKT, or PLCgamma-PKC. 30 SPSB3 is a component of E3 ubiquitin–protein ligase complex which mediates the ubiquitination and subsequent proteasomal degradation of target proteins. 31 The involvement of the ubiquitin degradation pathway is particularly relevant as the mechanism of MET exon 14 skipping activation consists of generation of a functional but more stable protein. EZR plays a key role in cell surface structure adhesion, migration, and organization, and it has been implicated in various human cancers. 32 IL1B may link MET pathway to immune status of tumor enrironment. 33 Altogether, the predictor retained genes highly significant for the biological role in the MET pathway.
Based on our DDPP predictor, we calculated the pPFS and modeled in silico the potential clinical benefit for patients with various types of metastatic solid tumors harboring an overexpression of MET or HGF with a fold change higher than 1.5 in tumors as compared with histologically matched normal tissue biopsies. The predicted clinical benefit was found to be higher in patients whose tumors harbor TP53 wild type and RAS mutation. The in silico modeling of the predicted efficacy enabled design of a trial aiming to optimize clinical development through matching tumor patients and drugs and identifying early signs of efficacy prior to expanding cohorts. The conservative hypothesis to be tested was a predicted disease control rate of 25% (defined as objective tumor response or stable disease of at least 6-month duration) of eligible patients. By testing DDPP predictors previously developed for other treatments, it was shown that patients had multiple other therapeutic options. Meaning, patients not eligible or lacking any predicted benefit of a particular drug might benefit by other therapeutic options such as use of FGFR inhibitors, anti PD-1, MEK, or Pan HER inhibitors.
The exploration of the prognostic value of important IO targets (PDL1, CTLA4, TIGIT, TIM3, LAG3, TLR4, and ICOS) revealed very important differences between patients with metastatic NSCLC and CRC, suggesting a rationale for selection of patients for different therapy approaches based on differential expression of these genes between normal tissues. The profile in NSCLC suggests that the use of TIGIT, CTLA4, TIM3, LAG3, and PDL1 inhibitors may have the greatest clinical benefit, consistent with data reported in recent trials. In contrast, the expression of these targets is not associated with adverse clinical outcome of patients with CRC. Instead, our data suggest a potential intervention with anti-TLR4 drugs in the management of metastatic CRC patients.
The key to improving the drug development process will rely on the use of new biomarker strategies to navigate patients to matched therapies in a personalized manner, clinical trial designs aiming to detect early signs of efficacy and diminishing patient attrition rate, optimization of the number of patients, and definition of cohorts. This armamentarium in combination will likely reduce time and cost of trials while enhancing their efficacy.
To improve and accelerate the clinical development of novel therapeutic drugs, we present a novel concept and tool for planning clinical trials with the objective to increase the efficacy of the exploratory phase of development (conventionally defined as phase I and phase II studies) aiming to reduce the failure rate in the confirmatory phase of development (conventionally known as phase III).
Our proposal builds upon multiple foundational ongoing trials that demonstrate the feasibility of implementing precision oncology such as MD Anderson Phase I initiative IMPACT1 study,34,35 ASCO’s TAPUR trial, 36 the NCI Molecular Profiling based Assignment of Cancer Therapeutics (M-PACT) study (NCT01827384), the UT MD Anderson IMPACT-2 study (NCT02152254), 37 the Lung Cancer Master Protocol (LungMap) study (NCT02154490), 38 the NCI Molecular Analysis for Therapy Choice (MATCH) Trial (NCT02465060), and others.39–43 The main difference of our approach consists in use of transcriptomics for patient selection. This approach based on tumor and analogous normal tissue procurement was successfully implemented in the WINTHER trial 15 after necessary training on the workflow, and was well accepted and tolerated by patients. In the trial, the WINTHER algorithm was proposing a list of drugs ranked by order of presumed efficacy. However, the vast majority of patients were not able to be treated with the best matched drug due primarily to the fact that the drug or clinical trial was not available in the country/hospital at the time of the trial. Here, the approach described displays important differences compared to the WINTHER trial. The four-step method proposed to improve the clinical drug development and expand drug indications and therapeutic options for patients includes (1) evaluation of prognostic value of each target, (2) definition of criteria of patient selection for inclusion in a trial based on activation of the target (overexpression in tumor as compared to analogous normal tissue, (3) the use of Simon’s two-stage design, to detect signals of efficacy (with early futility rules if there is no therapeutic benefit), and (4) Use of the DDPP algorithm to predict duration of response to a drug.
While each individual step in our approach is based on previously published tools, this is the first time that all components have been integrated to offer in silico modeling aiming at optimizing patient selection for clinical trials in oncology. The major limitation of this work lies in its retrospective nature. Further prospective studies are needed to validate a robust predictive model using the DDPP algorithm. DDPP, until fully validated, would only be used to assess in silico the population of patients that would potentially benefit from the therapeutic intervention.
Another limitation is that for building the DDPP predictor model outcome data on a minimum of three patients treated with the drug is needed. In the case of new drugs, this would imply that data from initial studies have to be used, that could include phase I studies.
In conclusion, we presented an integrated process based on transcriptomics in which interpatient variability is controlled by the use of dual tumor and organ-matched normal tissue biopsies. The approach consists in defining eligibility criteria, estimating in silico the potential clinical benefit for any drug alone or in combination and designing the optimal clinical trial to test the retained hypotheses. This process is expected to dramatically decrease the attrition of patient enrollment and to simultaneously increase the speed and detection of early signs of efficacy. Altogether, our model aims to overcome the limits of current approaches.
Footnotes
Acknowledgements
We thank all the patients for their participation in WINTHER study In memory of Gaspard Bresson.