
Abstract
Introduction:
Glioblastoma (GBM), isocitrate dehydrogenase (IDH) wild-type (IDHwt), and grade 4 astrocytomas, IDH mutant (IDHmut), are the most common and aggressive primary malignant brain tumors in adults. A better understanding of the tumor immune microenvironment may provide new biomarkers and therapeutic opportunities.
Objectives:
We aimed to evaluate the expression profile of 730 immuno-oncology-related genes in patients with IDHwt GBM and IDHmut tumors and identify prognostic biomarkers and a gene signature associated with patient survival.
Methods:
RNA was isolated from formalin-fixed, paraffin-embedded sections of 99 tumor specimens from patients treated with standard therapy. Gene expression profile was assessed using the Pan-Cancer Immune Profiling Panel (Nanostring Technologies, Inc., Seattle, WA, USA). Data analysis was performed using nSolverSoftware and validated in The Cancer Genome Atlas. In addition, we developed a prognostic signature using the cox regression algorithm (Least Absolute Shrinkage and Selection Operator).
Results:
We found 88 upregulated genes, high immunological functions, and a high macrophage score in IDHwt GBM compared to IDHmut tumors. Regarding IDHwt GBM, we found 24 upregulated genes in short-term survivors (STS) and overexpression of CD274 (programmed death-ligand 1, PD-L1). Immune pathways, CD45, cytotoxic, and macrophage scores were upregulated in STS. Two different prognostic groups were found based on the 12-gene signature (CXCL14, PSEN2, TNFRSF13C, IL13RA1, MAP2K1, TNFSF14, THY1, CTSL, ITGAE, CHUK, CD207, and IFITM1).
Conclusion:
The elevated expression of immune-oncology-related genes was associated with worse outcome in IDHwt GBM patients. Increased immune functions, CD45, cytotoxic cells, and macrophage scores were associated with a more aggressive phenotype and may provide promising possibilities for therapy. Moreover, a 12 gene-based signature could predict patients’ prognosis.
Importance of the study
The investigation of the expression profile of 730 immune oncology-related genes in GBM by nCounter performed in the present study revealed substantial differences between IDH wild-type (IDHwt) and IDH mutant tumors. Importantly, the analysis of the differences in gene expression, immunological functions, and cell type score between short-term survivors and long-term survivors IDHwt GBM provided important immune factors associated with tumor aggressiveness, which were further validated in public datasets. The 12-gene signature identified by the cox regression method can lead to better patient prognostication. Finally, the elevated immune functions and immune cell type score observed in short-term survivors should also offer new opportunities for therapy.
Introduction
Glioblastoma (GBM) (grade 4 glioma) is the most common primary malignant brain cancer in adults, accounting for 14.6% of all central nervous system tumors, and shows the highest mortality rate in this group.1,2 According to the World Health Organization (WHO 2021), GBM are grade 4 diffuse astrocytic tumors wild-type for isocitrate dehydrogenase (IDH1/2), with one or more features: microvascular neovascularization, necrosis, +7/-10 copy number changes, EGFR amplification, or TERT promoter mutation. 2 IDH1/2 wild-type (IDHwt) GBM arises ‘de novo’, accounting for 90% of cases, affects older patients (median, 62 years), and is associated with poor prognosis, with a median overall survival (OS) of 15 months. 3 In the new 2021 classification, grade 4 astrocytomas with mutations in IDH1/2 (IDHmut) are no longer considered GBM. 2 These tumors arise from the progression of lower grade astrocytomas (WHO grade 2 and 3), usually affecting younger adults (median, 44 years) and exhibiting a median OS of 31 months. 3 The identification of CDKN2A/B co-deletion in diffuse astrocytomas is associated with a poor prognosis and leads to the classification of grade 4, independent of necrosis or microvascular proliferation. 2 Moreover, transcriptomic studies of GBM have identified different molecular subgroups: Classical (EGFR alterations), proneural (PDGFRA/IDH1 abnormalities), and mesenchymal (NF1 alterations). 4
The rapid and infiltrative growth pattern of GBM cells in the brain parenchyma renders complete gross surgical resection impossible, leading to the inevitable recurrence of therapy-resistant tumor cells. 5 Standard therapy comprises the maximum tumor gross resection followed by radiation therapy and concomitant/adjuvant temozolomide (TMZ). 6 Tumor-treating fields increase patient survival and also can be employed for GBM treatment. 7 The dismal prognosis of GBM is partly due to tumor heterogeneity and the multiplicity of altered oncogenic pathways in tumor cells. 8 Importantly, some prognostic biomarkers are reported, the O6-methylguanine-DNA methyltransferase (MGMT) methylation status is one of the most widely used biomarkers. 9
Despite extensive clinical studies using various agents, patient survival has not significantly improved. 5 In recent years, many studies have demonstrated that understanding the tumor microenvironment (TME) and the immunological factors involved in tumor development and progression may provide promising and new possibilities for immunotherapy. These approaches include cancer vaccines, oncolytic viruses, chimeric antigen receptor T cells, and immune checkpoint blockade. 8
Immunotherapy has revolutionized the treatment of some cancer types in recent years. However, so far, immunotherapies seem to have limited efficacy for brain tumors. 10 This is probably associated with the malignant cell heterogeneity, the immunosuppressive microenvironment, and the challenges of efficient drug access across the blood–brain barrier. 10
Infiltrating immune cells in gliomas, such as lymphocytes, microglia, and tumor-associated macrophages (TAMs), may comprise more than 30% of the tumor mass and have an important role in immunosuppression, tumor development, and progression. 11 The study of the GBM immune microenvironment may provide new therapeutic concepts and lead to the discovery of novel prognostic and treatment-responsive biomarkers.
In the current survey, we evaluated the expression profile of 730 immune-oncology-related genes using the Pan-Cancer Immune Profiling Panel (NanoString Technologies, Inc., Seattle, WA, USA) in 99 samples from patients diagnosed with IDHwt GBM and grade 4 astrocytoma IDHmut, treated with standard of care. We evaluated the differences in gene expression profiles, immune pathways, and cell type scores between IDHwt GBM versus IDHmut (grade 4 astrocytoma, IDH mutant), and its association with the patient’s survival. We found that elevated expression of immune-oncology-related genes was associated with poor survival and identified a 12-gene prognostic signature.
Materials and methods
Selection of GBM cases
We included 86 IDHwt GBM and 13 grade 4 astrocytoma, IDHmut specimens diagnosed at Barretos Cancer Hospital (BCH), Barretos, Brazil, from 2009 to 2018 and treated according to the standard therapy protocol: surgery, radiotherapy, and concomitant/adjuvant TMZ-based chemotherapy and with available formalin-fixed, paraffin-embedded (FFPE) samples for molecular analysis. Tumor specimens were reviewed by two experienced neuropathologists. These patients were previously characterized molecularly for IDH1 mutation status, ATRX expression, TERT promoter mutations, and MGMT methylation. 9 The clinicopathological and molecular features are summarized in Supplemental Table 1. The 13 grade 4 astrocytomas, IDH mutant included in the present study, showed microvascular proliferation, necrosis, and IDH1R132H mutation. IDH2 mutations and CDKN2A/B codeletion were not evaluated. This study was approved by the institutional review board (IRB) from BCH (IRB 1604/2018).
Microsatellite instability analysis
Microsatellite instability (MSI) evaluation was performed using a multiplex polymerase chain reaction (PCR; Qiagen Multiplex Kit, Venlo, The Netherlands) comprising the following six quasi-monomorphic mononucleotide repeat markers: BAT-25, BAT-26, NR- 21, NR-24, NR-27, and HSP110. 12 PCR was performed using 0.5 µL of DNA at 50 ng/mL using reverse primers end-labeled with fluorescent dyes as previously described. 12 The quasimonomorphic variation range of each marker was established from an average of the allele size with a range of ±3 nucleotides.12,13
RNA and DNA isolation
Nucleic acid isolation was performed from macrodissected FFPE GBM as reported. 9 The tumor area was previously marked by an experienced pathologist, ensuring the presence of >80% of tumor cells and the absence of microvascular proliferation and necrosis. DNA isolation was performed using the QIAamp DNA Mini Kit (Qiagen, Venlo, The Netherlands), and NanoDropVR 2000 (Thermo Scientific, Waltham, MA, USA) was used for DNA quantification according to the manufacturer’s instructions.
RNA isolation was performed using the RNeasy Mini Kit (Qiagen, Venlo, The Netherlands), and the Qubit 2.0 Fluorometer (RNA HS Assay kit, Life Technologies, Thermo Fisher Scientific, Waltham, MA USA) was applied for RNA quantification following the manufacturer’s recommendations.
Gene expression experiments
Gene expression assays were performed in the nCounter® FLEX Analysis System available in the Molecular Oncology Research Center of BCH using the nCounter® Pan-Cancer Immune Profiling Panel (NanoString Technologies, Inc.). This panel comprises 40 reference genes and 730 immuno-oncology-related targets, including 109 cell surface markers for 14 immune cell types 14 (Supplemental Table 2). The complete list of the Pan-Cancer Immune Profiling Panel is available at https://www.nanostring.com/products/ncounter-assays-panels/oncology/pancancer-immune-profiling/.
The NanoString assays were performed using 150 ng of RNA, 5 µL of hybridization buffer, 3 µL of reporter probe, and 2 µL of capture probe per sample. The hybridization reaction was performed for 24 h at 65ºC in a thermocycler (ProflexTM PCR System, Applied Biosystems, Foster City, CA, USA). Cartridge scanning was performed with 555 fields of view in the nCounter® Digital Analyzer (NanoString Technologies, Seattle, WA, USA).
NanoString data analysis
The nSolver™ Analysis Software v4.0 (NanoString Technologies®) was applied to evaluate quality control parameters such as binding density, the limit of detection, and positive controls. In addition, the raw data were evaluated in the R statistical environment (version 3.6.3) with the Quantro package (version 1.18.0) to guide the normalization process. No quality control flags were detected, and all 99 samples were included in further analysis. Housekeeping selection, normalization, differential expression, and immune-oncology-related scores calculation were performed in the Advanced Analysis module from the nSolver™ Analysis Software v4.0 (NanoString Technologies®).
The geNorm algorithm implemented in the advanced analysis module was used for the automatic selection of the housekeeping genes for data normalization. The cutoff to consider differentially expressed genes was the adjusted p value less than 0.1. Further statistical analyses of the pathway and cell type scores were performed using the nonparametric Mann–Whitney test for independent samples (IBM SPSS 2.3 version).
Pathway images were generated using the Kyoto Encyclopedia of Genes and Genomes (KEGG), available in the nSolver Advanced Analysis module. Normalized data of differentially gene expression data were downloaded from the nSolver software for survival analysis of IDHwt GBM.
Analysis of differentially expressed immune-oncology genes in IDHwt GBM and survival in public databases
To evaluate the association between OS and median mRNA expression for GBM patients from The Cancer Genome Atlas (TCGA) dataset, we used the cBioPortal (RNAseq: Legacy 2013 and Harmonized 2018) (https://www.cbioportal.org/) and the Betastasis (microarray: Affymetrix HT HG U133A and Human Exon 1.0 ST) (http://www.betastasis.com/) webservers. The differentially expressed genes identified for the IDHwt GBM STS group were evaluated in the public databases, with the median expression was applied to split groups for the Kaplan–Meier curves (log-rank test). The null hypothesis was rejected when p < 0.05.
Analysis of differentially expressed immune checkpoints genes in IDHwt GBM
We analyze five major immune checkpoint-related genes PDCD1 (PD-1), CD274 (PD-L1), CTLA4, IDOL1, and LAG3 in IDHwt GBM STS and LTS. The Mann–Whitney nonparametric test (SPSS IBM software) was applied to evaluate the possible differences using the normalized mRNA counts. Significant differences were considered when p < 0.05.
Establishment of a prognostic signature for IDHwt GBM
Normalized data from nSolver analysis of the 86 IDHwt GBM samples were applied to define a prognostic signature based on the nCounter® Pan-Cancer Pathways Panel using the R statistical environment (version 3.6.3). First, univariate analyses were performed to select genes significantly associated with survival (Survival package, version 3.2-7). The selected genes were applied in the Least Absolute Shrinkage and Selection Operator (LASSO) regression with Cox proportional hazards model using the glmnet package (version 4.1). 15 Leave-one-out cross-validation was carried out to select the λ value with minimum mean cross-validated error (λmin). The risk score based on the coefficients of the regression was calculated and used to classify the patients into low- and high-risk groups using the median value of the risk scores. Kaplan–Meier curves were built with the survminer package (version 0.4.8), and time-dependent ROC (receiver operator characteristic) curves were built with the timeROC package (version 0.4). C-indexes were calculated using the suvcomp package (version 1.34.0).
Results
Clinical and molecular characteristics of GBM patients
The clinical and molecular data from GBM patients included in the present study (n = 99) were recently reported in a larger cohort. 9 The frequencies of the clinical and molecular features of the GBM cohort included in the present study are summarized in Supplemental Table 1.
The 86 IDH1wt GBM patients showed a median OS of 15.87 months and a progression-free survival (PFS) of 7.83 months (Supplemental Figures 1(a) and (b)). The 13 grade 4 astrocytomas IDHmut (13.1%) patients showed a median OS of 35.45 months and a PFS of 18.13 months (Supplemental Figures 1(c) and (d)). Total surgical resection (p = 0.004159), age less than 40 years (p = 0.028151), MGMT methylation (p = 0.000010), and high MGMT mRNA expression (0.000024) were associated with higher OS (Supplemental Table 3; Supplemental Figure 2).
Since MSI is currently an agnostic marker of immunotherapy decision-making, and some studies, including our group 16 , showed its presence in GBM, we performed molecular analysis for MSI. The MSI status was conclusive in 90 cases, and all cases showed no MSI (Supplemental Table 1).
Differentially expressed genes in IDHwt GBM compared to IDHmut grade 4 astrocytoma
We initially compared the expression of the immune-oncology-related gene panel in IDHwt GBM (n = 86) versus IDHmut (n = 13). The heatmap of normalized data generated via unsupervised clustering of the two groups (Figure 1(a)) and the Volcano plots showed the differentially expressed genes in IDHwt GBM compared to IDHmut (Figure 1(b)). We found 97 significant differentially expressed genes, 88 upregulated, and nine downregulated in IDHwt GBM compared with IDHmut (Supplemental Table 4).

DE genes, pathways, and cell type scores in IDHwt GBM (n = 86) and grade 4 astrocytoma IDHmut (n = 13). (a) Heatmap of normalized gene expression data generated via unsupervised clustering. The first four horizontal bars show the positive control: QC, binding density QC, imaging QC, and QC flags. Yellow means no QC flags. The orange bar and gray bar indicate the grade 4 astrocytomas, IDHmut, and IDHwt GBM samples, respectively. Inside the heatmap, the box, yellow squares indicate high mRNA expression, and blue indicates low expression. (b) Volcano plot displaying each gene’s −log10(p-value) and log2 fold change in IDHwt GBM compared to IDHmut tumors (baseline). DE genes with high statistical significance are shown from the bottom to the top. The threshold is indicated for the horizontal red line (adjusted p < 0.10). The more the left, the lower the expression, and the more the right, the greater the gene expression in IDHwt GBM compared to IDHmut tumors. (c) The heatmap of pathway scores orange indicates a high score and blue low scores. The vertical bar on the left indicates the GBM samples IDHwt in gray and IDHmut in orange. (d) Line graphics show each pathway’s average score across values between IDHwt and IDHmut. (e) Cell cycle pathway score upregulated in IDHwt GBM compared to IDHmut tumors. (f) Macrophage score based on the higher and correlated mRNA expression of macrophage markers in IDHwt GBM compared to IDHmut tumors. Mann–Whitney test was applied for statistical analysis (p < 0.05).
Immunological functions are upregulated in IDHwt GBM compared to grade 4 astrocytoma, IDHmut
The differentially expressed genes were further evaluated by their specific immune pathways. Apart from microglial and toll-like receptor (TLR) functions, all other immune functions were upregulated in IDHwt GBM compared to IDHmut (Figure 1 (c) and (d)); (Supplemental Table 5). The most significantly upregulated pathway score in IDHwt GBM compared to IDHmut was the cell cycle score (p < 0.01) (Figure 1(e)). Moreover, the analysis of the cell type score showed the high macrophage score in IDHwt GBM compared to IDHmut tumors (p = 0.021) (Figure 1(f)).
Using the KEGG, we analyzed the pathways in cancer and found that the VEGF, TGFB, interleukin (IL)-8, COX-2, cytokine receptor, and ITGA are upregulated in IDHwt GBM (yellow nodes) compared to IDHmut tumors (Supplemental Figure 3).
High expression of immuno-oncology genes in IDHwt GBM was observed in short-term survivors
Based on the patient’s OS, we further divided the IDHwt GBM patients into short-term survivors (STS, less than 1 year) and long-term survivors (LTS, more than 3 years). This led to 26 STS (median OS = 7.95 months) and 11 LTS (median OS = 42.94 months) patients.
Comparisons of differentially expressed genes between both groups showed overexpression of immune-oncology-related genes in STS (Figures 2(a) and (b)). In all, 24 genes were overexpressed, and two were downregulated in STS compared with LTS (Table 1). Kaplan–Meier analysis also showed significant differences in OS in 20 of 24 of the differentially expressed genes in IDHwt GBM STS and LTS groups. Except for MARCO, TGFB2, TFEB, and CCND3, all other 20 differentially expressed genes were also correlated with median OS in our cohort (n = 86) (Table 1). The 24 differentially expressed genes were further analyzed in the TCGA database. These analyses showed that 18 of 24 genes were significantly associated with GBM survival in at least one TCGA dataset (Table 1).
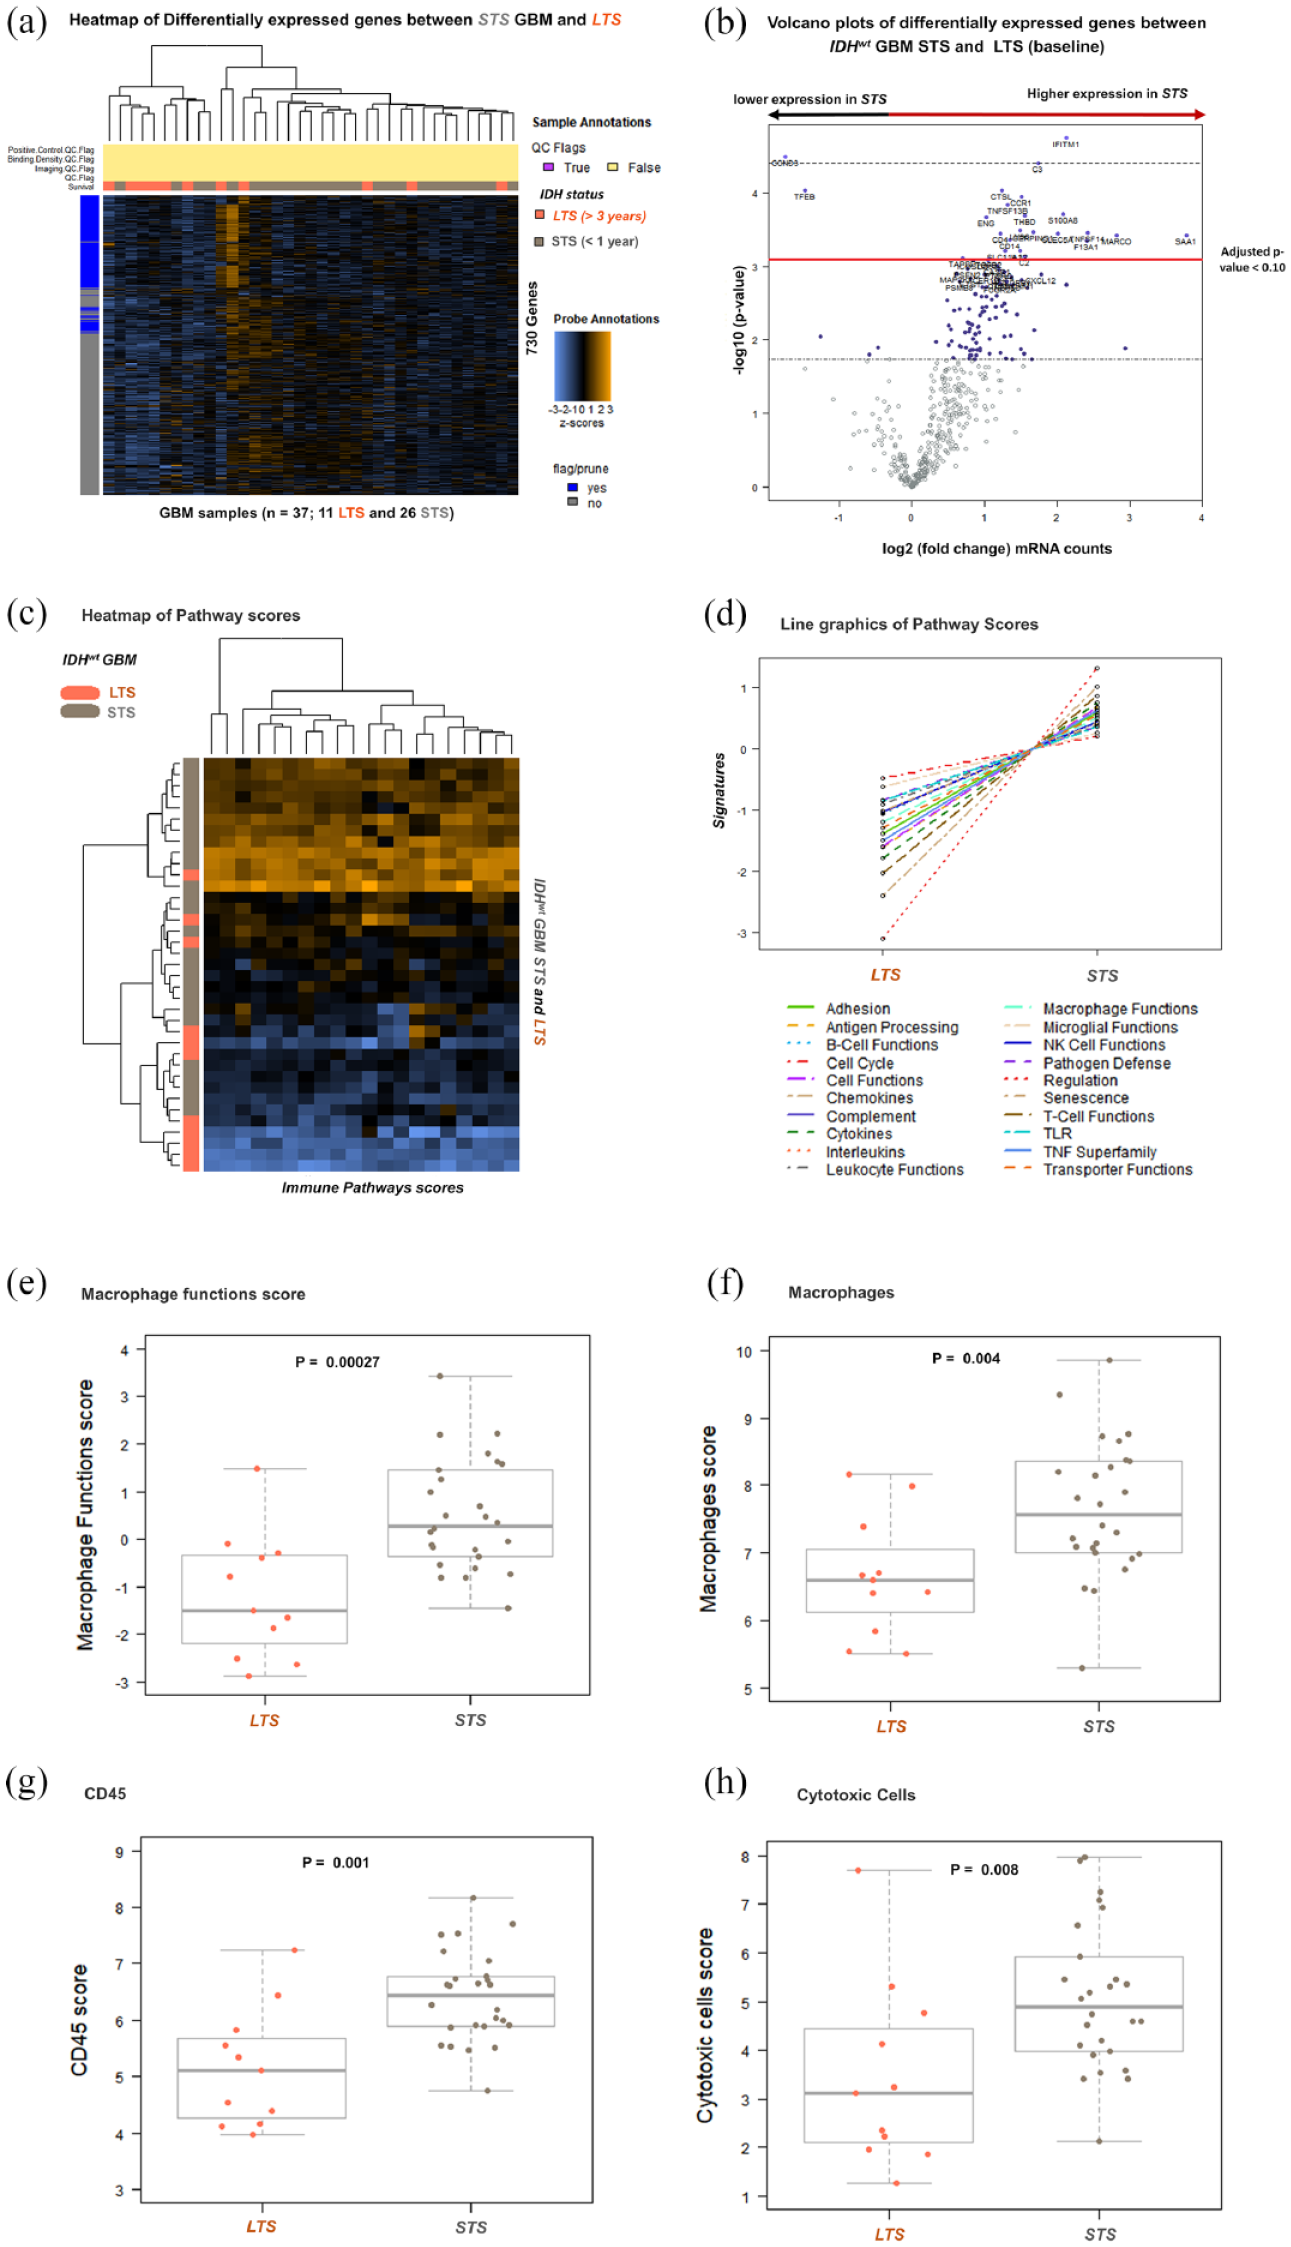
DE genes, pathways scores, and cell type scores in IDHwt GBM LTS and STS. (a) Heatmap of normalized gene expression data generated via unsupervised clustering. In orange are represented the LTS (n = 11), and in gray, the STS (n = 26). (b) Volcano plot displaying each gene’s −log10 (p-value) and log2 fold change in STS compared to LTS (baseline). Genes on the right and above the red line (adjusted p < 0.1) are upregulated in STS (n = 24), and genes above the red line on the left are downregulated in STS. (c) The heatmap of pathway scores. Yellow squares indicate a high pathway score, and blue indicates a low pathway score. The vertical bar on the left indicates the GBM samples. The 26 STS are marked in grey, and the 11 LTS in orange. (d) Line graphics show each pathway’s average score across values between LTS and STS. (e) The macrophage functions score. (f) Macrophages score. (g) CD45 score. (h) Cytotoxic cells score.
Description of IDHwt GBM survival-associated genes found with the nanostring Pan-Cancer Immune Profiling Panel and survival evaluation using public databases.
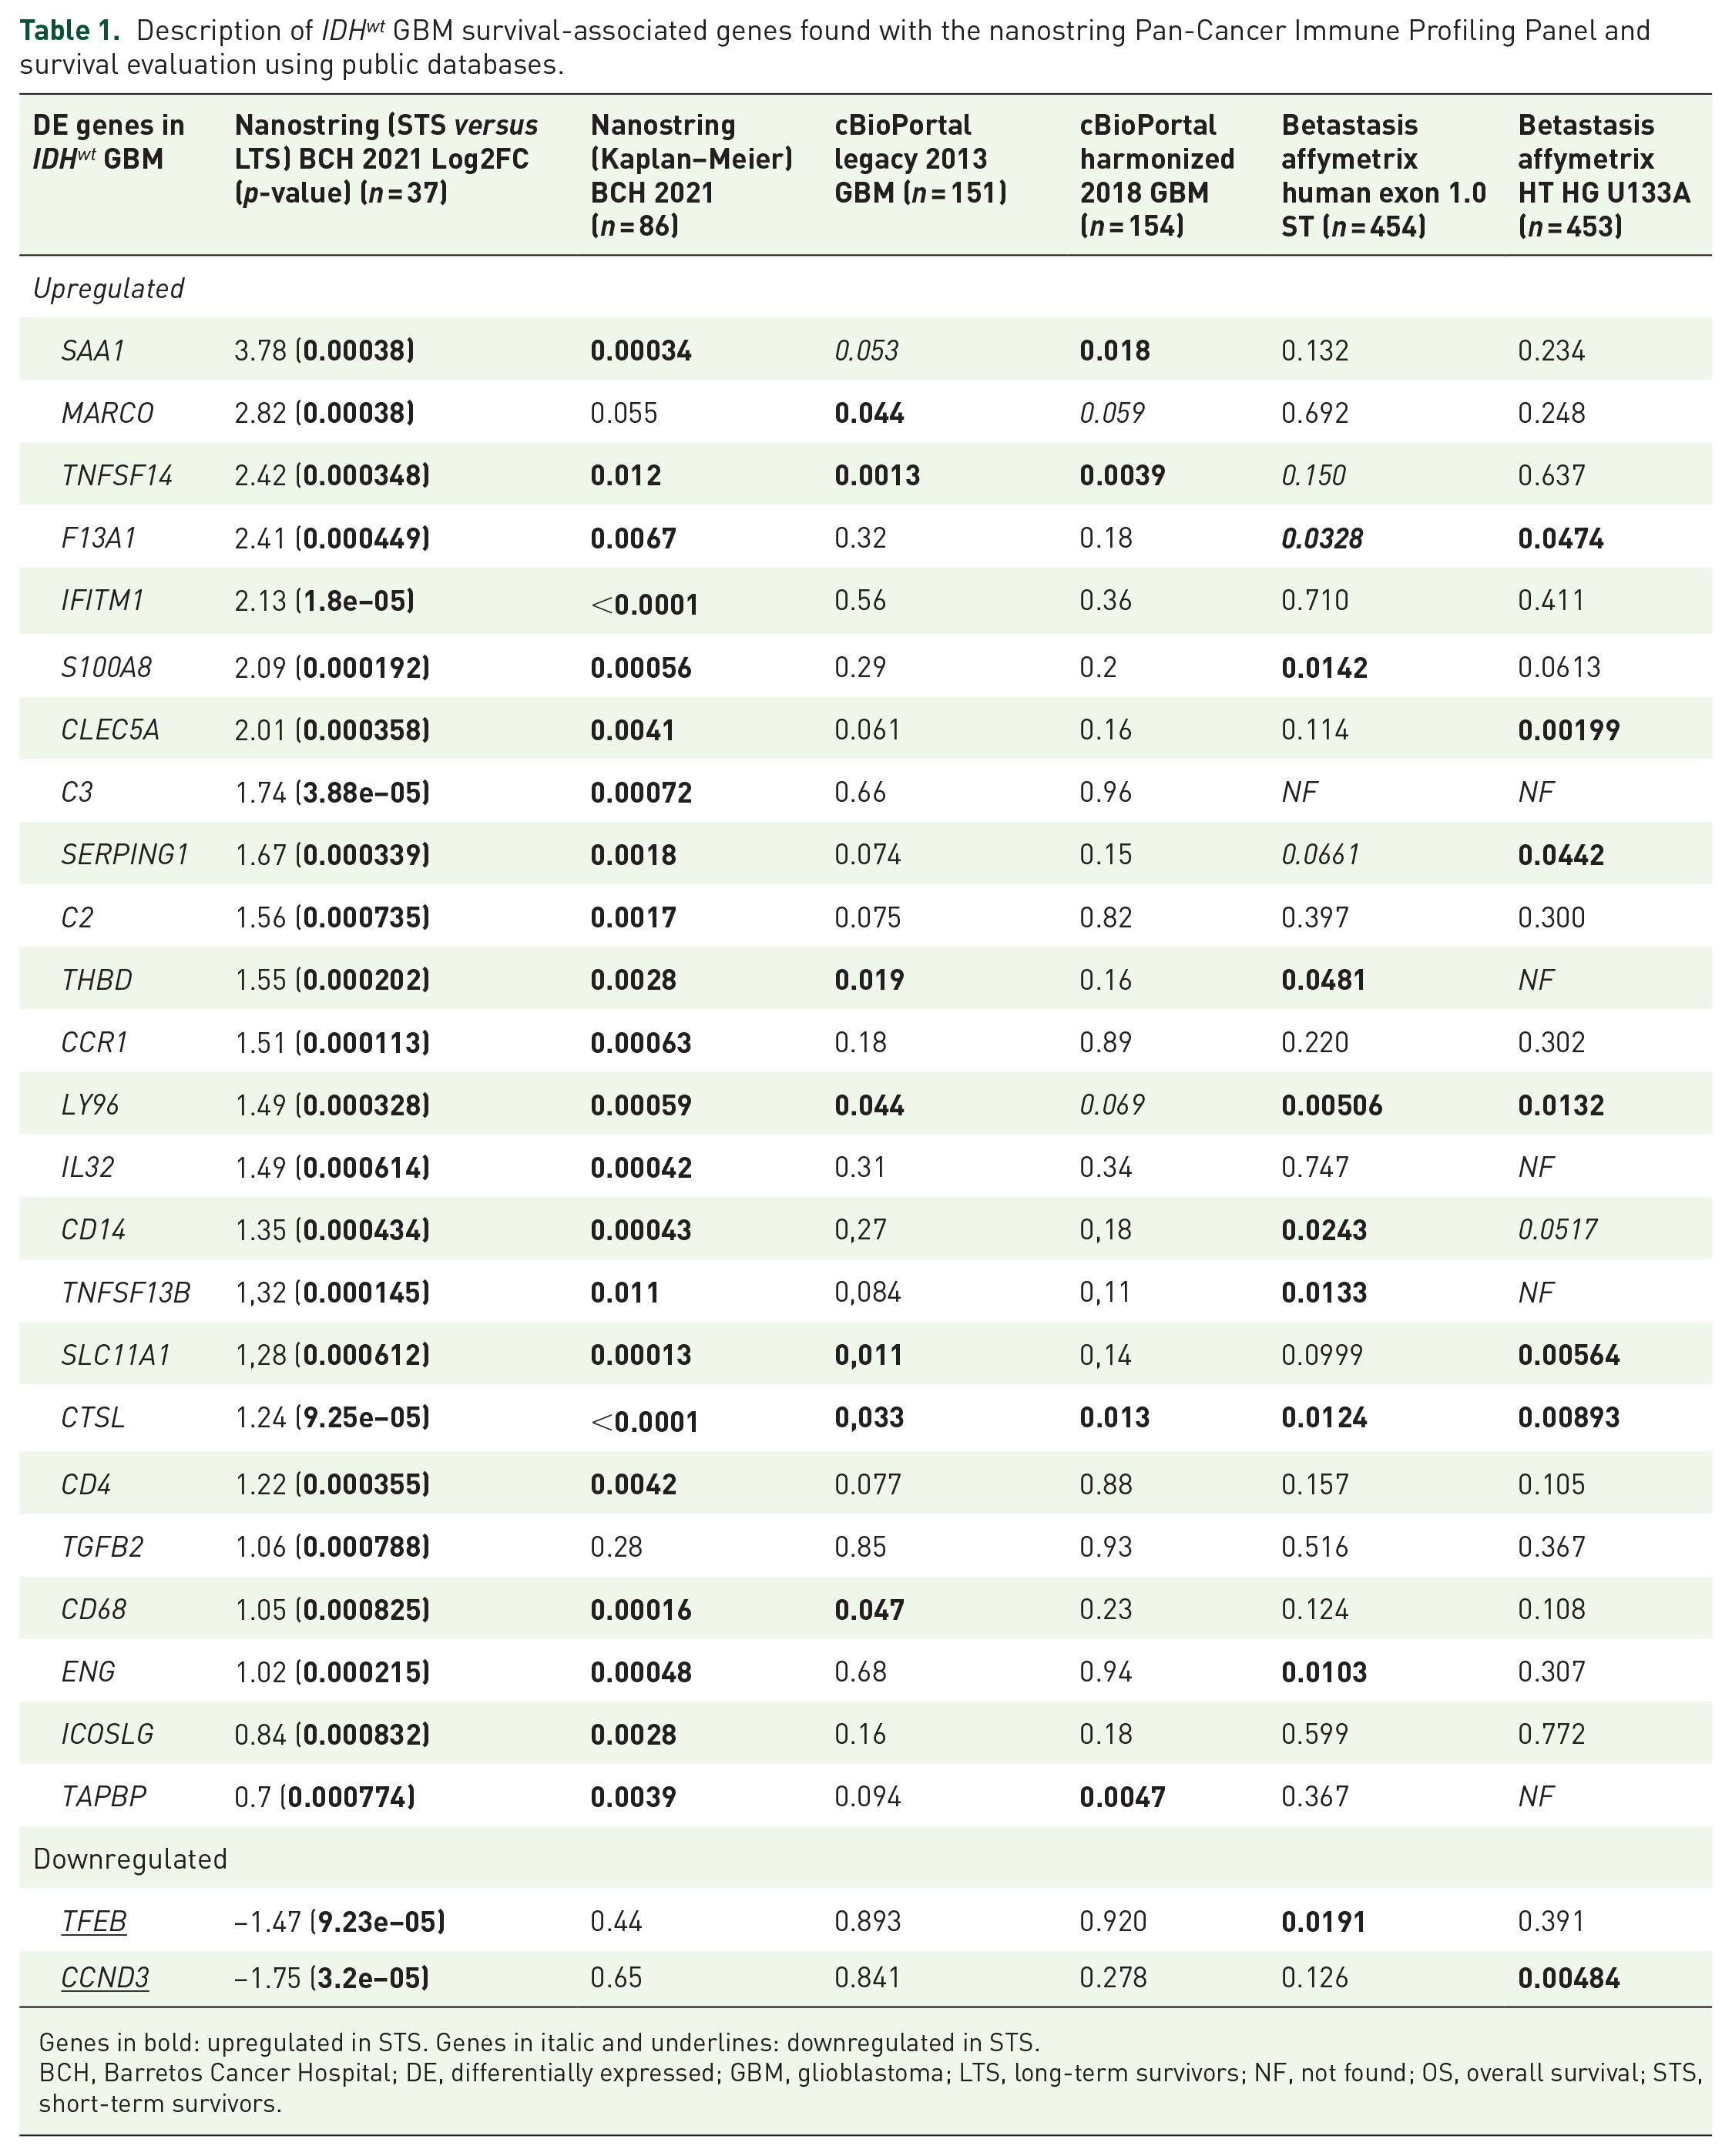
Genes in bold: upregulated in STS. Genes in italic and underlines: downregulated in STS.
BCH, Barretos Cancer Hospital; DE, differentially expressed; GBM, glioblastoma; LTS, long-term survivors; NF, not found; OS, overall survival; STS, short-term survivors.
In addition, the immune pathway scores were also associated with IDHwt GBM survival (Figures 2(c) and (d); Supplemental Table 6). Except for TLR, microglial, and cell cycle pathway scores, all other immune pathways were upregulated in IDHwt GBM STS. The most significant upregulated pathway in STS was macrophage functions (Supplemental Table 6; Figure 2(e)). We also observed significant upregulation of macrophages (Figure 2(f)), CD45 (Figure 2(g)), and cytotoxic cell type score (Figure 2(h)) in STS compared to LTS.
KEGG pathway analysis showed upregulation of SDF1, cytokine receptors, IL8, TGFB, and downregulation of Cyclin D pathways IDHwt GBM STS (Supplemental Figure 4).
CD274 (PD-L1) immune checkpoint mRNA is overexpressed in short-term survival IDHwt GBM.
We also evaluated the expression profile of important immunotherapy genes related to T-cell exhaustion. We observed a high expression of CD274 (PD-L1) in IDHwt GBM STS (p = 0.009) compared to LTS. No significant differences were observed for PDCD1 (PD-1), CTLA4, IDO1, and LAG3. The nSolver software analysis also showed that CD274 is upregulated in STS (Log2 fold change = 1.22; p = 0.015). However, the adjusted p-value observed for this analysis was 0.45.
The immune-oncology signature predicts prognosis in GBM IDHwt
To identify a prognostic IDHwt GBM gene signature, we initially performed a univariate analysis of the 730 immune-oncology genes included in the NanoString Pan-Cancer Immune Profiling Panel. We found 280 genes with significant association with patient survival that were further submitted to the LASSO regression with Cox proportional hazards model (Supplemental Table 7). From leave-one-out cross-validation, λmin was automatically selected to define the prognostic signature. We obtained a 12-gene signature (CXCL14, PSEN2, TNFRSF13C, IL13RA1, MAP2K1, TNFSF14, THY1, CTSL, ITGAE, CHUK, CD207, and IFITM1) with active non-zero coefficients were obtained (Supplemental Table 8).
The 12 immune-related gene signature score for IDHwt GBM was evaluated using Kaplan–Meier analysis (Figure 3(a)) and the time-dependent ROC curves for patient survival (Figure 3(b)). Low- and high-risk patients were defined by a median value of the signature score, which presented a median OS of 18.17 (16.69–31.44) and 14.36 (11.37–16.46) months, respectively. The estimated area under the curve for 12 and 36 months were 0.75 and 0.94, respectively (Figure 3(b)). A general C-index of 0.72 was obtained for the model cohort.

Performance of the 12 immune-related gene signature for IDHwt GBM developed by LASSO regression with Cox proportional hazards model. (a) Kaplan–Meier curves based on the prognostic 12 immune-related gene signature for GBM IDHwt. High- and low-risk groups were defined by the median risk scores. (b) Time-dependent ROC curves were built for 12 and 36 months. AUC: area under the curve. (c) Forest plot for clinical characteristics associated with GBM IDHwt patient’s survival and the LASSO risk score.
In addition, the 12 immune-related gene prognostic signature showed a higher risk score (Hazard Ratio, HR = 5.78) compared to other clinical and molecular prognostic characteristics in IDHwt GBM such as age >40 (HR = 2.66); partial/biopsy tumor resection (HR = 2.03); MGMT high expression by Nanostring (HR = 2.69); and MGMT non-methylated (HR = 4.13) (Figure 3(c)).
This analysis underscores the importance of immune factors in GBM progression, revealing targets and biomarkers for further study.
Discussion
In the current study, we evaluated the mRNA levels of 730 immune-oncology-related genes in FFPE tissue from 86 IDHwt GBM and 13 grade 4 astrocytomas IDHmut using the nanostring Pan-Cancer Immune Profiling Platform. We investigated the differences in the immune profiles between the GBM IDHwt and grade 4 astrocytomas IDHmut. We further analyzed the differences in the immune profiles between STS and LTS in IDHwt GBM, identifying immune-related biomarkers and putative targets for GBM therapy.
Immunotherapy of primary brain tumors, particularly GBM, has not been successful despite the notable successes in other solid tumors. 10 This may be due to various features, such as low mutation burden, the highly immunosuppressed brain microenvironment, protection by the blood–brain barrier, and differences in immune cell infiltrates compared with other body locations. 10 Therefore, a better understanding of the immune factors associated with GBM is needed to develop new therapeutic strategies and identify novel biomarkers.
Comparing the expression profile between IDHwt GBM and IDHmut grade 4 astrocytomas, the lactotransferrin (LTF) gene was the most upregulated gene in IDHwt GBM. According to our findings, the LTF gene was downregulated in the pro-neural GBM transcriptional subtype 17 , which is also associated with IDHmut tumors. 18 Another differentially expressed gene in GBM IDHwt compared with IDHmut was the pro-inflammatory cytokine IL8, which was reported to be associated with more aggressive gliomas. 19 The third most differentially expressed gene in IDHwt GBM was leukemia inhibitory factor (LIF). LIF is a cytokine involved in multiple biologic processes, and its expression in gliomas was reported to prevent differentiation and to induce self-renewal of glioma-initiating cells. 20 Moreover, among the 10 most upregulated genes in IDHwt GBM compared to IDHmut tumors, we found three different chemokines (C-X-C motif) ligands (CXCL14, CXCL1, and CXCL3). These results agree with previous studies that showed chemokine (C-X-C motif) ligands are downregulated in IDHmut gliomas, and it can be due to 2 hydroxybutyrate, a product that accumulates in glioma cells as a result of the enzymic activity of mutated IDH1/2. 10
The most upregulated immune pathway observed in IDHwt GBM was the cell cycle score, which may be related to the more aggressive phenotype of this subtype. We also observed a significantly higher macrophage cell type score in IDHwt GBM compared to IDHmut, corroborating other studies that reported high levels of GBM-associated macrophages in IDHwt GBM compared to IDHmut. 21 This pronounced difference in the immune microenvironment between IDHwt GBM and IDHmut grade 4 astrocytomas reflects the different etiology of these tumors, which are also genetically distinct 2 and may provide clues for future immunotherapy strategies. Nevertheless, the lower number of IDHmut (n = 13) evaluated hampers meaningful statistical associations, and further studies with a higher number of cases should be performed.
Next, in the GBM IDHwt subset, we further interrogated the immune-oncology-related genes associated with patient OS, stratifying our cohort in STS, OS less than 1 year, and LTS, OS higher than 3 years. We found 24 upregulated and two downregulated genes in STS compared with LTS (Figure 4).

Schematic representation of overexpressed immune-related mRNA in short-term survival compared with long-term IDHwt GBM. Upregulation of MARCO and SAA1 secreted by inflammatory monocytes or MDSC contributes to macrophage polarization (M1 to M2). Macrophage M2 (markers CD68 and CLEC5) induces immunosuppression and invasion by releasing CTSL. Treg cells also induce immunosuppression by releasing ICOSLG. MDSC (CD14+) produces F13A1 stimulating angiogenesis and S100A8 attenuating the cytotoxic T-cell antitumor activity. The higher levels of C3 and C2 produced by cytotoxic T cells and CCR1 produced in glioma stem cells may contribute to glioma stem cells’ self-renewal and invasion. Endothelial TME cells produce IL32, IFIM1, THBD, ENG, and TGFB2, inducing angiogenesis.
Interestingly, the two most upregulated genes (SAA1 and MARCO) in STS are associated with the tumor-promoting M2 macrophage subtype. It was reported that human Serum Amyloid A1 (SAA1) induces the expression of macrophage M2 markers 22 and contributes to M2 macrophage polarization. 23 Corroborating our data, SAA1 overexpression was previously associated with poor outcomes in GBM 24 and is a promising target for future GBM therapy. High levels of macrophage receptor with collagenous structure (MARCO) were also reported to be associated with the immunosuppressive M2 macrophage signature. 25 Moreover, a recent study demonstrated that the MARCO overexpression in TAMs drives the malignant phenotype in GBM. 26 Additional anti-inflammatory M2 macrophage biomarkers overexpressed in the GBM IDHwt STS group were CLEC5A and cathepsin L (CTSL). In agreement with our findings, a recent large-scale study showed that CLEC5A overexpression is associated with decreased OS in gliomas 27 , and the proteolytic enzyme CTSL was reported to promote migration and invasion in gliomas (Figure 4). 28
F13A1, which encodes the coagulation factor XIII, which plays functions in tissue healing and angiogenesis, was another significantly overexpressed gene in the STS group. The F13A1 contributes to neovascularization. 29 Interestingly, F13A1 was shown to be highly expressed by inflammatory monocytes in the lung cancer microenvironment, and the classical marker for inflammatory monocytes is CD14 30 , which we also found to be upregulated in our STS GBM group. Other genes associated with angiogenesis, such as IL32 31 , IFITM1 32 , THBD 33 , ENG 34 , and TGFβ2 35 , are upregulated in the GBM IDHwt STS group (Figure 4).
We also observed overexpression of tumor necrosis factor (TNF) superfamily (TNFSF) TNFSF14 and TNFSF13B in STS GBM, supporting previous studies that associated these genes with shorter survival 36 and GBM aggressiveness. 37
Another overexpressed gene in the STS group was S100A8. The S100A8/A9 heterodimer is a chemoattractant for myeloid-derived suppressor cells (CD14+), which function in the tumor immunosuppressive microenvironment by suppressing T-cell function 38 , and herein, we also found a significantly increased level of the MDSC marker CD14 in STS GBM (Table 1 and Figure 4).
Interestingly, we observed upregulation of genes related to the self-renewal of glioma stem cells and invasion, such as CCR1 that together with CCR5 are the main receptors that mediate CCL8 expression in TAMs contributing to invasion and stemness in GBM 39
The complement system plays an important role in glioma stem cell maintenance and self-renewal. 40 T cells contain intracellular C3 (Complement 3), which induces activation of the PI3K/Akt/mTOR signaling cascade leading to self-renewal and maintenance of glioma stem cells. 40 In the present study, we found higher C3 and C2 in STS IDHwt GBM (Figure 4). Furthermore, we observed upregulation of SERPING1 (Serine/Cysteine Proteinase Inhibitor Clade G Member 1) in STS. SERPING1 is a C1-Inhibitor produced mainly by monocytes and macrophages and acts by inhibition of the classic complement system pathway. 41 However, the exact mechanisms involved in GBM aggressiveness are not well described.
We found that CD4 is upregulated in STS IDHwt GBM patients. CD4 is a classical surface marker of T-helper cells, induced T regulatory cells (iTreg), and T regulatory cells (Treg). 42 Tumor-associated Treg cells express the inducible costimulator (ICOS), and the expansion of these immunosuppressive cells also depends on the expression of the inducible T-cell ICOS ligand (ICOSLG) provided by dendritic cells. 43 Interestingly, we found ICOSLG overexpression in IDHwt GBM STS, indicating that this may be an important factor, which may contribute to GBM immunosuppression and aggressiveness. Of note, ICOSLG overexpression was associated with poor prognosis in GBM, and the knockdown of ICOSLG reduced GBM growth in immunocompetent mice. 44
The TAPBP gene encodes tapasin, part of a peptide complex, and interacts with major histocompatibility complex class I (MHC I), allowing high-affinity peptide binding for CD8+ T-cell antigen recognition. 45 Intriguingly, we observed the upregulation of TAPBP in IDHwt GBM STS. However, it is important to note that tapasin is part of the MHCI complex 45 , and other factors may be involved in the efficiency of antigen presentation, especially in the context of the TME.
We also observed the overexpression of the immune checkpoint gene CD274 (PD-L1) in IDHwt GBM STS. A systematic study including more than 800 GBM samples from nine different studies also showed that PD-L1 expression in tumor tissues was associated with poor OS. 46 Patients with high CD274 levels should benefit from immunotherapies using anti-PD-L1 antibodies. 46
Importantly, we also identified a 12-gene signature associated with IDHwt GBM outcome. Using the LASSO regression with proportional hazards model, we could stratify IDHwt GBM into high-risk and low-risk groups. This approach must be validated in other IDHwt GBM NanoString cohorts, and if data support, it could be applied routinely for patient prognostication.
The present study exhibited some limitations. It only evaluated gene expression levels and analyzed a limited number of immune-related genes. Moreover, the number of cases assessing the genes differentially expressed between GBM IDHwt STS and LTS was limited. So, further studies addressing protein levels, the crosstalk among cell types, and functional studies should be performed. Also, studies evaluating a higher number of cases that would consider all the variables that influence patient survival, such as degree of surgery resection, age, and MGMT status, should be conducted to confirm the independent prognostic factor of our gene signature. Nevertheless, this study is of significant value since it was done using the nCounter technology, which allows routine FFPE archival material and could be easily reproduced in our series. 9 Finally, among the 24 differentially expressed genes identified in our series, 18 were also associated with GBM survival in the TCGA dataset. So, we believe that our results are consistent and important in understanding the role of immune-related genes in GBM biology.
Conclusions
We found that upregulation of immune-related genes, increased macrophage functions, and angiogenic factors are associated with poorer outcomes in IDHwt GBM. Moreover, an immune-related gene expression signature could predict patient prognosis. Our findings identify several specific immune-related factors which may be associated with a more aggressive phenotype in GBM and provide promising and new unexplored targets for therapy.
Supplemental Material
sj-doc-5-tam-10.1177_17588359221127678 – Supplemental material for Cancer immune profiling unveils biomarkers, immunological pathways, and cell type score associated with glioblastoma patients’ survival
Supplemental material, sj-doc-5-tam-10.1177_17588359221127678 for Cancer immune profiling unveils biomarkers, immunological pathways, and cell type score associated with glioblastoma patients’ survival by Daniel Antunes Moreno, Luciane Sussuchi da Silva, Isabella Gomes, Letícia Ferro Leal, Gustavo Noriz Berardinelli, Gisele Melo Gonçalves, Caio Augusto Pereira, Iara Viana Vidigal Santana, Marcus de Medeiros Matsushita, Krishna Bhat, Sean Lawler and Rui Manuel Reis in Therapeutic Advances in Medical Oncology
Supplemental Material
sj-tif-1-tam-10.1177_17588359221127678 – Supplemental material for Cancer immune profiling unveils biomarkers, immunological pathways, and cell type score associated with glioblastoma patients’ survival
Supplemental material, sj-tif-1-tam-10.1177_17588359221127678 for Cancer immune profiling unveils biomarkers, immunological pathways, and cell type score associated with glioblastoma patients’ survival by Daniel Antunes Moreno, Luciane Sussuchi da Silva, Isabella Gomes, Letícia Ferro Leal, Gustavo Noriz Berardinelli, Gisele Melo Gonçalves, Caio Augusto Pereira, Iara Viana Vidigal Santana, Marcus de Medeiros Matsushita, Krishna Bhat, Sean Lawler and Rui Manuel Reis in Therapeutic Advances in Medical Oncology
Supplemental Material
sj-tif-2-tam-10.1177_17588359221127678 – Supplemental material for Cancer immune profiling unveils biomarkers, immunological pathways, and cell type score associated with glioblastoma patients’ survival
Supplemental material, sj-tif-2-tam-10.1177_17588359221127678 for Cancer immune profiling unveils biomarkers, immunological pathways, and cell type score associated with glioblastoma patients’ survival by Daniel Antunes Moreno, Luciane Sussuchi da Silva, Isabella Gomes, Letícia Ferro Leal, Gustavo Noriz Berardinelli, Gisele Melo Gonçalves, Caio Augusto Pereira, Iara Viana Vidigal Santana, Marcus de Medeiros Matsushita, Krishna Bhat, Sean Lawler and Rui Manuel Reis in Therapeutic Advances in Medical Oncology
Supplemental Material
sj-tif-3-tam-10.1177_17588359221127678 – Supplemental material for Cancer immune profiling unveils biomarkers, immunological pathways, and cell type score associated with glioblastoma patients’ survival
Supplemental material, sj-tif-3-tam-10.1177_17588359221127678 for Cancer immune profiling unveils biomarkers, immunological pathways, and cell type score associated with glioblastoma patients’ survival by Daniel Antunes Moreno, Luciane Sussuchi da Silva, Isabella Gomes, Letícia Ferro Leal, Gustavo Noriz Berardinelli, Gisele Melo Gonçalves, Caio Augusto Pereira, Iara Viana Vidigal Santana, Marcus de Medeiros Matsushita, Krishna Bhat, Sean Lawler and Rui Manuel Reis in Therapeutic Advances in Medical Oncology
Supplemental Material
sj-tif-4-tam-10.1177_17588359221127678 – Supplemental material for Cancer immune profiling unveils biomarkers, immunological pathways, and cell type score associated with glioblastoma patients’ survival
Supplemental material, sj-tif-4-tam-10.1177_17588359221127678 for Cancer immune profiling unveils biomarkers, immunological pathways, and cell type score associated with glioblastoma patients’ survival by Daniel Antunes Moreno, Luciane Sussuchi da Silva, Isabella Gomes, Letícia Ferro Leal, Gustavo Noriz Berardinelli, Gisele Melo Gonçalves, Caio Augusto Pereira, Iara Viana Vidigal Santana, Marcus de Medeiros Matsushita, Krishna Bhat, Sean Lawler and Rui Manuel Reis in Therapeutic Advances in Medical Oncology
Footnotes
References
Supplementary Material
Please find the following supplemental material available below.
For Open Access articles published under a Creative Commons License, all supplemental material carries the same license as the article it is associated with.
For non-Open Access articles published, all supplemental material carries a non-exclusive license, and permission requests for re-use of supplemental material or any part of supplemental material shall be sent directly to the copyright owner as specified in the copyright notice associated with the article.