
Abstract
Background:
Recently, the Patras Immunotherapy Score (PIOS) has been developed to estimate the survival benefit of patients with advanced non-small-cell lung cancer (aNSCLC) treated with nivolumab or pembrolizumab. The aim of this study was to validate the clinical value of PIOS in an external cohort of aNSCLC patients.
Methods:
PIOS is a baseline formula produced by the combination of performance status, body mass index, age and line of treatment. In this multicentre study, 626 patients with confirmed NSCLC pathology, who had been treated with nivolumab or pembrolizumab, as well as 444 patients with aNSCLC, who had been managed with chemotherapy alone, were retrospectively enrolled. Predictive and prognostic values of PIOS were finally evaluated.
Results:
Patients treated with immunotherapy and higher PIOS score had an improved progression-free survival not only in univariate [hazard ratio (HR) = 0.621, p = 0.001], but also in multivariable analysis (HR = 0.651, p = 0.003). In addition, improved overall survival with increasing PIOS score was also observed (HR = 0.608, p < 0.001) with this association remaining statistically significant after adjusting for programmed-cell death ligand 1 (PD-L1) expression (HR = 0.620, p < 0.001). In addition, patients with disease progression (PD) had lower scores compared to those with stable disease (SD), partial response (PR) or complete response (CR) in a two-tier model (p < 0.001) as well as in a four-tier model (PD, SD, PR and CR; p < 0.001). Prognostic significance of PIOS score also persisted using a binary logistic regression analysis, adjusted for disease stage and PD-L1 status (p = 0.002, odds ratio: 0.578). Contrarily, PIOS had no prognostic significance in the chemotherapy group; however, upon combined analysis of the two cohorts, PIOS was found to have a significant interaction with the type of treatment (HR = 0.066 with p < 0.001), confirming its predictive value for immunotherapy.
Conclusions:
This study provides further validation of PIOS in aNSCLC patients treated with anti-PD-1 monotherapy.
Introduction
Immune checkpoint inhibitors (ICIs) have dramatically changed the course of patients with advanced non-small-cell lung cancer (aNSCLC). 1 Immunotherapy has reformed the treating options of aNSCLC not only beyond the first line, but also in the first line of treatment (LOT). 2 Inhibition of programmed-cell death 1 (PD-1) and programmed-cell death ligand 1 (PD-L1) by monoclonal antibodies is the most successful immunotherapeutic intervention in NSCLC. 3 Blocking of PD-1/PD-L1 interaction leads to reactivation of the immune response, achieving a robust anticancer response. 4 In particular, anti-PD-1/PD-L1 blockade can reinvigorate the inactive antigen-specific CD8+ T cells, located at the tumor microenvironment, overcoming the negative regulatory effects of this immune checkpoint activation. 5 Nivolumab and pembrolizumab are the first ICIs approved by the US Food and Drug Administration and European Medicines Agency for the treatment of aNSCLC. 4
Until now, PD-L1 protein expression and tumour mutation burden (TMB) are the only two used biomarkers regarding their predictive value in NSCLC patients treated with ICIs. 6 Particularly, the PD-L1 expression (percentage) is the most investigated biomarker since its significance has been evaluated in a great number of retrospective and prospective studies as well as in clinical trials. 7 Regarding TMB, Rizvi et al. 8 have correlated the improved objective response and progression-free survival (PFS) with higher nonsynonymous mutation burden in tumours given that higher TMB reflects more neoantigens. However, undoubtfully, PD-L1 expression and TMB are imperfect predictors for effectiveness of immunotherapy in lung cancer patients. 9 So, the need for new, clinically useful and reproducible markers remains an urgent, ongoing and challenging matter. 10
Formerly, our group has established and investigated the Patras Immunotherapy Score (PIOS) formula using four clinical parameters [performance status (PS) as given by the Karnofsky Performance Status Scale Index, body mass index (BMI), age (AGE) and LOT], calculated as PIOS = ((PS × BMI)/(LOT × AGE)). 11 The initial evaluation of PIOS was based on analysing retrospective data collected by 112 aNSCLC patients (discovery group), who were treated with nivolumab or pembrolizumab as monotherapy at the University Hospital of Patras, Greece. 11
In the current study, we have validated the clinical significance of PIOS formula in aNSCLC, evaluating its predictive and prognostic value in a multicenter external cohort of aNSCLC patients, who have previously been treated with nivolumab or pembrolizumab as well as in a second cohort of patients with aNSCLC treated with chemotherapy regimens only.
Patients and methods
Study design, population and data collection
This study was performed following the Helsinki Declaration on ethical guidelines (2013) and upon approval by the Scientific Committee and the Committee on Research and Ethics of the University Hospital of Patras (Greece, 232/6.04.2017) and by the Ethics Committee of the Heidelberg University Hospital (S-145/2017). 12 Informed consent of enrolled patients was waived by the Ethics committee since enrolment was performed retrospectively and patients’ data were anonymized. This multicenter study included two cohorts of patients (validation group and chemotherapy group), who were retrospectively selected based on the specific inclusion criteria. Chemotherapy group included patients only from the Heidelberg University Hospital, while the validation group included both Greek and German patients. All patients enrolled in the validation group of the current study had histologically or cytologically confirmed NSCLC pathology, monotherapy with nivolumab (240 mg every 2 weeks) or pembrolizumab (2 mg/kg or 200 mg every 3 weeks) in any LOT, available clinical data from the observation period (March 2013–January 2020). Case selection and statistical analysis were conducted blindly to the particular characteristics as well as to the clinical efficacy. Inadequate availability of follow-up data (lack of follow-up data regarding the final outcome) as well as incomplete immunotherapy (incomplete cycles, very early death after enrolment, uncaused withdrawal of treatment), concurrent administration of chemotherapeutic agents with immunotherapy, use of high dose of glucocorticoids as well as enrolment in the initial study of PIOS (discovery group) were among the exclusion criteria (Figure 1).

STROBE diagram of patients included in the validation group of this study. The majority of patients had metastatic disease, however, few of them had inoperable stage III disease and they were treated with systematic treatments upon or not chemoradiotherapy.
For all patients of the validation group, clinicopathological traits, PS before ICIs administration, PD-L1 expression, best overall response (BOR) as per RECIST 1.1 criteria, PFS, post-immunotherapy overall survival (OS) as well as last follow-up or date of death were also collected. 13 Patients with stable disease (SD) or partial response (PR) or complete response (CR) to immunotherapy were categorized in favourable group, while as poor responders were characterized the patients with progressive disease. Cases were classified in tumor stages according to the American Joint Committee on Cancer 8th edition of TNM Staging System. 14 The Eastern Cooperative Oncology Group (ECOG) scale was used for the evaluation of the PS prior to anti-PD-1 first administration. Based on the results from Prasad et al. 15 ECOG PS was converted to Karnofsky Performance Scale for calculation reasons. Based on our previous findings, PIOS score was calculated using the four clinical parameters and following the proposed formula PIOS = ((PS × BMI) / (LOT × AGE)). 11
In addition, inclusion criteria for the patients of chemotherapy group were the same as those of the patients of the validation group with the exception of the treating management. All patients of this group had not received immunotherapy or other targeted therapy and they had medically been managed using chemotherapeutic regimens. Furthermore, clinicopathological traits, PS, OS and last follow-up or date of death were similarly collected. PIOS calculation was performed following the same procedure as previously described.
The absence of activating mutations of Epidermal Growth Factor Receptor gene and of rearrangements of Anaplastic Lymphoma Kinase gene were necessary to exclude driver gene addiction. The enrolled patients have been medically managed by the treating medical oncologists following the guidelines at the time of follow-up. Throughout the paper, the term ‘discovery’ refers to the discovery population of our original study and the term ‘validation’ to the validation population of the current study. 11
Statistical analysis
Matlab’s Statistics and Machine Learning ToolboxTM R2020a was used for the statistical analysis. The Kruskal–Wallis test was used for calculating the differences between groups with ordinal or continuous data, since the assumptions for employing analysis of variance were not met. The Shapiro–Wilk parametric hypothesis test was used for normality testing. In addition, binary and multivariable logistic regression models were used to investigate whether studied parameters and PIOS were independently related to response. In multivariable analysis, multicollinearity was assessed using variance inflation factor.
Survival analysis was performed using the Kaplan–Meier method and the log-rank test. The 95% confidence intervals (CIs) of the survival functions were computed using the Greenwood’s Formula. Cox proportional hazard models were used for univariate and multivariable analyses of the studied covariates, in correlation with PFS and OS. PFS was calculated from the date of treatment initiation through disease progression (PD) or death from any cause. Also, OS was calculated from the date of diagnosis to death or last follow-up. As cut-off point for PIOS calculations in the immunotherapy group was used the cut-off point of the discovery cohort of the previous study (median PIOS = 0.176). 11 When classifying patients in three groups based on PIOS (low, medium and high), the 1/3 and 2/3 percentiles were used. Statistical significance was defined at 5% and tests were two-sided.
Results
Patients, disease and treatment characteristics
Characteristics of the patients enrolled in the validation as well as chemotherapy groups are summarized in Table 1. In all, 626 patients with aNSCLC were retrospectively enrolled as validation cohort in the current study. All of them were treated with anti-PD-1 monotherapy (nivolumab or pembrolizumab). Almost two-thirds (63.9%) of them were treated with nivolumab and the rest with pembrolizumab. Most of the participants were males (73%), while 27% of them were females. The median age was 66 years (range, 30–89 years). The vast majority of the patients (94.2%) had a confirmed histological diagnosis of adenocarcinoma or squamous cell carcinoma. PD-L1 expression was available for almost two-thirds (67.1%) of the patients, with more than 50% immunopositivity for PD-L1 being detected in 200 participants (~32%). Most of the patients had advanced disease (stages 3B, 3C or 4), while two patients with stage 3A disease were also enrolled, as they had inoperable disease. 14
Characteristics of NSCLC patients enrolled in the validation as well as chemotherapy sub-cohorts of the current study.

BMI, body mass index; BOR, best overall response; CI, confidence interval; CR, complete response; ECOG, Eastern Cooperative Oncology Group; LOT, line of treatment; NA, not available; NSCLC, non-small-cell cancer; OS, overall survival; PD, progressive disease; PD-L1, programmed death-ligand 1; PR, partial response; PS, performance status; SD, stable disease.
Most of the patients (513) had PS 0 or 1 and 113 (18.1%) of them had PS (ECOG) 2 or 3. Post-immunotherapy OS was available for all the cases enrolled in the study. The date of last follow-up was 31 January 2020 with a mean follow-up time 366 days. Patients of the favourable group represented the 59.1% of our cohort. The BOR was not available for 45 patients, while the rest of the patients (211) had PD, based on the first evaluation after the enrolment in the immunotherapy. A little less than 50% (48.2%) died over the follow-up period.
Regarding the patients of the chemotherapy cohort, 444 patients with metastatic disease were enrolled in this subgroup. Most of the participants were males (67%), while 33% of them were females. The median age was 63 years (range, 37–82 years). All of them were of stage IV and had received carboplatin- or cisplatin-based doublets.
PIOS model and PFS in the validation group
The Kaplan–Meier survival curves for PFS by risk group, determined by PIOS score, are presented in Figure 2. The cut-off point from the discovery group (PIOS = 0.176) was used for patient classification, based on the PIOS formula. Similar to the results from the discovery group, a statistically significant association between PIOS and PFS was also observed (Cox proportional hazards regression model with p < 0.001). NSCLC patients with higher PIOS score (⩾0.176) had an improved PFS compared to patients with lower PIOS score (Figure 2(a), log-rank p < 0.001). Median PFS was 515 days for the patients with lower PIOS score, while the survival curve for the favourable subgroup did not reach the threshold of 50%.

(a) Kaplan–Meier survival curve for PFS (with 95% CIs) for patients classified using as cut-off point the median PIOS from the discovery group, (b) Kaplan–Meier survival curves for PFS for the two-tier classification of PIOS and PD-L1 expression with cut-off point at 1%, (c) Kaplan–Meier survival curves for PFS for the two-tier classification of PIOS and PD-L1 expression with cut-off point at 50%, and (d) Kaplan–Meier survival curves for PFS using a three-tier classification for PIOS and PD-L1.
In Figure 2(b)–(d), the two- and three-tier comparisons of PFS for PIOS and PD-L1 status are presented, using the group of patients for which PIOS, PD-L1 and PFS were available (n = 408). In the two-tier classification of patients, where 1% and 50% were used as cut-off points for PD-L1 (Figure 2(b) and (c), respectively), we observed that patients with higher PIOS score have slightly better PFS than those with higher PD-L1 expression (⩾1%), while patients with PD-L1 < 1% have slightly worse PFS compared to those with low PIOS, although there is not a statistically significant difference between the survival curves of the corresponding groups. In addition, when the cut-off point for the PD-L1 expression was set at 50%, the survival curves of the corresponding groups are visually similar and there is not a statistically significant difference between the survival curves of the corresponding groups.
For the same subgroup (n = 408), in the three-tier classification, there was a statistically significant association of PFS with PIOS (log-rank p < 0.001) and, furthermore, a statistically significant trend between the groups of PIOS (log-rank trend test p = 0.006). In the pairwise log-rank tests after adjustment for multiple tests, a statistically significant difference was observed between patients with high and low PIOS (p < 0.001) as well as between patients with high versus medium PIOS (p = 0.011). For the other two groups (low versus medium PIOS), no statistically significant difference was observed. In addition, median PFS for patients with low PIOS was 144 days and 152 days for patients with low PD-L1 expression, while the other groups did not reach the threshold of survival probability of 50% and there were not statistically significant differences between the survival curves for the corresponding groups of PIOS and PD-L1 expression.
Multivariable analysis for PFS, adjusted for those covariates that had a statistical significance in the univariate Cox regression analysis and no association from multicollinearity analysis, confirmed the statistical significance of PIOS when considered together with clinical stage (3 or 4) and positive or negative PD-L1 expression [Table 2, hazard ratio (HR) = 0.651, 95% CI: 0.492–0.863, p = 0.003].
Univariate and multivariable (using the covariates with p < 0.05) analyses fitting Cox proportional hazard models for PFS.
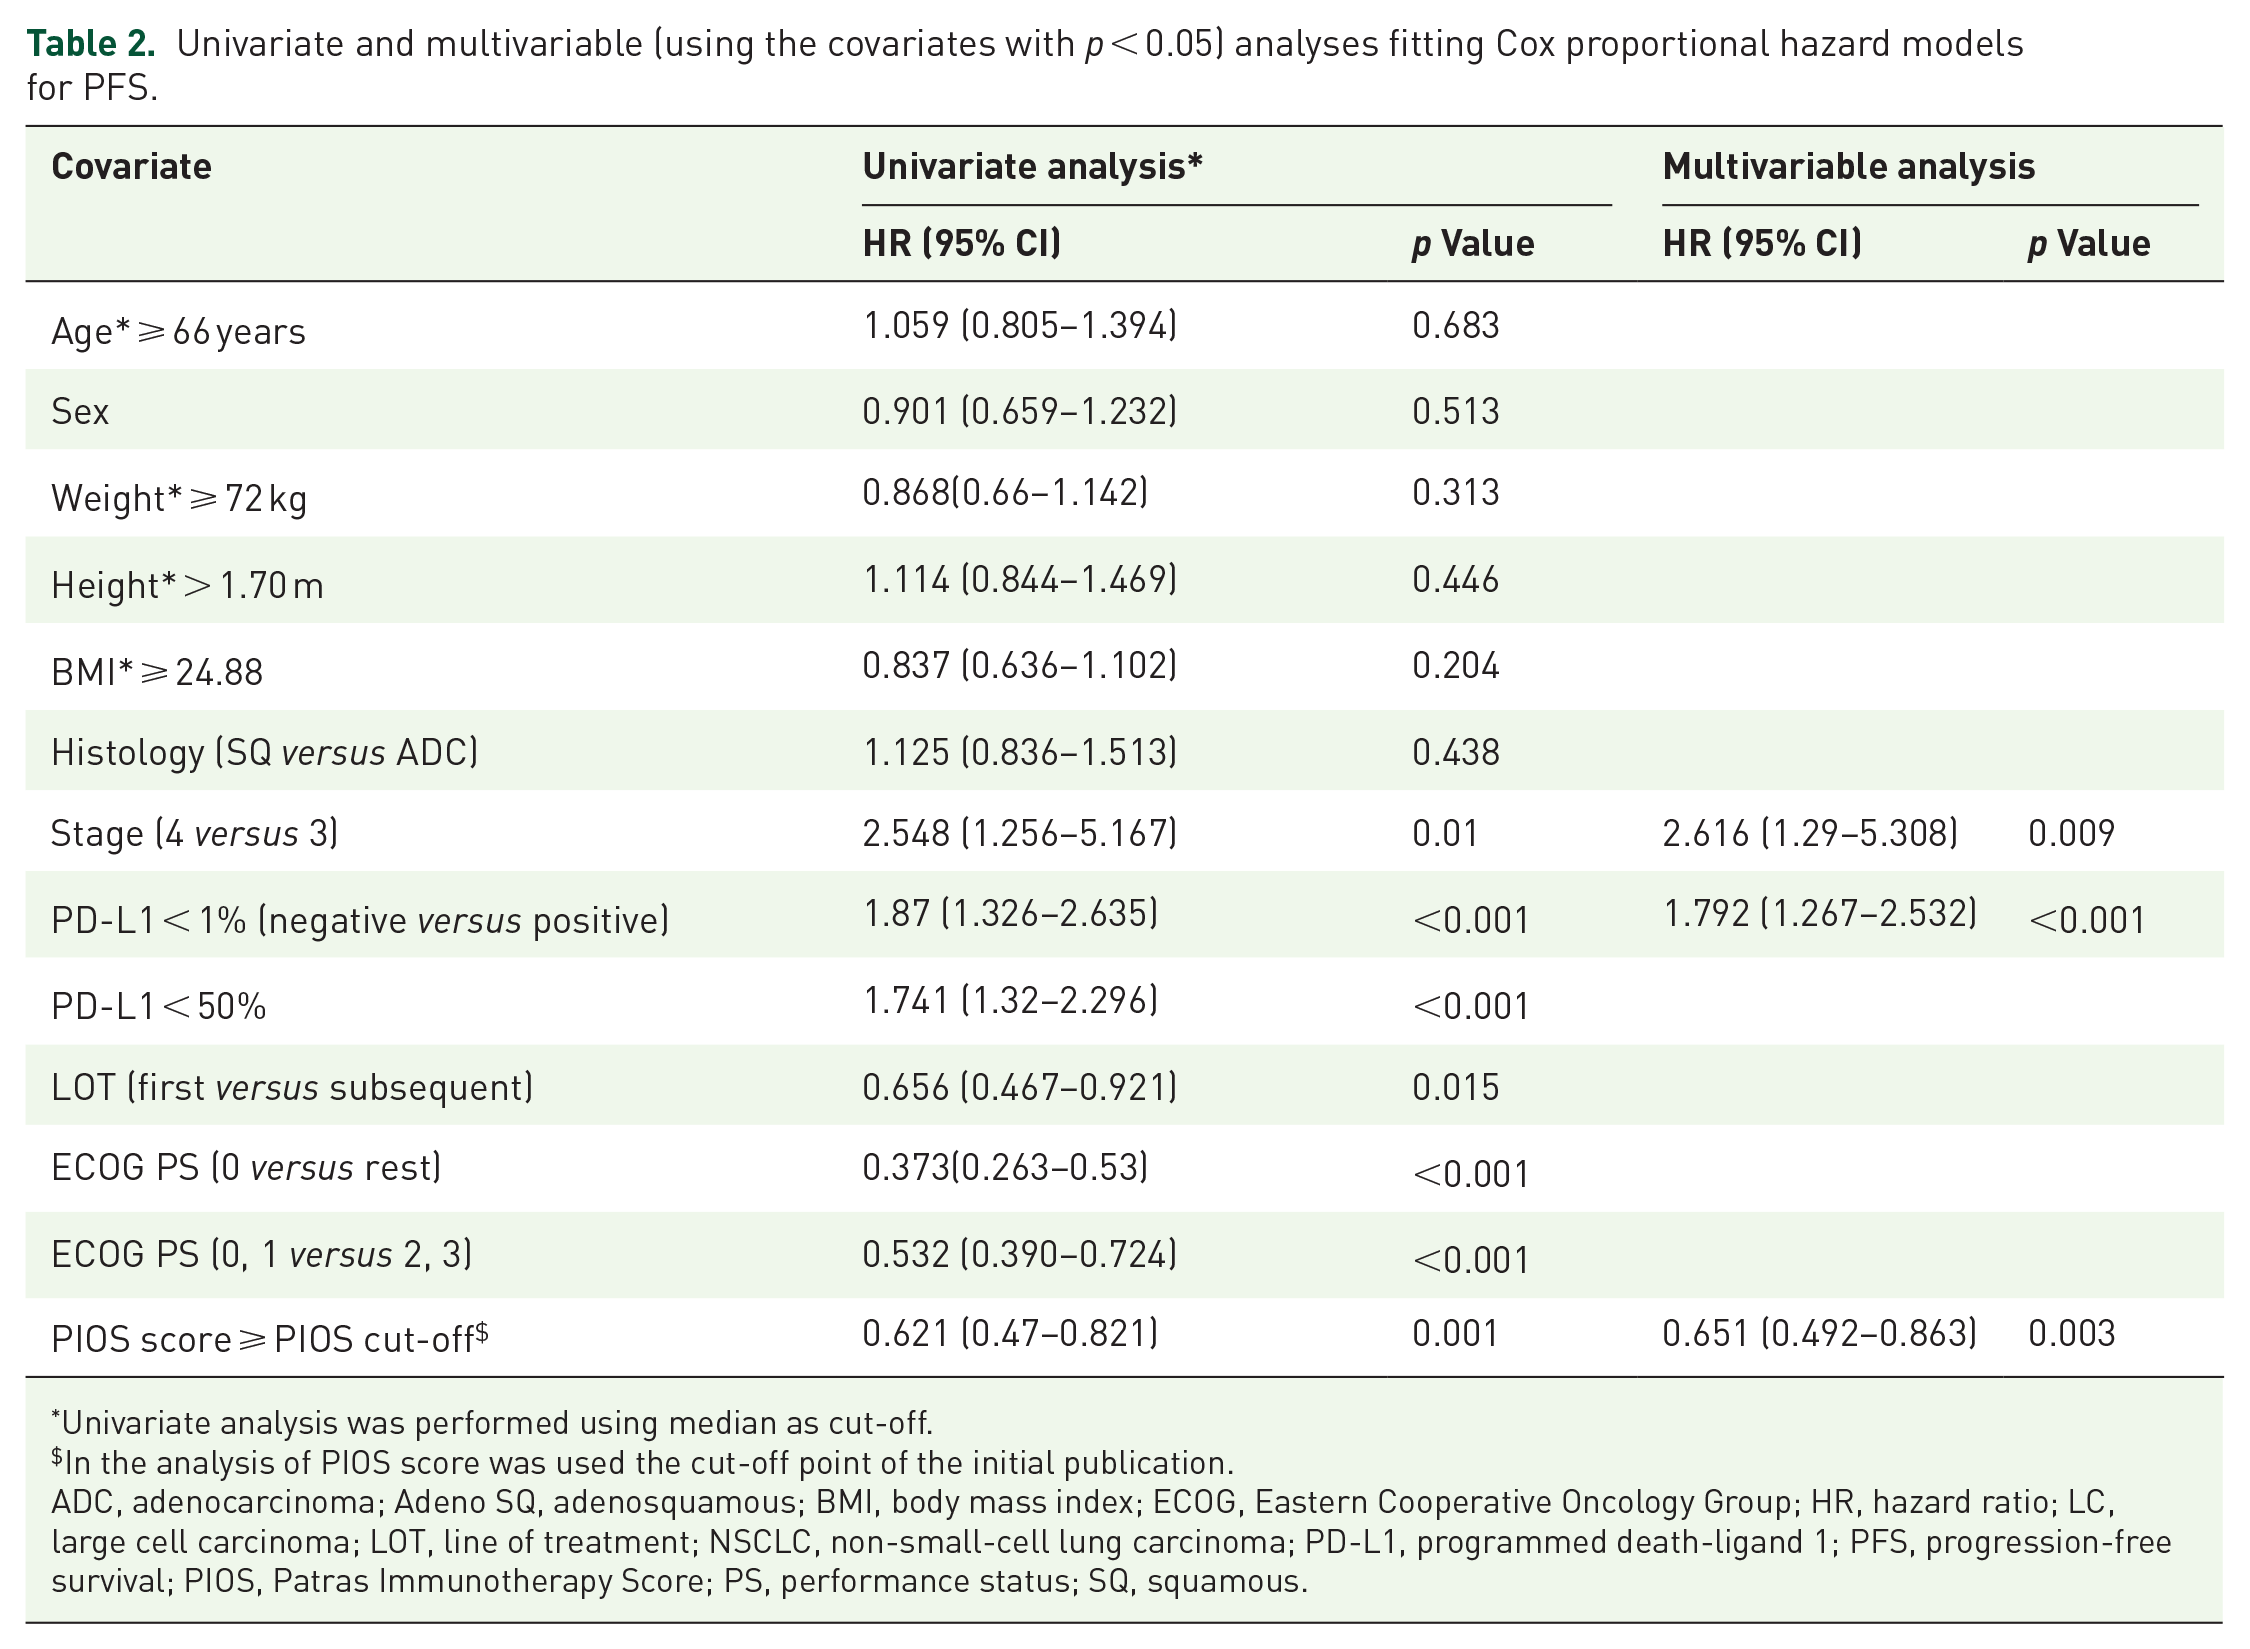
Univariate analysis was performed using median as cut-off.
In the analysis of PIOS score was used the cut-off point of the initial publication.
ADC, adenocarcinoma; Adeno SQ, adenosquamous; BMI, body mass index; ECOG, Eastern Cooperative Oncology Group; HR, hazard ratio; LC, large cell carcinoma; LOT, line of treatment; NSCLC, non-small-cell lung carcinoma; PD-L1, programmed death-ligand 1; PFS, progression-free survival; PIOS, Patras Immunotherapy Score; PS, performance status; SQ, squamous.
PIOS was associated with clinical outcome
In the discovery cohort, higher PIOS score had been associated with longer post-immunotherapy OS. In the validation cohort, the improved clinical outcome with increasing PIOS score was also observed using the same cut-off point as that of the discovery group (Figure 3(a), log-rank, p < 0.001). At univariate Cox regression analysis, the median OS for the favourable group (PIOS ⩾ 0.176) was 765 days compared to 332 days for the poor responders (HR = 0.608, 95% CI: 0.482–0.766, p < 0.001). Furthermore, when using the 1/3 and 2/3 percentiles for grouping patients in high, medium and low PIOS, focusing on the sub-cohort for which both PIOS and PD-L1 expression were available (n = 418, Figure 3(b)), the median days of survival were 505 and 221 days for medium and low PIOS groups, respectively, while the group with high PIOS did not reach the threshold of 50% survival probability. A statistically significant association was observed in the three-tier model (log-rank p < 0.001) as well as statistically significant was the trend between the groups (high, medium and low PIOS) and OS (log-rank trend p = 0.001). In the pairwise log-rank tests after adjustments for multiple tests, statistically significant differences were observed between all the groups (high versus low p < 0.001, high versus medium p = 0.003 and medium versus low p = 0.004). The median OS days for patients with high, medium and low PD-L1 expression were 994, 387 and 217 days, respectively. The survival curves of the three-tier model between the corresponding groups for PIOS and PD-L1 expression showed similar trends, since there are not statistically significant associations between the corresponding groups. The Kaplan–Meier survival curves for the two-group classification for PIOS (using the discovery’s group cut-off point) and PD-L1 classified in positive (⩾1%) and negative (<1%) or using as cut-off point for the PD-L1 expression the 50% are presented in Figure 3(c) and (d), respectively. When two groups of patients were used, PIOS and PD-L1 (using 1% as cut-off point) showed similar trend and no statistically significant difference in the unfavourable groups. In the case of the favourable groups, the PIOS and PD-L1 survival groups were statistically significantly different (log-rank test p = 0.03). In the other hand, when using 50% as cut-off point for the PD-L1 expression, the survival curves of the corresponding groups were showed similar trend and no difference was observed.

(a) Kaplan–Meier survival curve for OS (with 95% CIs) for patients classified using as cut-off point the median PIOS from the discovery group, (b) Kaplan–Meier survival curves for OS using a three-tier classification for PIOS and PD-L1, (c) Kaplan–Meier survival curves for OS using as cut-off point the median PIOS from the discovery group and PD-L1 expression with cut-off point at 1%, and (d) Kaplan–Meier survival curves for OS using as cut-off point the median PIOS from the discovery group and PD-L1 expression with cut-off point at 50%.
In the Cox regression analysis, the association of PIOS with OS remained statistically significant (Table 3, HR = 0.62, 95% CI: 0.492–0.783, p < 0.001) after adjusting for the covariates that had a statistical significance in the univariate analysis and no association from multicollinearity analysis (PD-L1), while LOT and PS were not included in the multivariable Cox proportional-hazards model since they had been used in the PIOS score (Table 2).
Univariate and multivariable (using the covariates with p < 0.05) analyses fitting Cox proportional hazard models for OS.
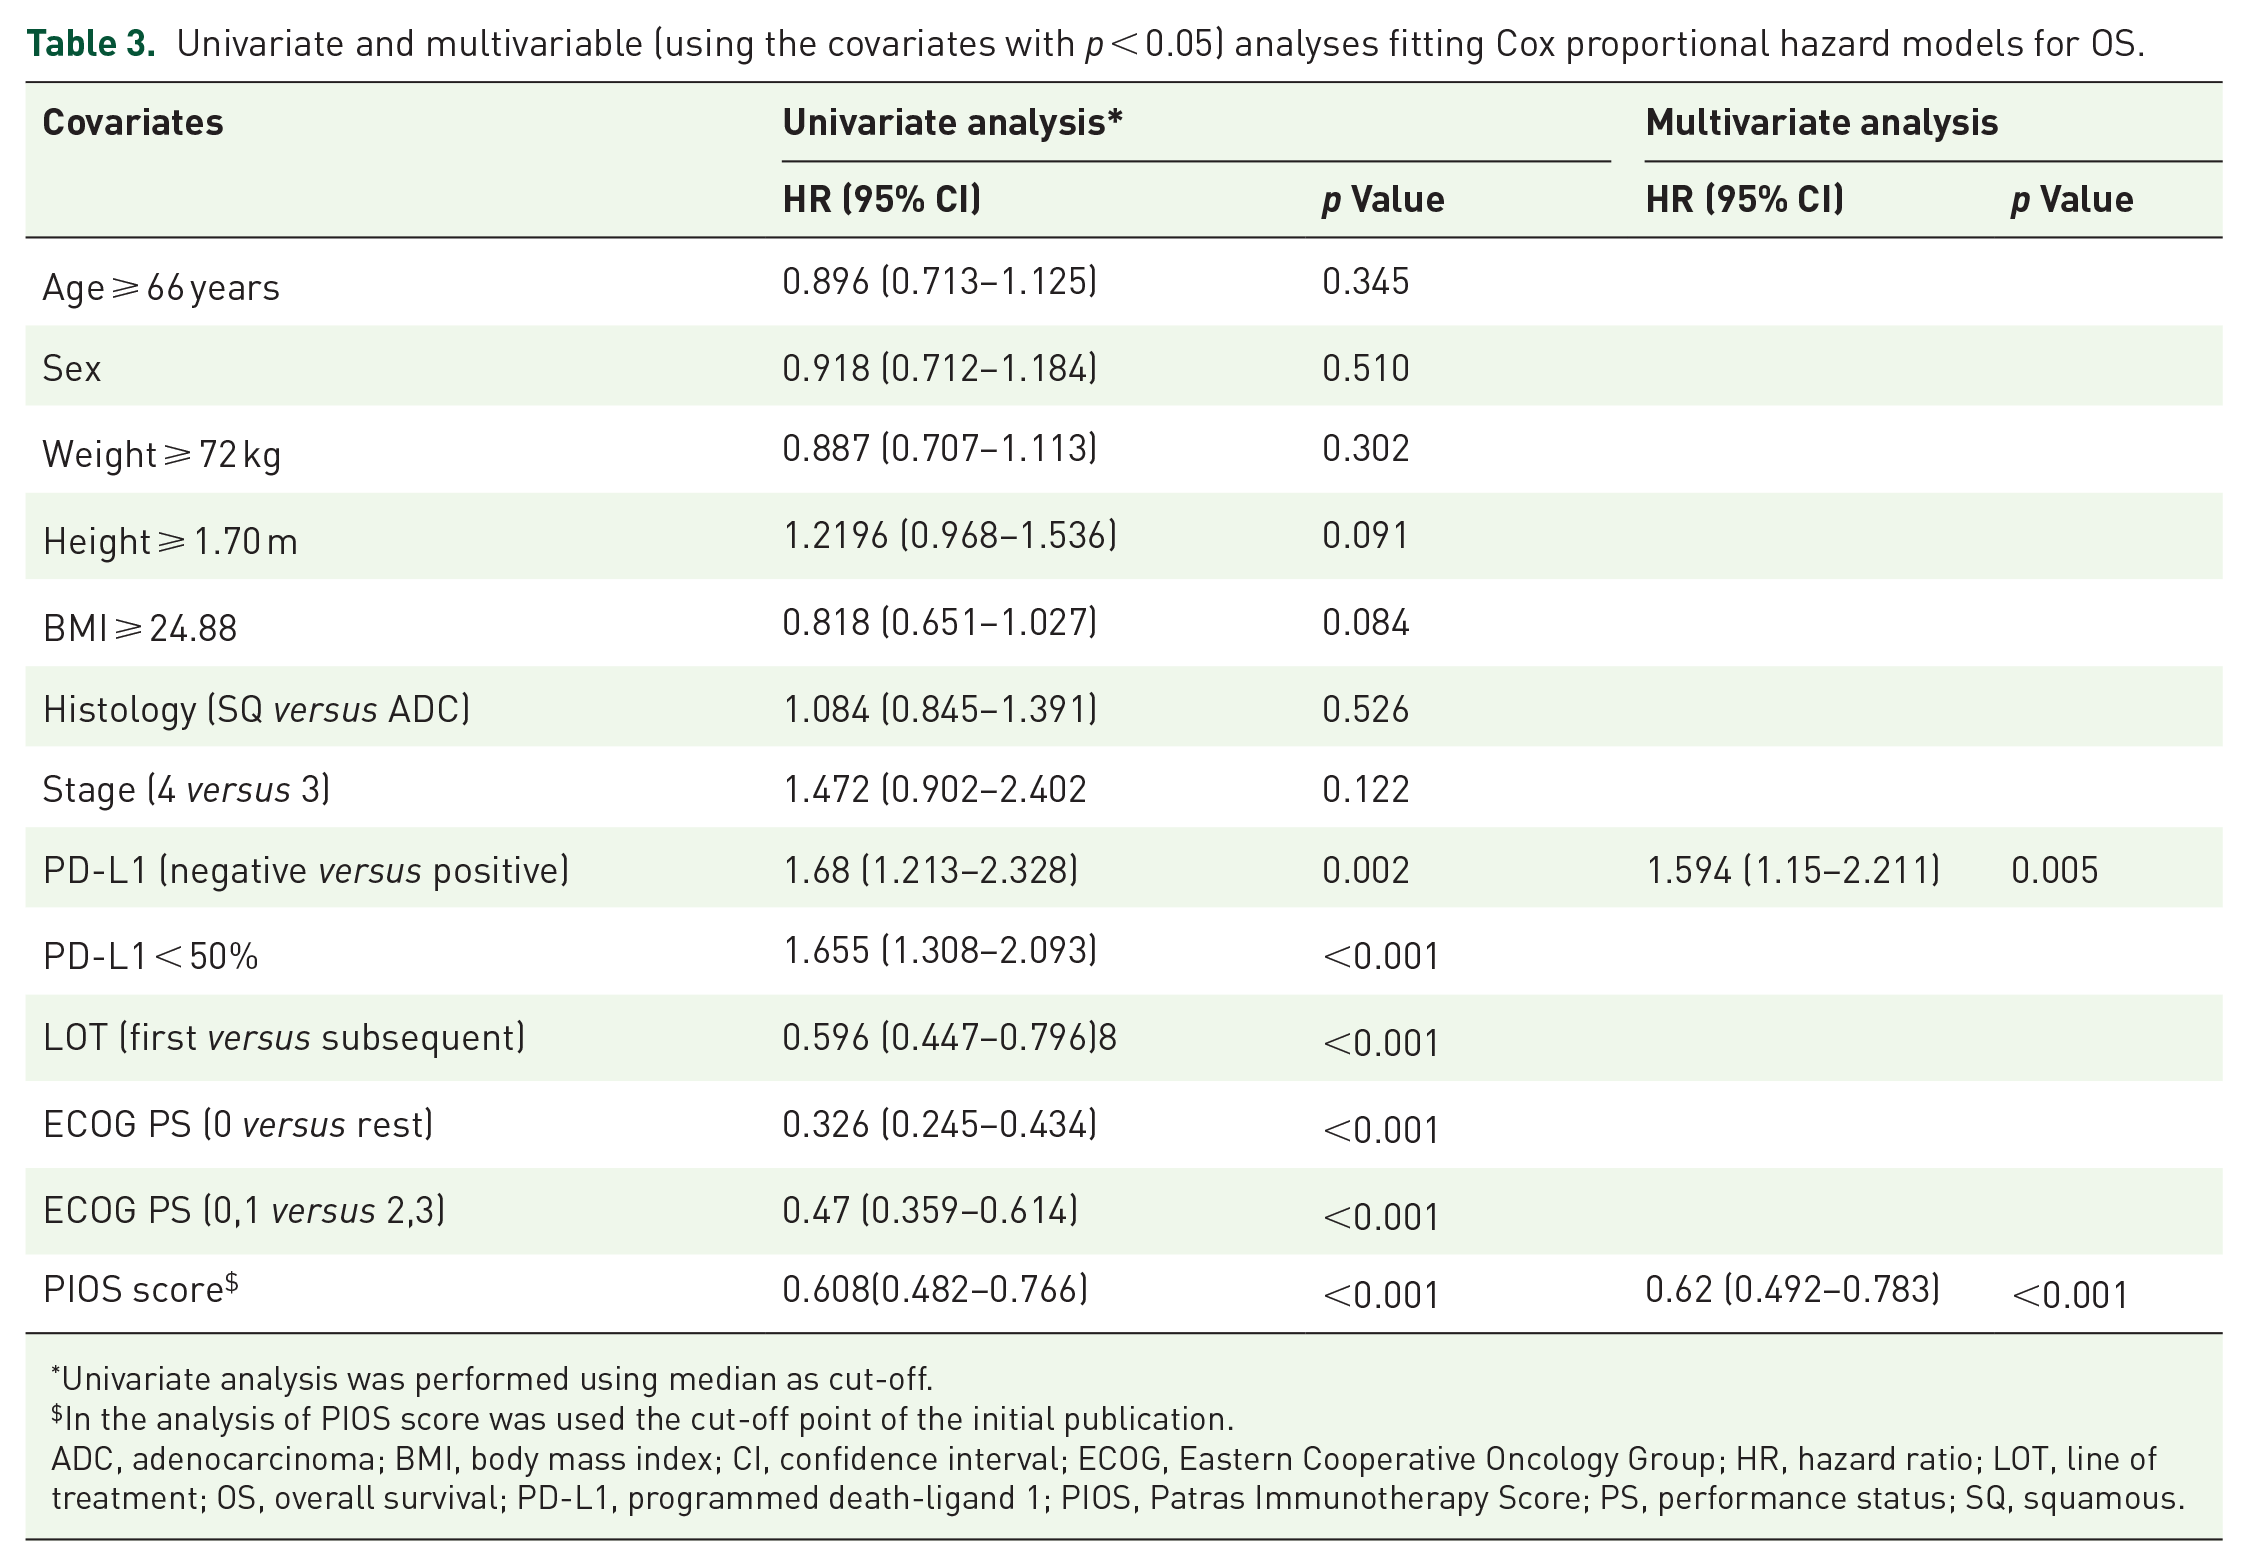
Univariate analysis was performed using median as cut-off.
In the analysis of PIOS score was used the cut-off point of the initial publication.
ADC, adenocarcinoma; BMI, body mass index; CI, confidence interval; ECOG, Eastern Cooperative Oncology Group; HR, hazard ratio; LOT, line of treatment; OS, overall survival; PD-L1, programmed death-ligand 1; PIOS, Patras Immunotherapy Score; PS, performance status; SQ, squamous.
PIOS and response
Furthermore, the initial observation which closely correlated PIOS with BOR was also replicated in this validation group. Patients with PD had lower scores compared to those with SD, PR or CR, who had higher scores in a two-tier model (p < 0.001). The means for the different comparisons for the two-tier model, along with the corresponding standard errors, are shown in Table 4. This association remained using a four-tier model (PD, SD, PR and CR) for evaluation of BOR (p < 0.001). After Bonferroni adjustment for multiple tests, PIOS differed between patients with PD and PR (p < 0.001), but not between PD and SD (p = 0.100). The mean values along with the corresponding standard errors of each group are shown in Table 4. The Cochran–Armitage test for trend, using patients with low and high PIOS (cut-off point of the discovery group), and the four-tier BOR showed a statistically significant linear trend (p < 0.001, Cochran–Armitage chi-square 14.604) between the PIOS groups and BOR. Prognostic significance of PIOS score (cut-off point of the discovery group) also persisted using a binary logistic regression analysis (PD versus rest), adjusted for disease stage and PD-L1 status (p = 0.003, OR: 0.520, 95% CI: 0.339–0.798). The area under the receiver operating characteristic curve was 0.605 (SE = 0.024, 95% CI: 0.558–0.653) in this validation set.
BOR subgroups and statistical correlations.
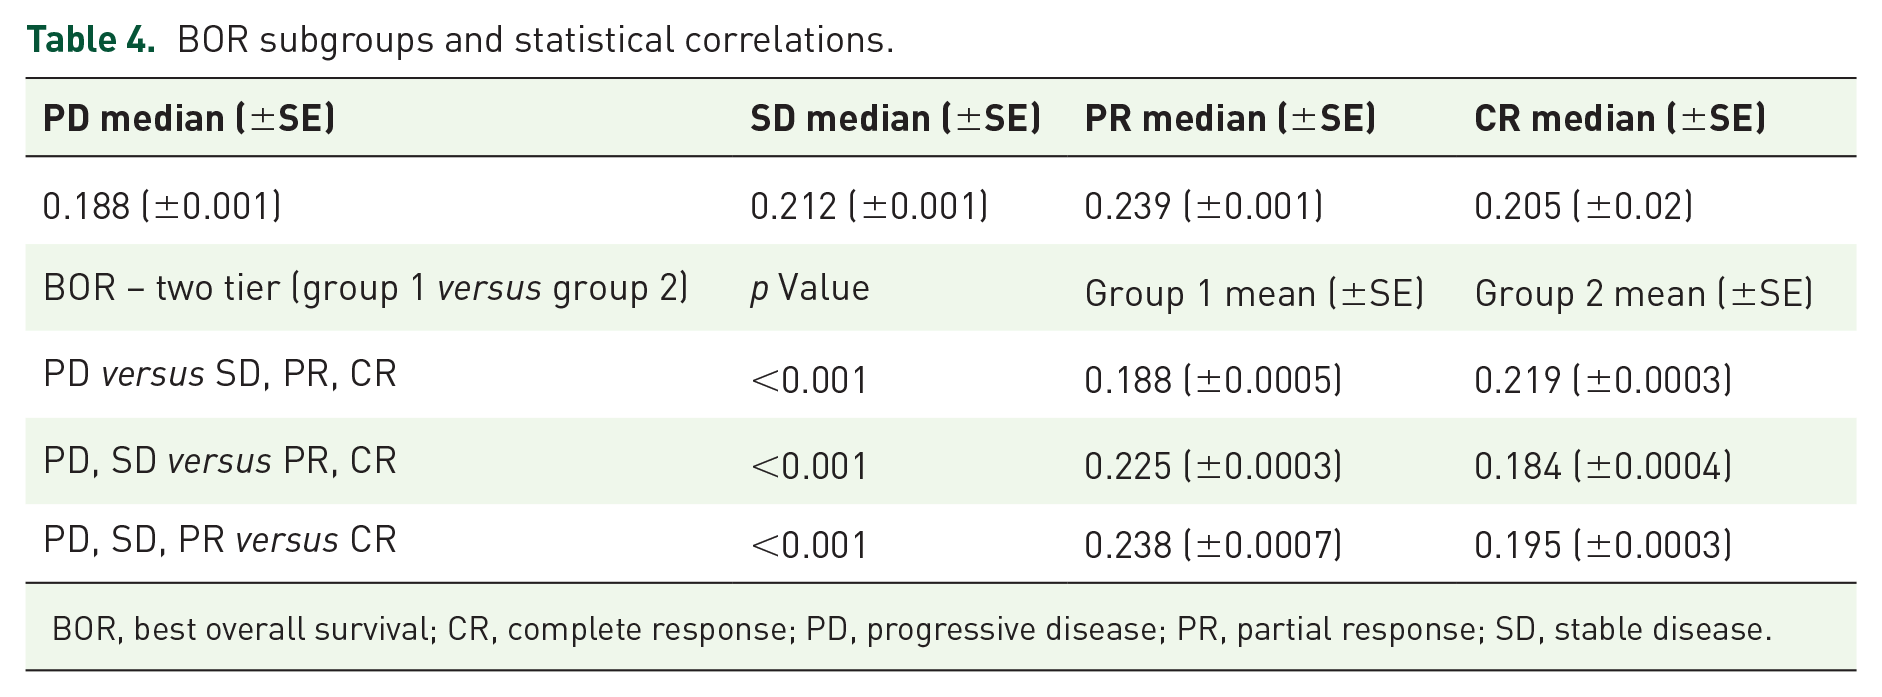
BOR, best overall survival; CR, complete response; PD, progressive disease; PR, partial response; SD, stable disease.
PIOS model in chemotherapy group and its predictive value
To assess the specificity of the PIOS model for patients with aNSCLC treated with ICIs monotherapy, we evaluated its prognostic significance in a chemotherapy-treated cohort. All of the patients (444) enrolled in this subgroup had a PIOS score greater than 0.1761, which was the PIOS cut-off point extracted in the discovery group and which was used in the validation group. 11 For this reason, we used in the univariate analysis as cut-off point the median PIOS score of the patients in this cohort (Table 5). Multivariable analysis was not performed since significant factors in the univariate analysis were already included in the PIOS calculation. The median PIOS for this cohort is 0.3719. In Figure 4, Kaplan–Maier survival curves for patients with high and low PIOS score are presented. No significant statistical association was observed between the patients with high and low PIOS score in the chemotherapy group (log-rank test, p = 0.40866). The median OS for patients with low or high PIOS was 221 and 212 days, respectively.
Univariate (using the covariates with p < 0.05) analysis fitting Cox proportional hazard models for OS.

Only patients with squamous and adenocarcinoma are included.
The cut-off point for the PIOS score is 0.3719 (median of the cohort), since PIOS for all patients was greater than the cut-off point of the PIOS in the discovery group.
ADC, adenocarcinoma; BMI, body mass index; CI, confidence interval; ECOG, Eastern Cooperative Oncology Group; HR, hazard ratio; PIOS, Patras Immunotherapy Score; PS, performance status; SQ, squamous.

Kaplan–Meier Survival curves for OS in chemotherapy group using as cut–off point for PIOS the median of this subgroup.
In addition, in combined analysis of the validation cohort and chemotherapy group, there was a significant interaction between PIOS and the specific treatment (immunotherapy versus chemotherapy, HR = 0.356 with p < 0.001; for PIOS, HR = 0.174 with p < 0.001; for the interaction between PIOS and the type of treatment, HR = 0.066 with p < 0.001), suggesting that the PIOS is both prognostic for NSCLC patients and predictive for the benefit from PD-L1 inhibitor monotherapy. Furthermore, the significant predictive effect of PIOS for patients treated with ICIs was remained when we analysed separately the patients of the immunotherapy group from Greece (n = 405) and Germany (n = 221) (OS HR = 0.04 with p < 0.001, and OS HR = 0.500 with p < 0.001, respectively).
Discussion
The management of NSCLC patients with metastatic disease has tremendously been reformed over the last decade due to the incorporation of immunotherapy and particularly ICIs in the treatment of this patient population, improving response rates and clinical outcome. 4 Despite the impressive results in a big proportion of patients, the majority of them do not experience any benefit, as until now, there are no clinically useful, available biomarkers. 4 The identification of clinically useful biomarkers to recognize the subgroup of patients who will respond to ICIs remains an unmet need.
In this vein, we have recently proposed a new score, which emphasizes on widely available non-interventional parameters, such as PS, BMI, LOT and age, giving rise to the PIOS score. 11 In the current study, we validated the predictive and prognostic value of PIOS in an external multicentre, bigger cohort of aNSCLC patients. Similar to the initial findings, PIOS was statistically associated with the response to ICIs as well as with clinical outcome of aNSCLC patients.
As far as the clinical effects of the factors incorporated in the PIOS are concerned, there is a strong evidence from numerous studies. PS as a starter has been previously documented by Dall’Olio et al. 16 that when equal to or more than two (PS ⩾ 2), according to the ECOG scale, it has a negative impact on prognosis of NSCLC patients treated with ICIs. Furthermore, Ahmed et al. 17 have reported that patients with poorer PS before receiving immunotherapy have inferior PFS and OS, although PS status has not had any correlation with the response. With regard to the underlying mechanism, it has been hypothesized that PS reflects the immune system status and therefore, patients with poor PS may have an immune system with deteriorated functionality. 18
More data exist regarding the close association of BMI, a factor of the PIOS formula, with the efficacy of immunotherapy. Predictive significance of BMI for cancer patients (NSCLC, melanoma, renal cell carcinoma and other types of cancer) treated with ICIs has been reported by Cortellini et al. 19 noting that obesity is associated with better response rates and improved survival outcomes.
The third factor of PIOS index is the age of patients. Age is a clinical characteristic with a well-documented predictive value for ICIs. Kugel et al. 20 published a study some years ago regarding the impact of age in response to immunotherapy, mentioning that getting older increases the chance of melanoma patients to anti-PD-1 therapy response. However, opposite results have come up from a number of studies, blunting the association of age with effectiveness of immunotherapy. For instance, Betof et al. 21 have reported that OS of melanoma patients does not differ across age groups. In this line, Marur et al. 22 a year later, reported that patients ⩾65 years with advanced or metastatic NSCLC, treated with ICIs, experienced similar effectiveness with younger ones. Interestingly, Botticelli et al. 23 have documented a survival advantage for elderly who received nivolumab; however, the difference was slightly over the level of statistical significance (p = 0.057).
The findings from the current study also validated the prognostic value of PIOS in NSCLC patients managed with ICIs, since it was associated not only with PFS but also with OS. Current research has focused on the combination of particular parameters, mainly related to traits of immune system. One of the most assessed score in different cancer types regarding its prognostic value is the neutrophil-to-lymphocyte ratio (NLR), which is based on the measurements in peripheral samples. Poor clinical outcome of patients treated with immunotherapy has been associated with increased NLR scores, 24 as well as with hyper-progressive disease. 25 A meta-analysis by Cao et al. 26 which included 14 retrospective studies, has also confirmed the value of NLR on prognosis of patients treated with nivolumab. Another group of biomarkers are derived by the combination of clinical parameters with immune-related traits. Among them are the cases of advanced lung cancer inflammation index, 27 aggregate index of systemic inflammation, 28 systemic inflammation index, 29 lung immune prognostic index, 24 EPSILoN ECOG PS, smoking history, evidence of liver metastases, levels of lactate dehydrogenase, NLR 18 and immunotherapy sex-ECOG-NLR-delta NLR. 30
Despite the promising results, there are some potential weaknesses in the current study. A limitation of our study is the analysis of retrospective data. To address this issue, a big number of patients from multiple medical centres from Greece and Germany were enrolled. In addition, to increase representation of the cohort, the selection of the patients was performed serially and blindly to the clinical outcome and particularly to patients’ characteristics. Another weakness of the study is the lack of PD-L1 expression for almost one-third of the patients. Furthermore, a potential limitation of the study is also the heterogeneity of the cohort study regarding the LOT.
Despite the aforementioned weaknesses, the validation of PIOS formula confirms our initial observation that simple, non-conventional and non-biological parameters of the patients have a great impact on the response as well as on the clinical outcome of the patients treated with anti-PD-1 agents. The current approaches focus mainly on the biological profile of the disease, while PIOS shed light on the clinical significance of other parameters, which are underestimated. This study shows that PIOS is a robust biomarker for ICIs monotherapy, but not for chemotherapy alone. In addition, given that PIOS is derived from simple and always available factors, it has the potential to lead to rapid integration into clinical practice supporting physicians in the decision-making process. Furthermore, incorporation of specific molecular tumor characteristics in PIOS formula, leading to better sensitivity and specificity, will be a reasonable next step in the way to future clinical exploitation.
Conclusions
In conclusion, we validate in this study the PIOS score, which has been recently generated. This baseline index, which is produced by a combination of non-interventional parameters (PS, BMI, age and LOT), is confirmed to have prognostic and predictive value for aNSCLC patients, treated with anti-PD-1 ICIs as monotherapy.
Footnotes
Acknowledgements
The authors would like to thank Prof. G. Fountzilas, Dr. G. Lainakis, Dr. Z. Saridaki, Dr. Christos Emmanouilides, Dr. N. Touroutoglou, Dr. H. Linardou, Dr. E. Razi and P. Michailidis for their support.