
Abstract
Background and Aims:
The aim of this study was to characterize circulating tumor cells (CTCs) during neoadjuvant chemotherapy (NACT) in early and locally advanced breast cancer (LABC) patients. Using ultrasound, tumor volume measurement was compared with the presence and the molecular nature of CTCs over multiple time intervals corresponding to treatment periods.
Methods:
A total of 20 patients diagnosed with breast cancer (BC) of different histotypes were monitored during the NACT period and in the follow-up period (~5 years). Peripheral blood for CTCs (n = 115) was taken prior to NACT, after two to three chemotherapy cycles, after the completion of NACT (before surgery) and at some time points during adjuvant therapy. CTCs were enriched using a size-based filtration method (MetaCell®) capturing viable cells, which enabled vital fluorescence microscopy. A set of tumor-associated (TA) genes and chemoresistance-associated (CA) genes was analyzed by qPCR in the enriched CTC fractions.
Results:
The analysis of tumor volume reduction after administration of anthracyclines (AC) and taxanes (TAX) during NACT showed that AC therapy was responsive in 60% (12/20) of tumors, whereas TAX therapy was responsive in 30% (6/20; n.s.). After NACT, CTCs were still present in 70.5% (12/17) of patients (responders versus non-responders, 61.5% versus 100%; not significant).
In triple-negative BC (TNBC) patients (n = 8), tumor volume reduction was observed in 75% cases. CTCs were significantly reduced in 42.9% of all HER2-negative BC patients. In HER2+ tumors, CTC reduction was reported in 16.6% only. Relapses were also more prevalent in the HER2-positive patient group (28.5 versus 66.6%).
During NACT, the presence of CTCs (three tests for each patient) identified patients with relapses and indicated significantly shorter progression-free survival (PFS) rates (p = 0.03). Differentiation between progressive disease and non-progressive disease was obtained when the occurrence of excessive expression for CA genes in CTCs was compared (p = 0.024). Absence of tumor volume reduction was also significantly indicative for progressive disease (p = 0.0224).
Disseminated CTCs in HER2-negative tumors expressed HER2 in 29% of samples collected during the overall follow-up period (16/55), and in 32% of samples during the follow-up of NACT (10/31). The change accounted for 78.5% of HER2-negative patients (11/14) in total, and 63.6% of the conversion cases occurred during NACT (7/11). For the remaining four patients (36.3%), conversion to HER2+ CTCs occurred later during adjuvant therapy. We believe there is the possibility of preventing further progression by identifying less responsive tumors during NACT using CTC monitoring, which could also be used effectively during adjuvant therapy.
Keywords
Introduction
Neoadjuvant chemotherapy (NACT) is indicated mainly for locally advanced breast cancer (LABC), which involves stage IIB (T2N1, T3N0) and stage III, including inflammatory breast cancer (IBC). NACT is implemented to reduce tumor volume to convert inoperable to operable tumors or to replace mastectomy with breast-conserving surgery (BCS). NSABP B-18 and EORTC 1092 trials reported that application of NACT was connected mainly to downstaging of the disease.1–3 However, subgroup analysis of both trials showed a trend towards better outcomes in patients under 50 years of age. 1 The same benefit of adjuvant chemotherapy was reported in young premenopausal women and women under 50 years of age.4,5 Moreover, early indication of NACT and response to a doxorubicin (A) and cyclophosphamide (C) regimen yielded better disease-free survival (DFS) and overall survival (OS) compared with patients undergoing adjuvant treatment with docetaxel (D) in the B27 study. 6
The current indication for NACT is based on tumor biology and is considered a treatment option in BC patients with a high risk of tumor dissemination and worse prognosis. 7 The most important finding in neoadjuvant studies is the association between pathological complete response (pCR) and long-term clinical outcomes. pCR occurs mainly in patients with aggressive breast cancer (BC) subtypes. 8 Tumors showing high proliferation [Luminal B (HR+, HER2+), HER2+, TNBC] have higher rates of pCR compared with Luminal A (HR+, HER2–). 9 Post-treatment residual disease and Ki67 levels also seem to have prognostic significance.10,11 It is reported that particularly patients with extensive residual disease and Ki67 > 35% after NACT have significantly worse outcomes. The need for new biomarkers reflects the shortcomings of existing therapeutic options. Although AC and TAX regimens in NACT are considered standard clinical practice, recurrence due to clonal expansion and/or resistance of residual tumor cells due to treatment selection pressure occurs.
The metastatic potential of BC could be stratified not only by primary disease subtype, but also measured by the presence of circulating tumor cells (CTCs). Although their occurrence in the blood is very rare, CTCs have a significant prognostic value in patients with primary BC (PBC) and metastatic BC (MBC).12–14 However, the clinical utility based on the predictive value of CTC enumeration remains uncertain. The genomic characteristics of CTCs may indeed be more important for therapy recommendation as suggested by the SWOG S0500 trial as well as enhancement of patient outcomes.15–17
Clusters are one of the typical CTC characteristics that can be present in patients with BC. CTCs that are bound together may exhibit 23- to 50-fold higher metastatic potential than single CTCs.18,19 The presence of these clusters in peripheral blood of patients has been clearly associated with shorter progression-free survival (PFS), metastatic-free survival (MFS), and overall survival (OS) in various types of BC compared with individual CTCs.19,20
Many enrichment methods have been implemented successfully into laboratory practice to enrich, detect, and isolate CTCs from a simple blood draw. Immunomagnetic and size-based isolation techniques are the most commonly used.21–24 CTCs can be detected by immunofluorescence staining, 25 laser scanning cytometry, 26 or quantitative polymerase chain reaction (qPCR). 27
In the case of BC, several markers are known to have different expression ratios when non-malignant normal cells are compared with tumor cells, such as cytokeratin 19 (KRT19), human epidermal growth factor receptor 2 (HER2), epithelial cell adhesion molecule (EpCAM), mucin 1 (MUC1), epidermal growth factor receptor (EGFR), mammaglobin (MGB), and maspin.
Another promising marker that can be potentially used for BC diagnostics and therapy is the disialoganglioside GD2 subtype (GD2) due to its overexpression in tumors.28,29 A high prevalence of GD2 in aggressive BC subtypes such as MBC and TNBC was observed.30,31
A new targeted therapy with glembatumumab vedotin (CDX-011) is currently under evaluation in clinical trials. Its aim is to attack the glycoprotein non-metastatic b (GPNMB).32–34 Similarly, clinical trials confirmed the efficacy of sacituzumab govitecan-hziy, which is a trophoblast cell surface antigen 2 (TROP2)-directed antibody-drug conjugate. Other clinical trials in TNBC and other MBC forms are currently ongoing.33,35
Individually, these markers could be used for CTC identification at the molecular level. However, even greater specificity can be achieved by using a multi-marker assay to profile each marker simultaneously.36–39 In previous studies, the size-based filtration system (MetaCell®) was found to reliably recover viable CTCs from BC patients for cytomorphologic evaluation. It also permitted downstream CTC molecular characterization.
Despite clinical advances, in some patients, minimal residual disease (MRD) can persist and give rise to clonally advanced and resistant disease. Although it is known that phenotypic differences between primary tumor and CTCs exist,40–44 patients are still treated according to primary tumor characteristics. Recent therapeutic indications do not reflect the dynamic changes that occur in tumor cells, which are the target of chemotherapy. In this study, we compared tumor response during NACT with anthracyclines (AC) and/or taxanes (TAX) as measured by tumor volume with the presence and characterization of CTCs over multiple time intervals corresponding to standard treatment cycles. We reported the use of real-time molecular characterization of chemoresistance and tumor-related genes following size-based enrichment (MetaCell®) of CTCs in predicting therapeutic decisions and PFS.
Patients and methods
Study design
In total, 20 BC patients undergoing NACT were enrolled in the study. The analysis comprised 115 blood samples obtained during regular medical examinations between 2014 and 2016. CTC assessment was performed prior to NACT, during NACT and/or before and after surgery. If NACT included sequential administration of AC and TAX, blood collection was usually performed before the first AC cycle, before the first TAX cycle and before the last TAX cycle. CTCs were enriched from peripheral blood (8 ml) by size-based filtration (MetaCell®, Prague, Czech Republic). 45 To provide more detailed study protocols, a treatment plan for each patient is shown in Supplemental file SF1. Figure 1 is an example and is related to patient no. 7.

Schematic study protocol for patient no. 7. Disease course, therapy administration (neoadjuvant, adjuvant period) and CTC sampling are documented over the follow-up period. Gene expression testing was performed for positive CTC samples. Genes listed under the CTC+ had higher expression in enriched CTC fraction than in the paired white blood cell fraction. The figures clearly show the evolution of resistant cancer cell clones later during adjuvant therapy (Tamoxifen with Zoladex). Personalized graphic protocols for each patient in the study are included in Supplemental file SF1: Patient follow up.
Patient characteristics
Table 1 and Supplemental File ST1 show patient characteristics. The median age of the group was 39 years. In the study, only one patient was postmenopausal (aged 71 at diagnosis). Of NACT-indicated patients, 16 subjects were treated for LABC with lymph node involvement. Negative lymph nodes (N0) were reported in 4 of 20 patients.
Clinicopathological features of patients in study (N = 20). CTC positivity is reported before NACT start and after NACT.

CTC, circulating tumor cell; ER, estrogen receptor; HER2, human epidermal growth factor receptor 2; NACT, neoadjuvant chemotherapy; ns, non-significant; PR, progesterone receptor.
Based on histological evaluation, BC was classified as invasive carcinoma of no special type (NST) in 5 cases, invasive ductal carcinoma (IDC) in 14 cases, or medullary carcinoma in 1 case. Most cancers (16/20) were poorly differentiated (grade 3; G3), 3/20 carcinomas were graded G2 and 1/20 carcinoma was well differentiated (G1).
All patients presented with very aggressive disease based on proliferation parameters (Ki67) of tumor cells; 19/20 primary tumors exhibited Ki67 expression of at least 40%. Altogether, 12/20 tumors were estrogen receptor positive (ER+) and/or progesterone receptor positive (PR+), 6/20 patients were HER2 positive (HER2+); 9/20 patients were classified as TNBC. Patient no 7 was also classified as TNBC given that postoperative ER and PR status was negative. According to the subtype classification, 5/20 patients were HR+/HER2– (luminal B), 4 of 20 patients were HR+/HER2+ (luminal B, HER2+), 2 of 20 patients were HR–/HER2+ (HER2-amplified/overexpressed), and 9 of 20 patients were TNBC (ER–, PR– and HER2–).
Clinicopathologic features of each patient enrolled in the study (N = 20) are reported in detail in Supplemental Table ST1, including details on individual risk (mutation, pregnancy, etc.). NACT regimens and chemotherapeutic dosing are reported in Supplemental file SF2: Methods.
CTC examination
CTCs were enriched from peripheral blood (EDTA/6–8 ml) by a size-based filtration method (MetaCell®, Czech Republic). 45 The enriched cells were incubated for 3–5 days in vitro (37°C, 5% CO2) and assessed in a two-step manner.
Cytomorphologic evaluation of viable cells by vital fluorescence microscopy (NucBlue®, Celltracker®, Mitotracker®, Thermo Fisher Scientific, Waltham, MA, USA) was followed by qPCR analysis of RNA isolated from the CTC fraction. qPCR analysis included tumor-associated (TA) and chemoresistance-associated (CA) genes. For more details, please see Supplemental file SF2: Methods.
Patient blood samples were classified as CTC-positive by combined microscopic evaluation and molecular analysis. In the cytomorphological analysis, fluorescently stained viable cells were scored according to the following criteria: nucleus size, nuclear membrane irregularity, prominent nucleoli, nucleoli count, cell size, and the presence of two-dimensional (2D) and three-dimensional (3D) cell sheets, etc. The recovered size-enriched fractions of cells captured on the membrane were lysed in RLT+ β-mercaptoethanol buffer and stored at −20°C for subsequent RNA analysis.
The qPCR analysis was based on analyzing differences between the whole blood leukocyte fraction (white blood cell; WBC) and enriched CTC fractions (with and without in vitro incubation). The following TaqMan™ Gene Expression Assays (Thermo Fisher Scientific) were used for gene expression monitoring in all samples: TA genes, including ACTB (control), CD24, CD44, CD45, CD68, KRT19, EpCAM, MUC1, MGB, HER2, ESR, and PGR, as well as CA genes, including MRP1, MRP2, MRP4, MRP5, MRP7, MDR1, and ERCC1.
Based on gene expression analysis, CTC-enriched samples with elevated relative expression levels in two or more TA genes were considered CTC-positive when compared with their matched WBC samples.
Statistical analysis
The data were compared by standard tests using GraphPad Prism software v.9.1:0 (GraphPad Prism, San Diego, CA, USA). The evaluation of qPCR data was based on the standard ddCT method. 46 qPCR results were analyzed using GenEx Professional software (MultiD, SE), which enabled multifactorial comparisons between the involved groups. Relative RNA levels are shown graphically in clusters (Supplemental files SF2: Methods). The differences between the samples were compared by the U Mann–Whitney test (significance level at p < 0.05 if not set automatically by GenEx).
Results
CTCs and tumor volume regression during NACT
The effects of NACT were evaluated clinically by bimanual breast palpation and ultrasound examination at the time of blood collection for CTC tests. Regression of the tumor mass was assessed as significant [response rate 3 (RR = 3)] if the tumor volume was reduced by more than 50%, as moderate (RR = 2) if the degree of regression was 50%, and as minimal (RR = 1) if the degree of regression was less than 50%. For non-significant tumor regression or even progression, a response rate equal to zero (RR = 0) was applied. Patients with RR = 2 and 3 were assigned as responders in further analyses.
The analysis of tumor volume reduction following the administration of AC versus TAX during NACT showed that AC therapy was assessed as responsive in 60% (12/20) of tumors compared with TAX in 33.3% (6/20) [not significant (ns)]. The complex NACT effect was significant in 70% of patients in the tested cohort (14/20). Table 2 shows more details. The response rate was slightly higher in HER2-negative tumors when compared with HER2-positive tumors (64.2% versus 50%; ns); 75% responsiveness was reported for TNBC (Table 3).
Effect of NACT therapy is reported for different NACT-periods by tumor volume reduction and CTC testing.

AC, anthracyclines; CTC, circulating tumor cell; ER, estrogen receptor; NACT, neoadjuvant chemotherapy; ns, non-significant; RR, response rate; TAX, taxanes.
Effect of NACT therapy is reported for different BC histology types by tumor volume reduction and CTC testing without any significant difference.

BC, breast cancer; CTC, circulating tumor cell; HER2, human epidermal growth factor receptor 2; HR, hormone receptor; NACT, neoadjuvant chemotherapy.
CTCs were detected in 85% of patients (17/20) prior to NACT, in 88% of patients after AC therapy (16/18), in 72% of subjects after TAX therapy (12/18). No significant difference was found between the groups in terms of the presence of CTCs when the group of non-responders was compared with the group of responders. However, 100% CTC positivity was found for the non-responder group after NACT as compared with 61.5% CTC positivity in the responder group (Table 2).
After completing NACT, reduction in CTCs was observed in more HER2-negative tumors compared with HER2-positive tumors (42.9% versus 16.6%) (ns) (Table 3).
During the follow-up period (185–2455 days, mean 1862 days), 8/20 patients relapsed (40%). During NACT, all of these patients were positive for CTC in all tests. The CTCs obtained from these samplings expressed an excessive number of CA genes (⩽4). There was a significant difference in comparison of PFS rates between the group with expression of more than four CA genes and the group with the expression of fewer than four CA genes during NACT (p = 0.024).
During NACT, the presence of CTCs (three consecutive tests for each patient) identified patients with relapses and indicated significantly shorter PFS rates (p = 0.03). Absence of tumor volume reduction was also significantly indicative for progressive disease (p = 0.0224).
Overall, NACT did not significantly affect CTC positivity in the samples.
After NACT, CTCs were still present in 70.5% (12/17) of patients (responders versus non-responders, 100% versus 61.5%; ns).
CTCs released from the HER2-negative tumors expressed HER2 in 29% of all samples collected during the whole follow-up period (16/55) and in 32% of samples from NACT follow up (10/31). The change accounted for 78.5% of HER2-negative patients (11/14) in total. During, NACT 63.6% (7/11) of conversion cases occurred. For the remaining four patients (36.3%), conversion to HER2+ CTCs occurred later during adjuvant therapy.
During NACT, CTC reduction was observed in 42.9% of the HER2-negative patients, but only in 16.6% of the HER2-positive BC patients. Relapses were also more prevalent in the HER2-positive patient group (28.5 versus 66.6% ns)
Complex information on NACT effects reflected in captured CTCs is shown in detail in Table 4 and Supplemental File ST1. Development of chemoresistance during NACT and adjuvant treatment is given in detail in Table 4 and Supplemental file SF: Patient follow ups. The proportion of chemoresistant CTCs in the CTC fraction was related to worse therapy outcome. Resistant patients had elevated MRP1 gene during AC therapy and MRP1 and MRP7 genes during and after TAX therapy (Table 4).
Gene expression profiling of CTCs and responsiveness to the therapy is shown during NACT (AC,TAX) in connection to the time from prognosis to the progression/death. Values of progression time are shown in red for patients suffering metastatic disease.

AC, anthracyclines; CTC, circulating tumor cell; NACT, neoadjuvant chemotherapy; TAX, taxanes.
Changes in primary tumor characteristics and CTCs during NACT
After completing NACT and surgery, definitive histology was compared with the pre-treatment biopsy (Supplemental file ST1). In most cases, the effect of NACT was linked to a significant decrease in Ki67. The decrease in Ki67 was very small or absent in only two cases (patients no 9 and 14). The BC phenotype changed significantly in one patient (no 9; pregnancy during NACT). We hypothesize that the loss of ER and PR expression could be caused by termination of pregnancy. Insufficient duration of NACT and AC monotherapy could be the cause of a small decrease in Ki67.
The loss of ER/PR+ expression under the influence of NACT is reported in Supplemental file ST1. The distribution of primary tumors, i.e., ER+, HER2+ and TNBC, was 25%, 30%, and 45%, respectively. The discordance in ER and HER2 expression in primary tumors and CTCs is given in Tables 5 and 6.
Conversion of ER/HER2- status in CTCs samplings during the overall follow-up.
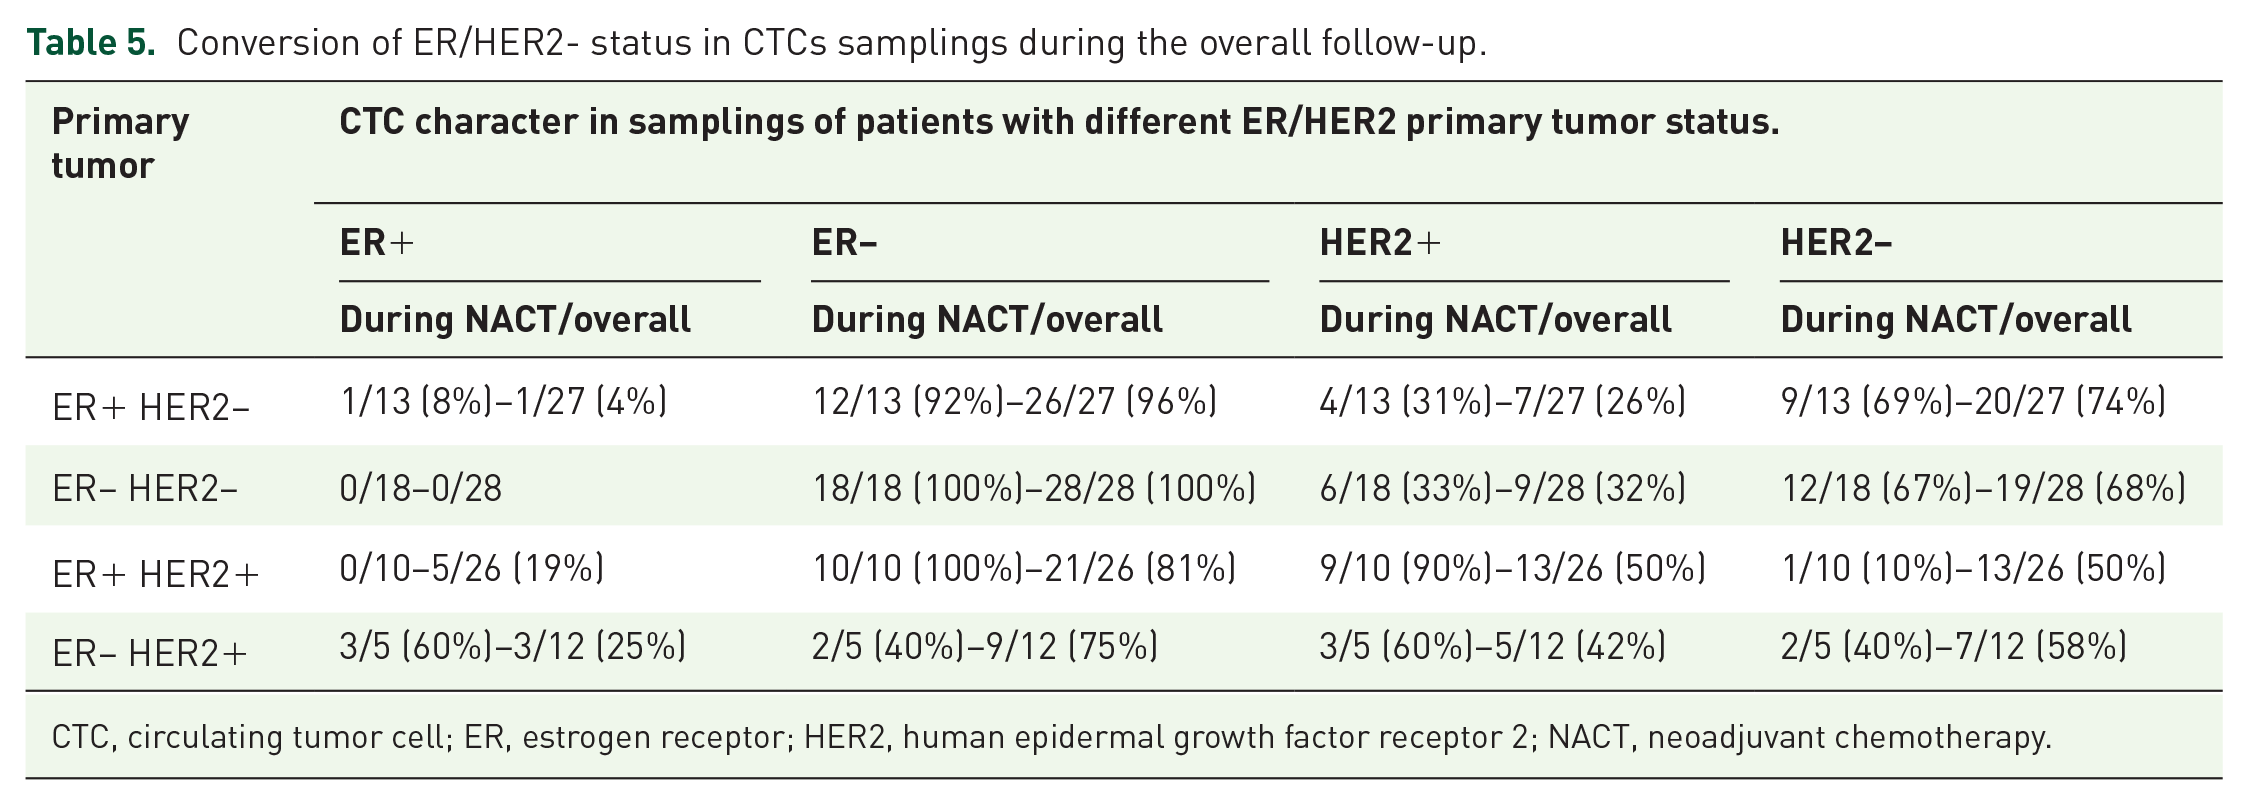
CTC, circulating tumor cell; ER, estrogen receptor; HER2, human epidermal growth factor receptor 2; NACT, neoadjuvant chemotherapy.
Conversion of HER2– status in CTCs during the overall follow up reported for patients in different histopathological groups.

CTC, circulating tumor cell; HER2, human epidermal growth factor receptor 2; HR, hormone receptor.
The distribution of CTCs during NACT was discordant in patients with ER-positive primary tumors (only 8% CTCs were ER+). During NACT, 80% of samples from HER2+ patients showed increased HER2-negative expression. Interestingly, the phenotypic evaluation of CTCs during NACT showed HER2+ CTCs in TNBC in 32% and in 29% of samples during follow up. In HER2+ primary BC, discordance in HER2 status in CTCs was observed in nearly 50% cases. Therefore, in these patients, CTCs predominantly retained more aggressive properties. Tables 5 and 6 list more details on ER/HER 2.
Monitoring of BC treatment during NACT and after the surgical period
During follow up (1–5.5 years), we observed relapse in eight patients, six of whom died. In our group of patients, the 1-year OS was 95% (1/20 died), the 2-year OS was 78% (3/20 died), and the 5-year OS was 70% (6/20 died).
Follow up of all patients enrolled in the study is shown in Supplemental File SF1: Patient follow ups. The follow-up protocols include reports on the presence and characterization of CTCs during disease monitoring. Specific attention was paid to patients who achieved pCR after NACT.
Figure 1 shows the case of a young patient (no. 7) with LABC (medullary character). She underwent standard AC and TAX therapy with very good clinical effect (RR = 3), which was reported after TAX therapy. Although CTCs displayed no markers of chemoresistance before therapy, the expression was present during and after AC (the former with multi-resistant and the latter with AC-resistant CTC phenotype). Interestingly, HER2+ and ESR1 (ER) expressing CTCs were present in either both or one of the later blood draws, respectively.
The effect of TAX was confirmed both during the histological examination and MRD and the results showed pCR and CTC negativity. As the primary tumor was ER-positive and PR-positive, the patient was still on adjuvant hormonal therapy. The first follow-up blood analysis conducted 5 months after surgery did not show CTCs, but tests performed later (12 months and 15 months postoperatively) revealed MRD based on the presence of CTCs. Our data suggest that CTCs were not sensitive to hormonal therapy given their increased expression of chemoresistance markers. Although the patient remained in clinical remission, the persistence of chemoresistance in CTCs warrants close monitoring.
Discussion
NACT is a standard approach in the therapy of LABC, and CTCs are believed to be associated with tumor aggressiveness. Studies have reported a lower prevalence of CTCs in PBC compared with MBC, with positivity rates ranging from 22 to 23% before NACT, from 10 to 17% after NACT,47–49 and from 19 to 43% in the adjuvant setting.50–53 Lavrov et al. detected CTCs in 38% of patients with early triple-negative disease and 42% of triple-negative LABC. 54 By using multi-cytokeratin-specific antibodies to detect CTCs, Serrano et al. 55 observed CTCs in 70% of patients before NACT and in 54% of subjects after NACT. Camara et al. 56 reported an even higher frequency of 83% in patients prior to NACT.
Pierga et al. 57 detected CTCs in 39% of patients before the start of therapy and a rapid decrease to 9% after four cycles of chemotherapy. CTC analysis conducted by Sabatier et al. 58 revealed 25% and 8.9% of CTCs-positive patients at inclusion and after one cycle of therapy, respectively.
In our study, CTCs were detected in 85% of patients before NACT and 70.5% of subjects after NACT. The relatively high detection rate of CTCs in our cohort can be explained by a high prevalence of clinical risk factors (95% of young premenopausal woman, 75% of HER2+ and 45% of TNBC, 100% of tumors with high Ki67 and 80% patients with G3, and 75% of patients with LABC with lymphatic node involvement).
Another explanation of high CTC detection rates may be the uniqueness of the CTC enrichment method used in the study protocol. The two-step detection protocol (MetaCell®) combining size-based filtration with cytomorphological and molecular characterization may identify more CTCs that go beyond the limited epithelial definition based only on EpCAM and cytokeratin expression [e.g., of 105 CTC samples analyzed by qPCR, increased expression of EpCAM was confirmed in only 16 cases (15.2%), whereas the expression of KRT 18/19 was documented in 90 (85.7%), HER2 in 34 (32.5%), MUC1 in 31 (29.5%) and MMG in 12 samples (11.4%)].
The presence of CTCs before or after chemotherapy was associated with worse outcome compared with patients who were persistently CTC-negative in the SUCCESS trial. 59
Similarly, in the phase II AVASTEM trial, CTC detection at baseline was a prognostic marker for BC (NACT-bevacizumab combination independently of tumor response). 58 Many studies have clearly demonstrated a prognostic impact of CTCs not only in MBC but also in early BC.60–62
In our study, patients remained CTC-positive during NACT (85% of CTC+ before NACT, 88% of patients after AC, 70.5% of subjects after NACT). It is expected that, under the influence of NACT, tumor cell mobilization occurs and the number of released proliferating CTCs decreases. On the other hand, CTCs released from the primary tumor induced by NACT can lead to an increasing number of CTCs or their fragments detected in the circulation. Additionally, it was shown that systemic response to treatment was independent of local response. 59
Our analysis showed that TNBC tumors were more sensitive to NACT, and the effect of AC was more significant in these tumors than the effect of TAX when tumor volume reduction was compared.
Unfortunately, we cannot confirm the correlation between tumor shrinkage and the decrease in the number of CTCs due to the methodological limitations of MetaCell®.
However, NACT responders were found mainly in the group of patients with CTCs expressing epithelial markers and CTCs with a minimal CA-gene expression. CTC negativity during NACT was found only in patients with the documented clinical effect (tumor volume reduction measured by ultrasound). In NACT non-responders, two or more CA-genes were usually frequently overexpressed in the CTC fraction.
To answer the question of how long NACT should be administered in the case of permanent presence of CTCs, it needs to be elucidated whether the presence of CTCs has a more prognostic or predictive value.
pCR is usually defined as the absence of invasive and non-invasive carcinoma in breast tissue. In the presented study, HER2+ tumors responded in 50% of cases, whereas TNBC responded in 75% (6/8) of cases. If we assume that aggressive cancer cells and CTCs may exist in these subtypes, we could hypothesize that pCR could be explained by the eradication of highly proliferating tumor cells (sometimes in significant numbers). In both aspects, the number and the characteristics of tumor cells could be equally important. Based on our observations, we conclude that CTC characterization could significantly supplement the information on the number of CTCs.
Several neoadjuvant clinical trials in BC assessed the benefit of combining additional chemotherapy (e.g., capecitabine) or targeted therapy (e.g., bevacizumab) with a standard AC or TAX-based chemotherapy regimen. Although the results of combination regimens in HER2-negative tumors are unconvincing,63–65 targeted anti-HER2 therapy added to standard NACT improved significantly the outcomes for HER2-positive patients.66–68 In these studies, a higher incidence of pCR in ER-/HER2+ (HER2-enriched) subtype was also shown compared with ER+/HER2+ BC. For patients with TNBC who participated in the CALGB and GeparSixto trials, significant improvement in pCR rates in the breast and axilla was demonstrated when carboplatin was added to more complex neoadjuvant AC- and TAX-based regimens.69,70 In the GeparTrio trial, 71 the benefit of switching NACT in non-responding patients was evaluated. Patients with no clinical response to neoadjuvant TAC (docetaxel, doxorubicin, cyclophosphamide) were randomized to four additional cycles of the same regimen or four cycles of vinorelbine and capecitabine. Although the benefit for ER+ patients was outlined (DFS, OS), future studies are warranted to specify treatment according to the molecular profile of the disease. Thus, the need for new biomarkers reflects the shortcomings of existing therapy options. Although AC and TAX regimens in NACT are considered standard clinical practice, recurrence due to clonal expansion and/or resistance of residual tumor cells due to treatment selection pressure occurs.
Clinical trials showed that NACT has the same benefit for patient prognosis as adjuvant therapy. It can be assumed that the higher volume of MRD in patients treated with NACT should have no effect on the risk of disease relapse. On the other hand, the prognostic value of CTCs is based on their rate in blood. However, detailed studies should be performed to find the connection between primary disease and the prevalence of CTCs.
In our study, pCR after NACT was achieved in 4/9 TNBC patients. Despite pCR in the case of TNBC patients, all their blood samples were assessed as CTC-positive. The validation of prognostic significance of CTCs is needed before we can say that the eradication of CTCs could be a new goal of treatment instead of pCR.
CTCs can survive as non-proliferating, dormant cells, and are associated with higher resistance to chemotherapy. 72 After the completion of NACT, we found a few cases with persistent multi-resistant CTCs refractory to therapy (CTC samples were positive for more than one chemoresistance gene in 7/20 cases, 35%). Considering the higher significance of CTC characteristics, the question of how to treat resistant disease arises. One option could be related to the use of CTC-targeted therapy, while another one could be connected with the removal of the primary tumor rather than random systemic treatment.
The significance of the status of CTCs after definitive treatment and their long-term persistence was assessed in many studies. The results obtained in the SUCCESS trial suggested CTC detection after chemotherapy was associated with shorter DFS and OS. 73
Van Dalum et al. 74 reported a significantly shorter time to disease recurrence and death in women with detectable CTCs 1, 2, or 3 years after the end of adjuvant therapy or radiotherapy compared with CTC-negative patients. Similar results were also obtained by Trapp et al. 75 Sparano et al. observed a 13-fold higher risk of recurrence in patients 5 years after diagnosis and without clinical evidence of disease when at least one CTC was detected at a late time point. 76
The negative results of the SWOG 0500 study could be based on the lack of CTC characterization. We found a significant discordance in ER and HER2 status compared with primary disease and MRD. HER2+ primary tumors retained HER2+ CTCs, mainly during NACT, after which they lost sensitivity to anti-HER2 therapy, very often during adjuvant trastuzumab therapy. HER2 status changed very dynamically and CTCs retained aggressive properties in HER2-negative tumors. Up to 23% of the CTCs samples in HER2-negative tumors were confirmed to be HER2-positive. This percentage was found in 11 of 14 HER2-negative patients. This number should be highly considered in the context of HER2 aggressiveness.
The comparison of responders and non-responders (patients developing disease relapse during adjuvant therapy) at the molecular level could complete our knowledge related to the significance of CTCs in the post-operative follow up of patients as documented in the Supplemental file SF1: Patient follow ups. Prolongation of adjuvant hormonal therapy was shown to have clinical significance, confirming that the persistence of MRD exists long after surgery and requires longer treatment.
We hypothesize that simultaneous CTC monitoring could predict the risk of disease relapse earlier and more accurately compared with standard tumor markers and imaging studies. Therefore, both the number and CTC characteristics can play a critical role.
As CTC-guided therapy is not clinically indicated today, CTCs could be used just for treatment response monitoring. Promising designs of new studies focused on the predictive value of CTCs and studies of large numbers of patients are the main prerequisite for defining the predictive value of CTCs.17,77–81 CTCs could be used as a tissue source for testing sensitivity to different drugs in the future, which is highly attractive. 82
Conclusions
The relationship between CTCs and the response to tumor therapy was analyzed from the perspective of different tumor histopathology. We believe that monitoring of the presence of CTCs during NACT, including gene expression analysis of TA genes and CA genes, could identify patients at continuous risk and predict therapy outcomes. CTCs in patients with non-responding tumors expressed an excessive number of genes associated with chemoresistance.
Ultrasound monitoring alone is perhaps insufficient, whereas the combination of ultrasound and CTC monitoring could prove to be beneficial and enable earlier detection of disease relapse. Therefore, in cases of non-responding tumors based on the volume and the presence of chemoresistant CTCs, it may be more effective to reconsider the duration of NACT and possibly to switch from AC to TAX or to discontinue NACT and proceed to surgery. There are no data on the prolongation of NACT beyond the standard duration. The results from adjuvant trials with metronomic dosing of chemotherapy or adjuvant systemic treatment during NACT may clarify the connection between persistent MRD and patient outcome. We believe that CTC-targeted therapy may improve patient outcome even if used only for monitoring therapy response. Until the end of prospective trials targeting the predictive value of CTCs, the utility of CTCs and CTC-related information are limited to palliative indications or support adjuvant therapy choice (i.e., indication for adjuvant chemotherapy in TNBC to treat residual disease after NACT).
Supplemental Material
sj-docx-1-tam-10.1177_17588359211028492 – Supplemental material for Characterization of circulating tumor cells in early breast cancer patients receiving neoadjuvant chemotherapy
Supplemental material, sj-docx-1-tam-10.1177_17588359211028492 for Characterization of circulating tumor cells in early breast cancer patients receiving neoadjuvant chemotherapy by Anna Jakabova, Zuzana Bielcikova, Eliska Pospisilova, Lubos Petruzelka, Piotr Blasiak, Vladimir Bobek and Katarina Kolostova in Therapeutic Advances in Medical Oncology
Supplemental Material
sj-pptx-2-tam-10.1177_17588359211028492 – Supplemental material for Characterization of circulating tumor cells in early breast cancer patients receiving neoadjuvant chemotherapy
Supplemental material, sj-pptx-2-tam-10.1177_17588359211028492 for Characterization of circulating tumor cells in early breast cancer patients receiving neoadjuvant chemotherapy by Anna Jakabova, Zuzana Bielcikova, Eliska Pospisilova, Lubos Petruzelka, Piotr Blasiak, Vladimir Bobek and Katarina Kolostova in Therapeutic Advances in Medical Oncology
Supplemental Material
sj-xlsx-3-tam-10.1177_17588359211028492 – Supplemental material for Characterization of circulating tumor cells in early breast cancer patients receiving neoadjuvant chemotherapy
Supplemental material, sj-xlsx-3-tam-10.1177_17588359211028492 for Characterization of circulating tumor cells in early breast cancer patients receiving neoadjuvant chemotherapy by Anna Jakabova, Zuzana Bielcikova, Eliska Pospisilova, Lubos Petruzelka, Piotr Blasiak, Vladimir Bobek and Katarina Kolostova in Therapeutic Advances in Medical Oncology
Footnotes
Conflict of interest statement
The authors declare that there is no conflict of interest.
Funding
The authors disclosed receipt of the following financial support for the research, authorship, and/or publication of this article: Supported by Medical University Wroclaw SUB.C010.21.038.
Ethical approval
All procedures performed in studies involving human participants were in accordance with the ethical standards of the institutional and/or national research committee and with the 1964 Helsinki declaration and its later amendments or comparable ethical standards. The Ethics Committee of the University Hospital Kralovske Vinohrady Prague approved the study protocol according to the Declaration of Helsinki (decision EK-VP/32/02014). All patients provided written consent.
Supplemental material
Supplemental material for this article is available online.
References
Supplementary Material
Please find the following supplemental material available below.
For Open Access articles published under a Creative Commons License, all supplemental material carries the same license as the article it is associated with.
For non-Open Access articles published, all supplemental material carries a non-exclusive license, and permission requests for re-use of supplemental material or any part of supplemental material shall be sent directly to the copyright owner as specified in the copyright notice associated with the article.