
Abstract
Background:
We retrospectively evaluated the correlation between a baseline measurement of circulating tumor cells (CTCs) and inflammation-based scores in patients with metastatic breast cancer (MBC).
Methods:
The optimal value of inflammation-based scores as the neutrophil–lymphocyte ratio (NLR), platelet–lymphocyte ratio (PLR), monocyte–lymphocyte ratio (MLR) and systemic immune-inflammation index (SII) to predict survival was determined and compared with CTC <5 or ⩾5 per 7.5 ml of blood.
Results:
In the overall population of 516 women with MBC, CTCs correlated with peripheral blood monocytes (p = 0.008) and neutrophils (p = 0.038). In triple-negative tumors, CTCs correlated with monocyte count (p = 0.009); in HER2+ tumors, CTCs correlated with neutrophil count (p = 0.009), with a trend versus monocyte count (p = 0.061), whereas no correlation was found in HER2– estrogen receptor-positive (ER+) tumors. In multivariate analysis only monocytes were associated with ⩾5 CTCs (OR = 2.72, 95% CI 1.09–6.80, p = 0.033). In multivariable analysis for predictors of overall survival, CTC (⩾5 versus <5), number of metastatic sites (>1 versus 1), tumor subtypes (triple-negative versus HER2– ER+ tumors) and MLR only remained significant.
Conclusions:
CTC and MLR are predictors of overall survival in MBC. CTC correlates with monocytes, in particular in triple-negative tumors.
Introduction
Inflammation/immune microenvironment mediates tumor progression in metastatic breast cancer (MBC), and influences the prognosis.1–3
Circulating tumor cells (CTCs) represent a population of cancer cells involved in tumor progression and dissemination. 4 Peripheral blood represents an adversarial microenvironment for CTCs due to the presence of immune cells and other factors that interfere with the metastatic process. The detection of CTCs in peripheral blood is feasible and reliable, and the presence of ⩾5 CTCs/7.5 ml of peripheral blood in MBC patients predicts worse progression-free survival (PFS) and overall survival (OS). 5 Furthermore, in patients starting a new line of systemic therapy, the presence of CTCs at baseline and during therapy is able to provide an early assessment of treatment failure, even if with persistently elevated CTCs early switching to an alternate therapy is not effective in prolonging OS.6–8
Cancer and inflammation are strictly linked and cancer patients present local and systemic modifications in inflammatory parameters. 9 These include alterations in neutrophils, lymphocytes, platelets and systemic immune-inflammation index (SII), the platelet–lymphocyte ratio (PLR), the neutrophil–lymphocyte ratio (NLR), the monocyte–lymphocyte ratio (MLR), erythrocyte sedimentation rate, the level of serum inflammatory cytokines, and acute-phase proteins observed in infectious or inflammatory diseases.9–13
Lymphocytopenia and CTCs have been reported as independent prognostic factors in MBC, and both have been associated with bone metastases. Specifically, in a retrospective review of MBC patients, we found CTCs and lymphocytopenia to be independent prognostic factors for PFS and OS. 14
In the present study, we determined whether specific cells in the complete blood count (CBC) and CTCs are correlated and associated with clinical outcome in MBC. We evaluated the correlation between a baseline measurement of CTCs and neutrophils, lymphocytes, monocytes, eosinophil and platelet absolute counts from peripheral blood along with the NLR, PLR, MLR and SII, as general measures of immune-inflammation status in patients with MBC.
Patients and methods
Patient population
This is a retrospective analysis of a large cohort of consecutive MBC patients prospectively evaluated in an institutional review board (IRB) approved protocol at the MD Anderson Cancer Center (MDACC) who had a measurement of CTCs prior to starting a new systemic therapy between September 2004 and November 2009. The clinical information was collected from the institutional database, which included the CBCs, leukocyte subsets (differentials), and clinical characteristics: estrogen receptor (ER), progesterone receptor (PR), HER2/neu, disease stage grade, histological type, date of blood drawn for CTC assay, the number of CTCs, treatment administered, radiological assessment, metastatic sites, and clinical outcome. Blood samples for CTC and CBC were obtained on the same day prior to starting a new systemic therapy for MBC, which was started at least 4 weeks after prior therapy and after full recovery of prior toxicities. According to the CTC protocol, the blood samples were collected before the start of any premedication of the systemic treatment, and no steroids or hematopoietic growth factors were administered in the days before the blood draws. Each patient provided a 10 ml sample of peripheral blood for CTC evaluation, which was performed at the routine clinical laboratory at MDACC using the CellSearch™ System (Veridex LLC, Raritan, NJ, USA). In brief, CTCs were enriched from 7.5 ml of blood using ferrofluid particles coated with antibodies targeting the epithelial cell adhesion molecule (EpCAM) expressed on CTCs. Isolated cells were fluorescently labeled with the nucleic acid dye DAPI and monoclonal antibodies specific for leukocytes (CD45 – allophycocyan) and epithelial cells (cytokeratin 8,18,19 – phycoerythrin), and analyzed by the CellSpotter™ Analyzer (Veridex LLC). CBC and leukocyte subsets were analyzed by the CLIA-certified Pathology Laboratory at MDACC and the data posted to Clinic Station. We collected the CBC and leukocyte differential data from patient charts in Clinic Station, the electronic medical record.
SII, the systemic immune-inflammation index based on platelet (P), neutrophil (N), and lymphocyte (L) counts, was calculated using the formula P × N/L; NLR was defined as N/L; MLR as monocytes (M)/L; and PLR as P/L at the baseline data. All patient records were de-identified prior to study cohort selection in accordance with the Health Insurance Portability and Accountability Act (HIPAA) of 1996. A central IRB at the MDACC, Houston, TX approved the current study protocol and deemed the study exempt from full review. The IRB granted a waiver of informed consent for the study. The study was also conducted in accordance with the Declaration of Helsinki.
Analysis
Descriptive statistics were used to summarize data (frequency for categorical variables, median and range for continuous variables). The Chi-square test or the Fisher’s exact test was used to assess the association between categorical variables and the median test was used to investigate the correlation between continuous variables.
The cutoff of 5 CTCs was used to distinguish patients with favorable (0 to 4 CTCs) or unfavorable prognosis (>5 CTCs), as described previously. 5 Counts of blood leukocytes were log-transformed and effects on these by tumor features and epidemiologic variables assessed by generalized linear models. Time-dependent receiver operating characteristic (ROC) curves were produced in order to establish the cutoff between low and high expression of baseline NLR, PLR, MLR, and SII that yielded the most accurate prediction of OS at 24 months. In our analysis, we considered as an optimal cutoff the value resulting in the maximum product of sensitivity and specificity on the ROC curve, so sensitivity and specificity were optimized simultaneously. Sensitivity, specificity, positive predictive value (PPV), negative predictive value (NPV) and area under the curve (AUC) at specific cutoff points for each of the inflammatory indices were calculated using time-dependent ROC curves. OS was calculated from the date of baseline CTC assessment to the date of death from any cause or date of last follow up. OS was estimated by the Kaplan–Meier product limit method and compared between groups with the log rank test. In order to investigate prognostic indicators of OS and to estimate hazard ratio (HR) and their 95% confidence intervals (95% CI), the univariate Cox regression model was used.
Furthermore, a multivariable Cox regression model was used to determine the association between CTCs and OS after adjustment for other variables (baseline variables). Logistic regression was used to estimate odds ratio (OR) and 95% CI in order to evaluate the association between a single biological variable and CTCs (<5, ⩾5). Statistical differences were noted if p < 0.05. The effect of the interaction between CTC levels and inflammatory indices on OS was evaluated using Cox regression models that included CTC levels, inflammatory indices and inflammatory indices-by-CTC levels. Statistical analyses were performed using SAS statistical software (version 9.4, SAS Institute, Cary, NC, USA). R package survivalROC was used to run survival ROC analysis for the time-dependent ROC curve (http://cran.r-project.org/web/packages/survivalROC).
Results
Baseline patient characteristics
Between September 1, 2004 and November 30, 2009, 516 patients with MBC were considered for this study, who had CTC measurements and CBC performed at baseline before starting a new therapy. In this cohort of patients, 310 (60%) had <5 CTCs and 206 (40%) had ⩾5 CTCs. Of the 211 patients with 3 or more metastatic sites, 113 (53.6%) had <5 CTCs and 98 (46.4%) patients had ⩾5 CTCs (p = 0.005). The optimal cutoff point of inflammatory indices was calculated using the time-dependent ROC curves and for the SII was 836 × 109, for NLR was 3, for MLR was 0.34 and for PLR was 210. Then, SII ⩾ 836, NLR ⩾ 3, MLR ⩾ 0.34 and PLR ⩾ 210 were considered as elevated levels. ROC curves for cutoff calculation are shown in the Supplementary Figure 1. Sensitivity, specificity, predictive value and accuracy of OS at 24 months are described in Supplementary Table 1. The clinical characteristics of the 516 patients evaluated are detailed in Table 1.
Association of CTC (<5 versus ⩾5) with clinical pathological variables.

Chi-square test.
Median test.
ER, estrogen receptor; MLR, monocyte–lymphocyte ratio; NLR, neutrophil–lymphocyte ratio; PLR, platelet–lymphocyte ratio; SII, systemic immune-inflammation index.
Relationship between CTCs and blood leukocytes
In the overall population (n = 516), CTCs correlated with the percentages of monocytes (p = 0.008) and neutrophils (p = 0.038), but not with the percentages of lymphocytes (p = 0.752) and eosinophils (p = 0.558). Then, exploratory subgroup analyses were performed. In triple-negative tumors (n = 124), CTCs correlated with monocyte count only (p = 0.009). In HER2+ tumors (n = 100), CTCs correlated with neutrophil count (p = 0.009), whereas no correlation was found in HER2– estrogen receptor-positive (ER+) tumors (n = 280).
In the overall population, univariate logistic regression analyses of WBC, differential counts, NLR, PLR, MLR and SII as a function of CTCs (<5, ⩾5) correlated with WBC (OR = 1.11, 95% CI 1.03–1.19, p = 0.006), neutrophils (OR = 1.09, 95% CI 1.00–1.19, p = 0.045) and monocytes (OR = 3.75, 95% CI 1.66–8.48, p = 0.001). In multivariate analysis only monocyte counts remained associated with ⩾5 CTCs (OR = 2.72, 95% CI 1.09–6.80, p = 0.033) (Table 2).
Univariate logistic regression analyses of WBC, differential counts, NLR, PLR, MLR and SII as a function of CTC (<5, ⩾5) for all evaluable 516 patients.
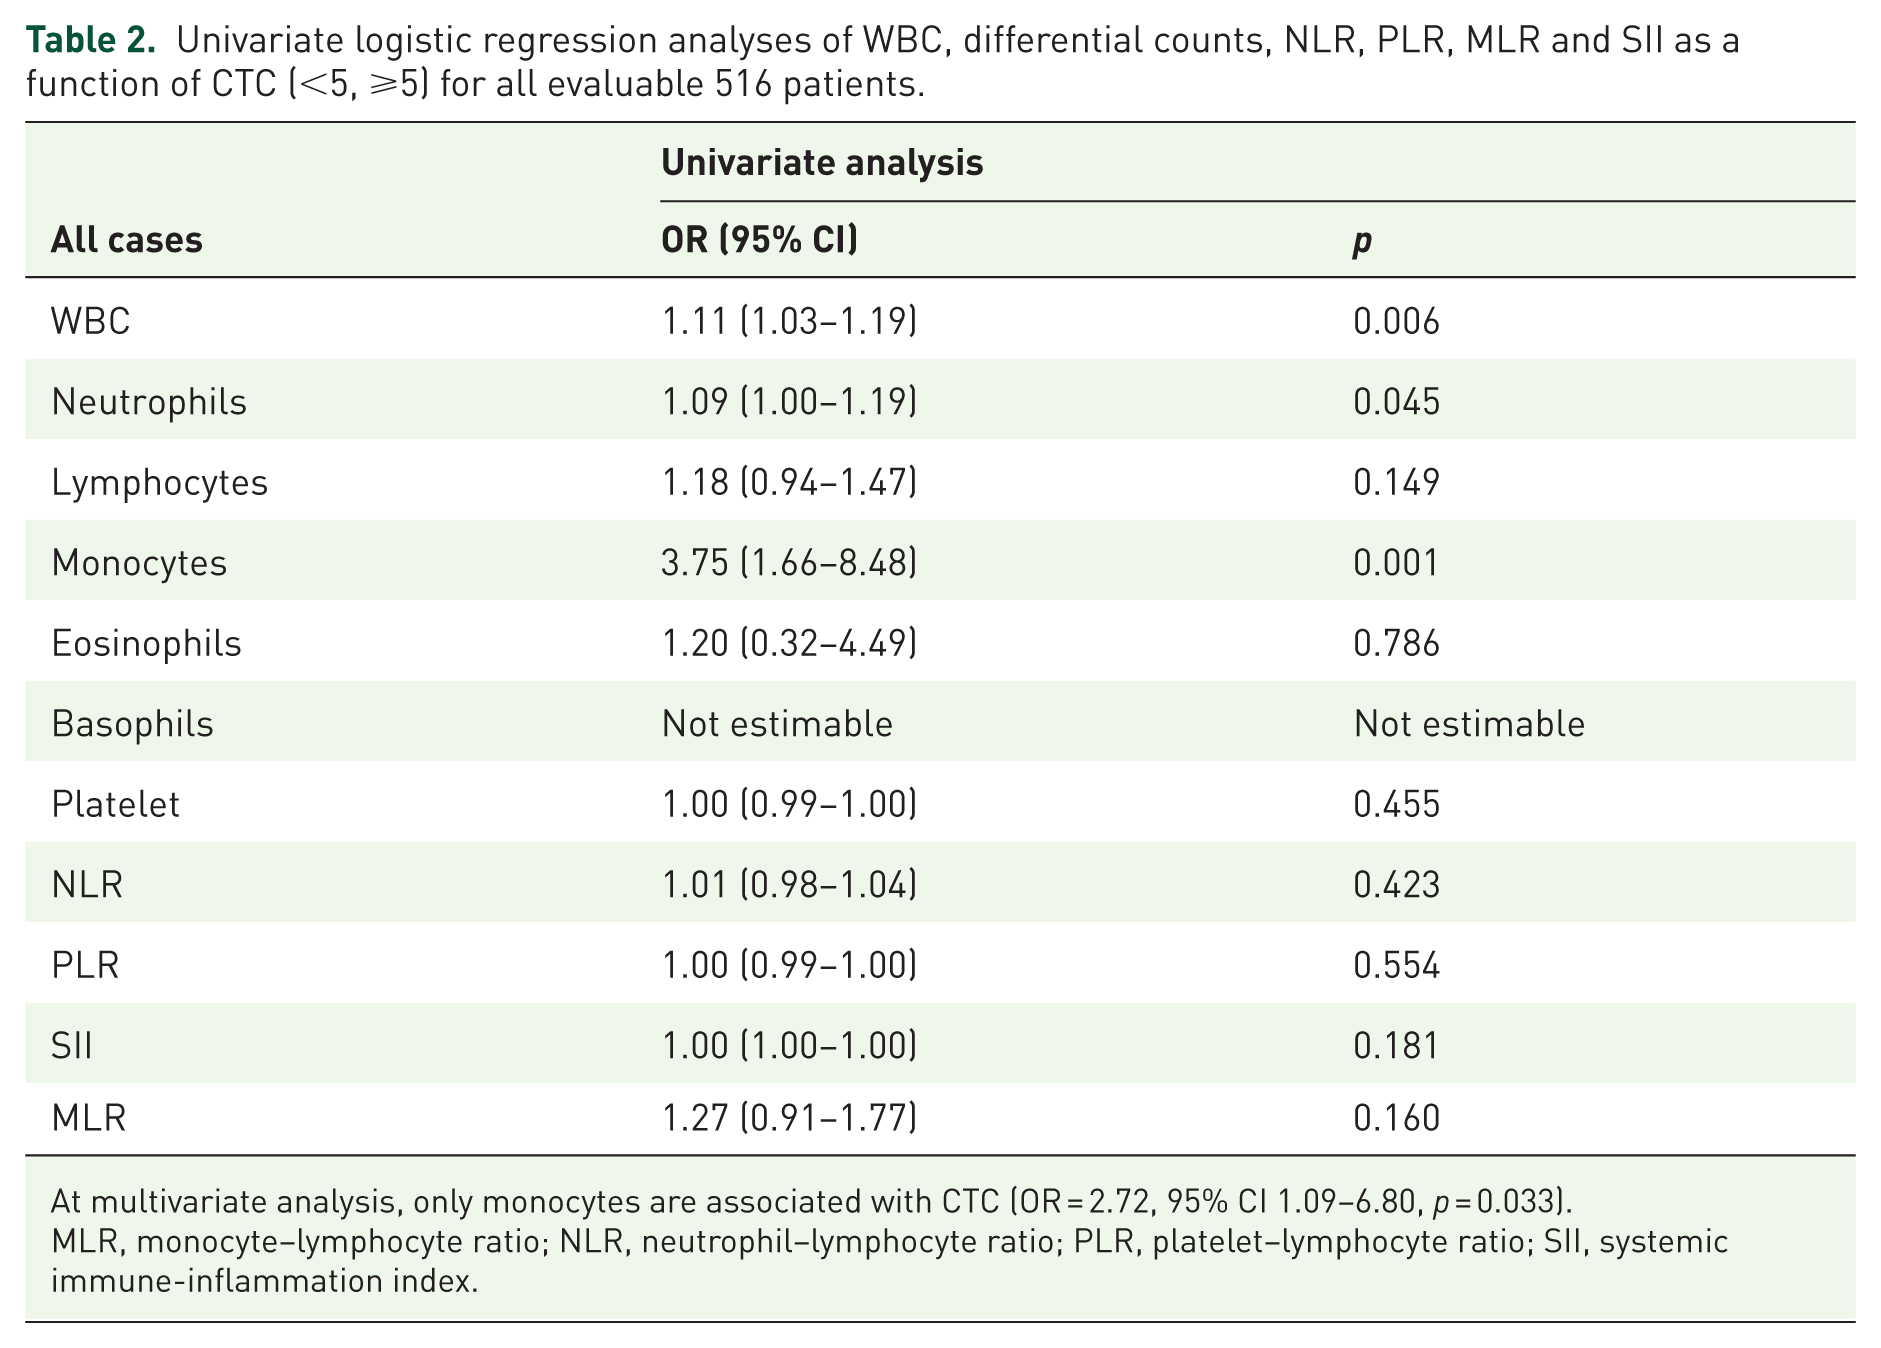
At multivariate analysis, only monocytes are associated with CTC (OR = 2.72, 95% CI 1.09–6.80, p = 0.033).
MLR, monocyte–lymphocyte ratio; NLR, neutrophil–lymphocyte ratio; PLR, platelet–lymphocyte ratio; SII, systemic immune-inflammation index.
Univariate and multivariate analyses of predictors of survival
The median OS was 24.1 months (95% CI 21.6–29.7). In relation to CTC counts, the median OS was 30.4 months (95% CI 24.1–40.1) and 18.7 months (95% CI 15.0–23.1) in patients with baseline CTCs <5 or ⩾5, respectively (HR = 1.82, 95% CI 1.36–2.42, p < 0.0001) (Figure 1a). In relation to NLR value, the median OS was 27.4 months (95% CI 23.5–40.1) and 20.1 months (95% CI 17.3–28.6) in patients with baseline NLR <3 or ⩾3, respectively (HR = 1.47, 95% CI 1.10–1.96, p = 0.009) (Figure 1b). In relation to PLR value, the median OS was 30.4 months (95% CI 23.5–40.6) and 20.1 months (95% CI 16.9–24.4) in patients with baseline PLR <210 or ⩾210, respectively (HR = 1.46, 95% CI 1.10–1.95, p = 0.010) (Figure 1c). In relation to SII value, the median OS was 29.0 months (95% CI 23.5–40.1) and 20.8 months (95% CI 18.3–27.2) in patients with baseline SII <836 or ⩾836, respectively (HR = 1.34, 95% CI 1.00–1.78, p = 0.047) (Figure 1d). In relation to MLR value, the median OS was 30.4 months (95% CI 23.8–40.6) and 19.8 months (95% CI 15.9–24.4) in patients with baseline MLR <0.34 or ⩾0.34, respectively (HR = 1.72, 95% CI 1.28–2.30, p = 0.0003) (Figure 1e).

Overall survival according to baseline circulating tumor cells (CTCs), systemic immune-inflammation index (SII), neutrophil–lymphocyte ratio (NLR), monocyte–lymphocyte ratio (MLR) and platelets–lymphocyte ratio (PLR) indices. Kaplan–Meier plots illustrating overall survival according to baseline CTC ⩾5 versus <5 (p < 0.0001) (a), NLR ⩾3 versus <3 (p = 0.008) (b), PLR ⩾210 versus <210 (p = 0.009) (c), SII ⩾836 versus <836 (p = 0.046) (d) and MLR ⩾0.34 versus <0.34 (p = 0.0003) (e).
In triple-negative tumors, CTC (HR = 1.96, 95% CI 1.16–3.33, p = 0.012) and MLR (HR = 1.99, 95% CI 1.16–3.41, p = 0.013) were able to predict survival; in HER2+ tumors, PLR (HR = 2.36, 95% CI 1.21–4.62, p = 0.012) and MLR (HR = 2.16, 95% CI 1.08–4.33, p = 0.029); in HER2– ER+ tumors CTC only were significant (HR = 2.44, 95% CI 1.56–3.81, p < 0.0001). Table 3 summarizes the results of univariate analysis of OS according to tumor subtype and as a function of best cutoff value. In multivariate analysis, among clinical variables in the overall population, CTC (⩾5 versus <5), number of metastatic sites (>1 versus 1), and tumor subtypes (triple-negative versus HER2– ER+ tumors) remained significant predictors of OS (HR = 1.86, 95% CI 1.38–2.51, p < 0.0001; HR = 2.59, 95% CI 1.73–3.89, p < 0.0001, and HR = 2.00, 95% CI 1.43–2.81, p < 0.0001, respectively); whereas, among inflammatory indices, only MLR remained as a predictor of OS (HR = 1.70, 95% CI 1.25–2.29, p = 0.0006). The interaction of CTC levels and NLR, PLR, SII and MLR was investigated using a Cox proportional hazard model for OS and showed significant CTC levels interaction only with MLR (p = 0.074), whereas CTC with NLR (p = 0.929), PLR (p = 0.616), SII (p = 0.836) were not significant. A univariate analysis including CTC and inflammatory indices focusing on first-line chemotherapy only versus first-line any therapy versus all-comers of therapy has also been calculated and reported in Supplementary Table 2a–c, which reflect results in the overall population.
Univariate analysis of OS according to tumor subtype and as a function of best cutoff value.

CTC, circulating tumor cell; ER, estrogen receptor; MLR, monocyte–lymphocyte ratio; nr, nor reached; NLR, neutrophil–lymphocyte ratio; OS, overall survival; PFS, progression-free survival; PLR, platelet–lymphocyte ratio; SII, systemic immune-inflammation index.
When the CTC groups (<5 or ⩾5) were analyzed according to the MLR (<0.34 or ⩾0.34), the four groups were as follows: (1) CTC <5 and MLR <0.34 in 158 (30.6%) cases; (2) CTC <5 and MLR ⩾0.34 in 152 (29.5%) cases; (3) CTC ⩾5 and MLR <0.34 in 95 (18.4%) cases; and (4) CTC ⩾5 and MLR ⩾0.34 in 111 (21.5%) cases. Figure 2 shows the OS according to these four groups.

Kaplan–Meier plots illustrating according to baseline circulating tumor cells (CTCs) and monocyte–lymphocyte ratio (MLR).
Discussion
Inflammation induces changes systemically and within the cancer microenvironment that favor cancer progression. CTCs may be directly involved in inflammation and coagulation processes through the expression of tissue factors and several studies have focused on this topic, including some on patients with inflammatory breast cancer taking statins who had significantly lower baseline CTC counts than those not on statins.15–17
We observed that CTCs are directly associated with monocytes, especially in triple-negative breast cancer. CTC and inflammatory indices such as NLR, PLR, MLR and SII were predictive of OS in MBC, but only CTCs and MLR remained independent prognostic factors in multivariate analysis. CTCs and MLR combined create a prognostic score (Figure 2).
The cellular mechanisms by which CTC undergoes metastasis to a determined site are poorly understood. 18 The immune system has the capacity to either block tumor development and progression, or to promote carcinogenesis, growth and dissemination. 19 Monocyte/macrophages comprise a heterogeneous population and, depending on their phenotype, contribute to tumor cell killing or facilitate tumor proliferation and dissemination.20,21 Disseminated tumor-associated macrophages could be useful biomarkers of MBC and they may play a role in CTC migration.22–24 There is an inverse correlation between CTCs and adaptive immune cells in the peripheral blood microenvironment which may influence tumor cell dissemination and promote the initiation of the metastatic cascade. 25 In inflammatory breast cancer, an increased CTC count has been correlated with low percentages and impaired function in circulating dendritic cells.25,26 Up to now research into how immune responses dictate metastatic success has mainly focused on recruited myeloid populations, with few studies defining a role for resident immune cells. 27 Neutrophils induce adhesion and seeding of distant organ sites via the secretion of circulating growth factors such as VEGF and proteases. 28 Lymphocytes play a key role in tumor defense by promoting cytotoxic cell death and inhibiting tumor cell proliferation and migration, thereby orienting the immune response of the host to the malignancy. 29 Other studies have demonstrated that platelets induce CTC epithelial–mesenchymal transition, promoting extravasation to metastatic sites.30–32
Our results support the hypothesis that monocytes could be coupled with CTCs as a candidate biomarker in MBC, as recently seen for colorectal cancer.33,34 Interest has also been aroused in the monocyte/macrophage system as a possible therapeutic target in cancer. Trabectedin, a chemotherapeutic drug, induced rapid apoptosis in mononuclear phagocytes and its cytotoxicity in mononuclear phagocytes was key to its antitumor activity. 35 A deeper understanding of the interaction between anticancer treatments and innate immunity, especially the monocyte/macrophage system, could lead to more innovative immunotherapy approaches. 36 These data support the hypothesis that circulating monocytes and MLR can be used as biomarkers of MBC and suggest that they have a role in association with CTC phenomenon. Larger prospective studies are needed to validate these data, to correlate them with current prognostic markers, and to test their ultimate usefulness in clinical practice.
The key limitations of the present study concern its single-center nature, the retrospective design used in a prospective case series, the various treatment regimens of MBC during follow-up assessments and recent changes in the armamentarium for MBC so that these results may not exactly apply to overall current patient populations. However, we highlighted a previously unknown relationship between CTC and monocyte counts and the prognostic impact of these indices. These data need to be verified in an independent cohort to be further convinced of the prognostic value. There are multiple strategies to isolate and characterize CTCs with several technical limitations in their ability to detect these cells.37,38 Multicenter trial data with a standard protocol and specific platforms would be beneficial to evaluate the prognostic impact of CTC and monocytes in relation to different treatments and lines of therapy.
In conclusion, CTCs and MLR can be used as a prognostic biomarker in MBC. CTCs correlate directly with monocytes, especially in triple-negative tumors. The low cost, simple collection method and reproducibility of a full blood count make MLR a promising prognostic factor in MBC. Links between CTC and monocytes need to be investigated in the pathogenesis and progression of MBC, and can contribute to development of new prognostic models in MBC.
Supplemental Material
Supplementary_Figure_1_1 – Supplemental material for Association between circulating tumor cells and peripheral blood monocytes in metastatic breast cancer
Supplemental material, Supplementary_Figure_1_1 for Association between circulating tumor cells and peripheral blood monocytes in metastatic breast cancer by Ugo De Giorgi, Michal Mego, Emanuela Scarpi, Antonio Giordano, Mario Giuliano, Vicente Valero, Ricardo H. Alvarez, Naoto T. Ueno, Massimo Cristofanilli and James M. Reuben in Therapeutic Advances in Medical Oncology
Supplemental Material
Supplementary_Table_1 – Supplemental material for Association between circulating tumor cells and peripheral blood monocytes in metastatic breast cancer
Supplemental material, Supplementary_Table_1 for Association between circulating tumor cells and peripheral blood monocytes in metastatic breast cancer by Ugo De Giorgi, Michal Mego, Emanuela Scarpi, Antonio Giordano, Mario Giuliano, Vicente Valero, Ricardo H. Alvarez, Naoto T. Ueno, Massimo Cristofanilli and James M. Reuben in Therapeutic Advances in Medical Oncology
Supplemental Material
Supplementary_Table_2A_1 – Supplemental material for Association between circulating tumor cells and peripheral blood monocytes in metastatic breast cancer
Supplemental material, Supplementary_Table_2A_1 for Association between circulating tumor cells and peripheral blood monocytes in metastatic breast cancer by Ugo De Giorgi, Michal Mego, Emanuela Scarpi, Antonio Giordano, Mario Giuliano, Vicente Valero, Ricardo H. Alvarez, Naoto T. Ueno, Massimo Cristofanilli and James M. Reuben in Therapeutic Advances in Medical Oncology
Supplemental Material
Supplementary_Table_2B_1 – Supplemental material for Association between circulating tumor cells and peripheral blood monocytes in metastatic breast cancer
Supplemental material, Supplementary_Table_2B_1 for Association between circulating tumor cells and peripheral blood monocytes in metastatic breast cancer by Ugo De Giorgi, Michal Mego, Emanuela Scarpi, Antonio Giordano, Mario Giuliano, Vicente Valero, Ricardo H. Alvarez, Naoto T. Ueno, Massimo Cristofanilli and James M. Reuben in Therapeutic Advances in Medical Oncology
Supplemental Material
Supplementary_Table_2C_1 – Supplemental material for Association between circulating tumor cells and peripheral blood monocytes in metastatic breast cancer
Supplemental material, Supplementary_Table_2C_1 for Association between circulating tumor cells and peripheral blood monocytes in metastatic breast cancer by Ugo De Giorgi, Michal Mego, Emanuela Scarpi, Antonio Giordano, Mario Giuliano, Vicente Valero, Ricardo H. Alvarez, Naoto T. Ueno, Massimo Cristofanilli and James M. Reuben in Therapeutic Advances in Medical Oncology
Footnotes
Acknowledgements
The authors thank Gráinne Tierney and Cristiano Verna for editorial assistance.
Abbreviations
AUC, area under the curve; CBC, complete blood count; CTCs, circulating tumor cells; ER, estrogen receptor; MBC, metastatic breast cancer; MLR, monocyte–lymphocyte ratio; NLR, neutrophil–lymphocyte ratio; NPV, negative predictive value; OR, odds ratio; OS, overall survival; PFS, progression-free survival; PLR, platelet–lymphocyte ratio; PPV, positive predictive value; SII, systemic immune-inflammation index.
Author contributions
Conceptualization, formal analysis, investigation, methodology, writing, original draft preparation and reviewing and editing: UDG; conceptualization, supervision, methodology, writing, reviewing and editing: MM; formal analysis, data validation, reviewing and editing: ES; reviewing and editing: AG, MG, RHA; methodology, reviewing and editing: VV; writing, reviewing and editing: NTU; data curation, supervision, reviewing and editing: MC; conceptualization, data curation, supervision, reviewing and editing: JMR; All authors read and approved the final manuscript.
Funding
The authors received no financial support for the research, authorship, and/or publication of this article.
Conflict of interest statement
The authors declare that there is no conflict of interest.
Availability of data and materials
The datasets used and analyzed during the study are available from the corresponding authors upon reasonable request. Portions of the results in this article were presented at the San Antonio Breast Cancer Symposium, December 6–10, 2016, San Antonio, TX, USA.
Supplemental material
Supplemental material for this article is available online.
References
Supplementary Material
Please find the following supplemental material available below.
For Open Access articles published under a Creative Commons License, all supplemental material carries the same license as the article it is associated with.
For non-Open Access articles published, all supplemental material carries a non-exclusive license, and permission requests for re-use of supplemental material or any part of supplemental material shall be sent directly to the copyright owner as specified in the copyright notice associated with the article.