
Abstract
Aims:
We created a new index (Multi Inflammatory Index, MII) composed of an inflammatory index [neutrophil-to lymphocyte-ratio (NLR): MII-1; platelet-to-lymphocyte ratio (PLR): MII-2; or systemic immune-inflammation index (SII): MII-3] and C-reactive protein (CRP). Our aim was to evaluate the prognostic and/or predictive capacity of the MII in the randomized ITACa (Italian Trial in Advanced Colorectal Cancer) study on patients with metastatic colorectal cancer undergoing first-line chemotherapy.
Methods:
Between November 2007 and March 2012, baseline NLR, PLR; SII and CRP were available for 131 patients, 66 receiving chemotherapy plus bevacizumab and 65 receiving chemotherapy alone.
Results:
Patients with low (<25) MII-1 levels had a better outcome than those with high (⩾25) levels: median progression-free survival (PFS) was 12.4 versus 8.9 months [hazard ratio (HR) = 1.74, 95% confidence interval (CI) 1.21–2.51, p = 0.003] and median overall survival (OS) was 30.9 months versus 15.0 months (HR = 2.05, 95% CI 1.40–3.02, p = 0.0002), respectively. Similar results were obtained for patients with low (<1424) MII-2 levels compared with those with high (⩾1424) levels: median PFS was 12.6 versus 8.9 months (HR = 1.95, 95% CI 1.35–2.82, p = 0.0004) and median OS was 32.4 versus 14.6 months, respectively (HR = 2.42, 95% CI 1.64–3.57, p < 0.0001). Patients with low (<6068) MII-3 levels had a longer median PFS and OS than those with high (⩾6068) levels: 12.6 versus 8.9 months (HR = 1.91, 95% CI 1.33–2.76, p = 0.005) and 30.9 versus15.0 months (HR = 2.10, 95% CI 1.43–3.09, p = 0.0002), respectively. Following adjustment for clinical covariates, multivariate analysis confirmed all MII indexes as independent prognostic factors for predicting PFS and OS.
Conclusion:
All MII indexes appear to be useful as prognostic markers.
Trial registration
ClinicalTrials.gov identifier: NCT01878422 (registration date: 07/06/2013) https://clinicaltrials.gov/ct2/show/NCT01878422
Keywords
Introduction
Colorectal cancer (CC) is the third most common cause of death from cancer in Western Europe and North America. 1 In recent years, the fundamental role played by the interaction between tumor and tumor environment in the clinical course of the disease, especially in relation to immune status, has emerged. C-reactive protein (CRP) is a marker of systemic inflammation produced almost exclusively in hepatocytes in response to inflammatory cytokines, for example, interleukin (IL)-1, tumor necrosis factor (TNF)-α and IL-6.2,3 Elevated CRP has been described as a prognostic factor in various cancers, including ovarian and gastroesophageal carcinoma.4–7
Several papers in the literature have reported that inflammatory indexes such as neutrophil-to-lymphocyte ratio (NLR), platelet-to-lymphocyte ratio (PLR) and systemic inflammatory index (SII) may have a predictive and prognostic role in various diseases.8–15 We previously demonstrated in two different papers a correlation between CRP 16 and inflammation index 17 and clinical outcome in patients with metastatic CC undergoing first-line chemotherapy.
Starting from this assumption, we created a new index [Multi Inflammatory Index (MII)], composed of an inflammatory index (NLR, PLR or SII) and CRP, and evaluated its prognostic and/or predictive potential in the randomized ITACa study (Italian Trial in Advanced Colorectal Cancer; EudraCT no. 2007-004539-44 and on ClinicalTrials.gov NCT01878422). 18
Patients and methods
The ITACa trial
In this study we evaluated patients with metastatic CC enrolled in the ITACa trial. 18 Patients were randomized to receive chemotherapy (CT) plus bevacizumab (B) or CT alone as first-line therapy.
The ITACa trial was approved by the local ethics committee (NCT01878422). All patients provided written informed consent. The study was carried out in accordance with the Declaration of Helsinki under good clinical practice conditions.
Statistical analysis
The objectives of this secondary analysis were to examine the association between baseline MII levels and progression-free survival (PFS) and overall survival (OS) in the ITACa population. MII-1 was calculated as the product of NLR and high-sensitivity (hs)-CRP (NLR * hs-CRP), MII-2 as PLR * hs-CRP and MII-3 as SII * hs-CRP.
PFS was defined as the time elapsed between the date of randomization and the date of first disease progression or death from any cause. Patients undergoing curative metastasectomy were censored at the time of surgery. OS was defined as the time elapsed between the date of randomization and the date of death or last follow-up. Time to event data (PFS and OS) were estimated using the Kaplan–Meier method and curves were compared by logrank test.
The best cutoff values of MII levels were determined using the receiver operating characteristic (ROC) curve analysis to predict disease progression at 9 months.
Unadjusted hazard ratios (HRs), HRs adjusted by baseline characteristics [gender, age, performance status, KRAS status, tumor localization (rectum/colon) and CT regimen (FOLFOX4/FOLFIRI)] and their 95% confidence intervals (CIs) were estimated using the Cox regression model.
The effect of the interaction between MII and treatment on PFS/OS was evaluated using Cox regression models for the overall population including MII levels, treatment (CT + B and CT only arms) and treatment by MII levels.
Patient characteristics were compared with the Chi-squared test and median values were compared using the non-parametric ranking test (median test). All p-values were based on two-sided testing. Statistical analyses were performed using SAS statistical software version 9.4 (SAS Inc., Cary, NC, USA).
Results
Patient characteristics
Between 14 November 2007 and 6 March 2012, 131 out of 370 randomized patients were available for analysis (Figure 1): 78 (59.6%) were males and 53 (40.4%) females, with a median age at diagnosis of 67 years (range 34–83). The data cut-off for analysis was 31 December 2013, when the median duration of follow-up was 36 months (range 1–65). Overall, median PFS was 9.1 (95% CI 8.4–9.8) and median OS was 21.4 months (95% CI 19.9–24.5). Table 1 shows the characteristics of the entire study population and Table 2 reports population characteristics on the basis of the MII index.
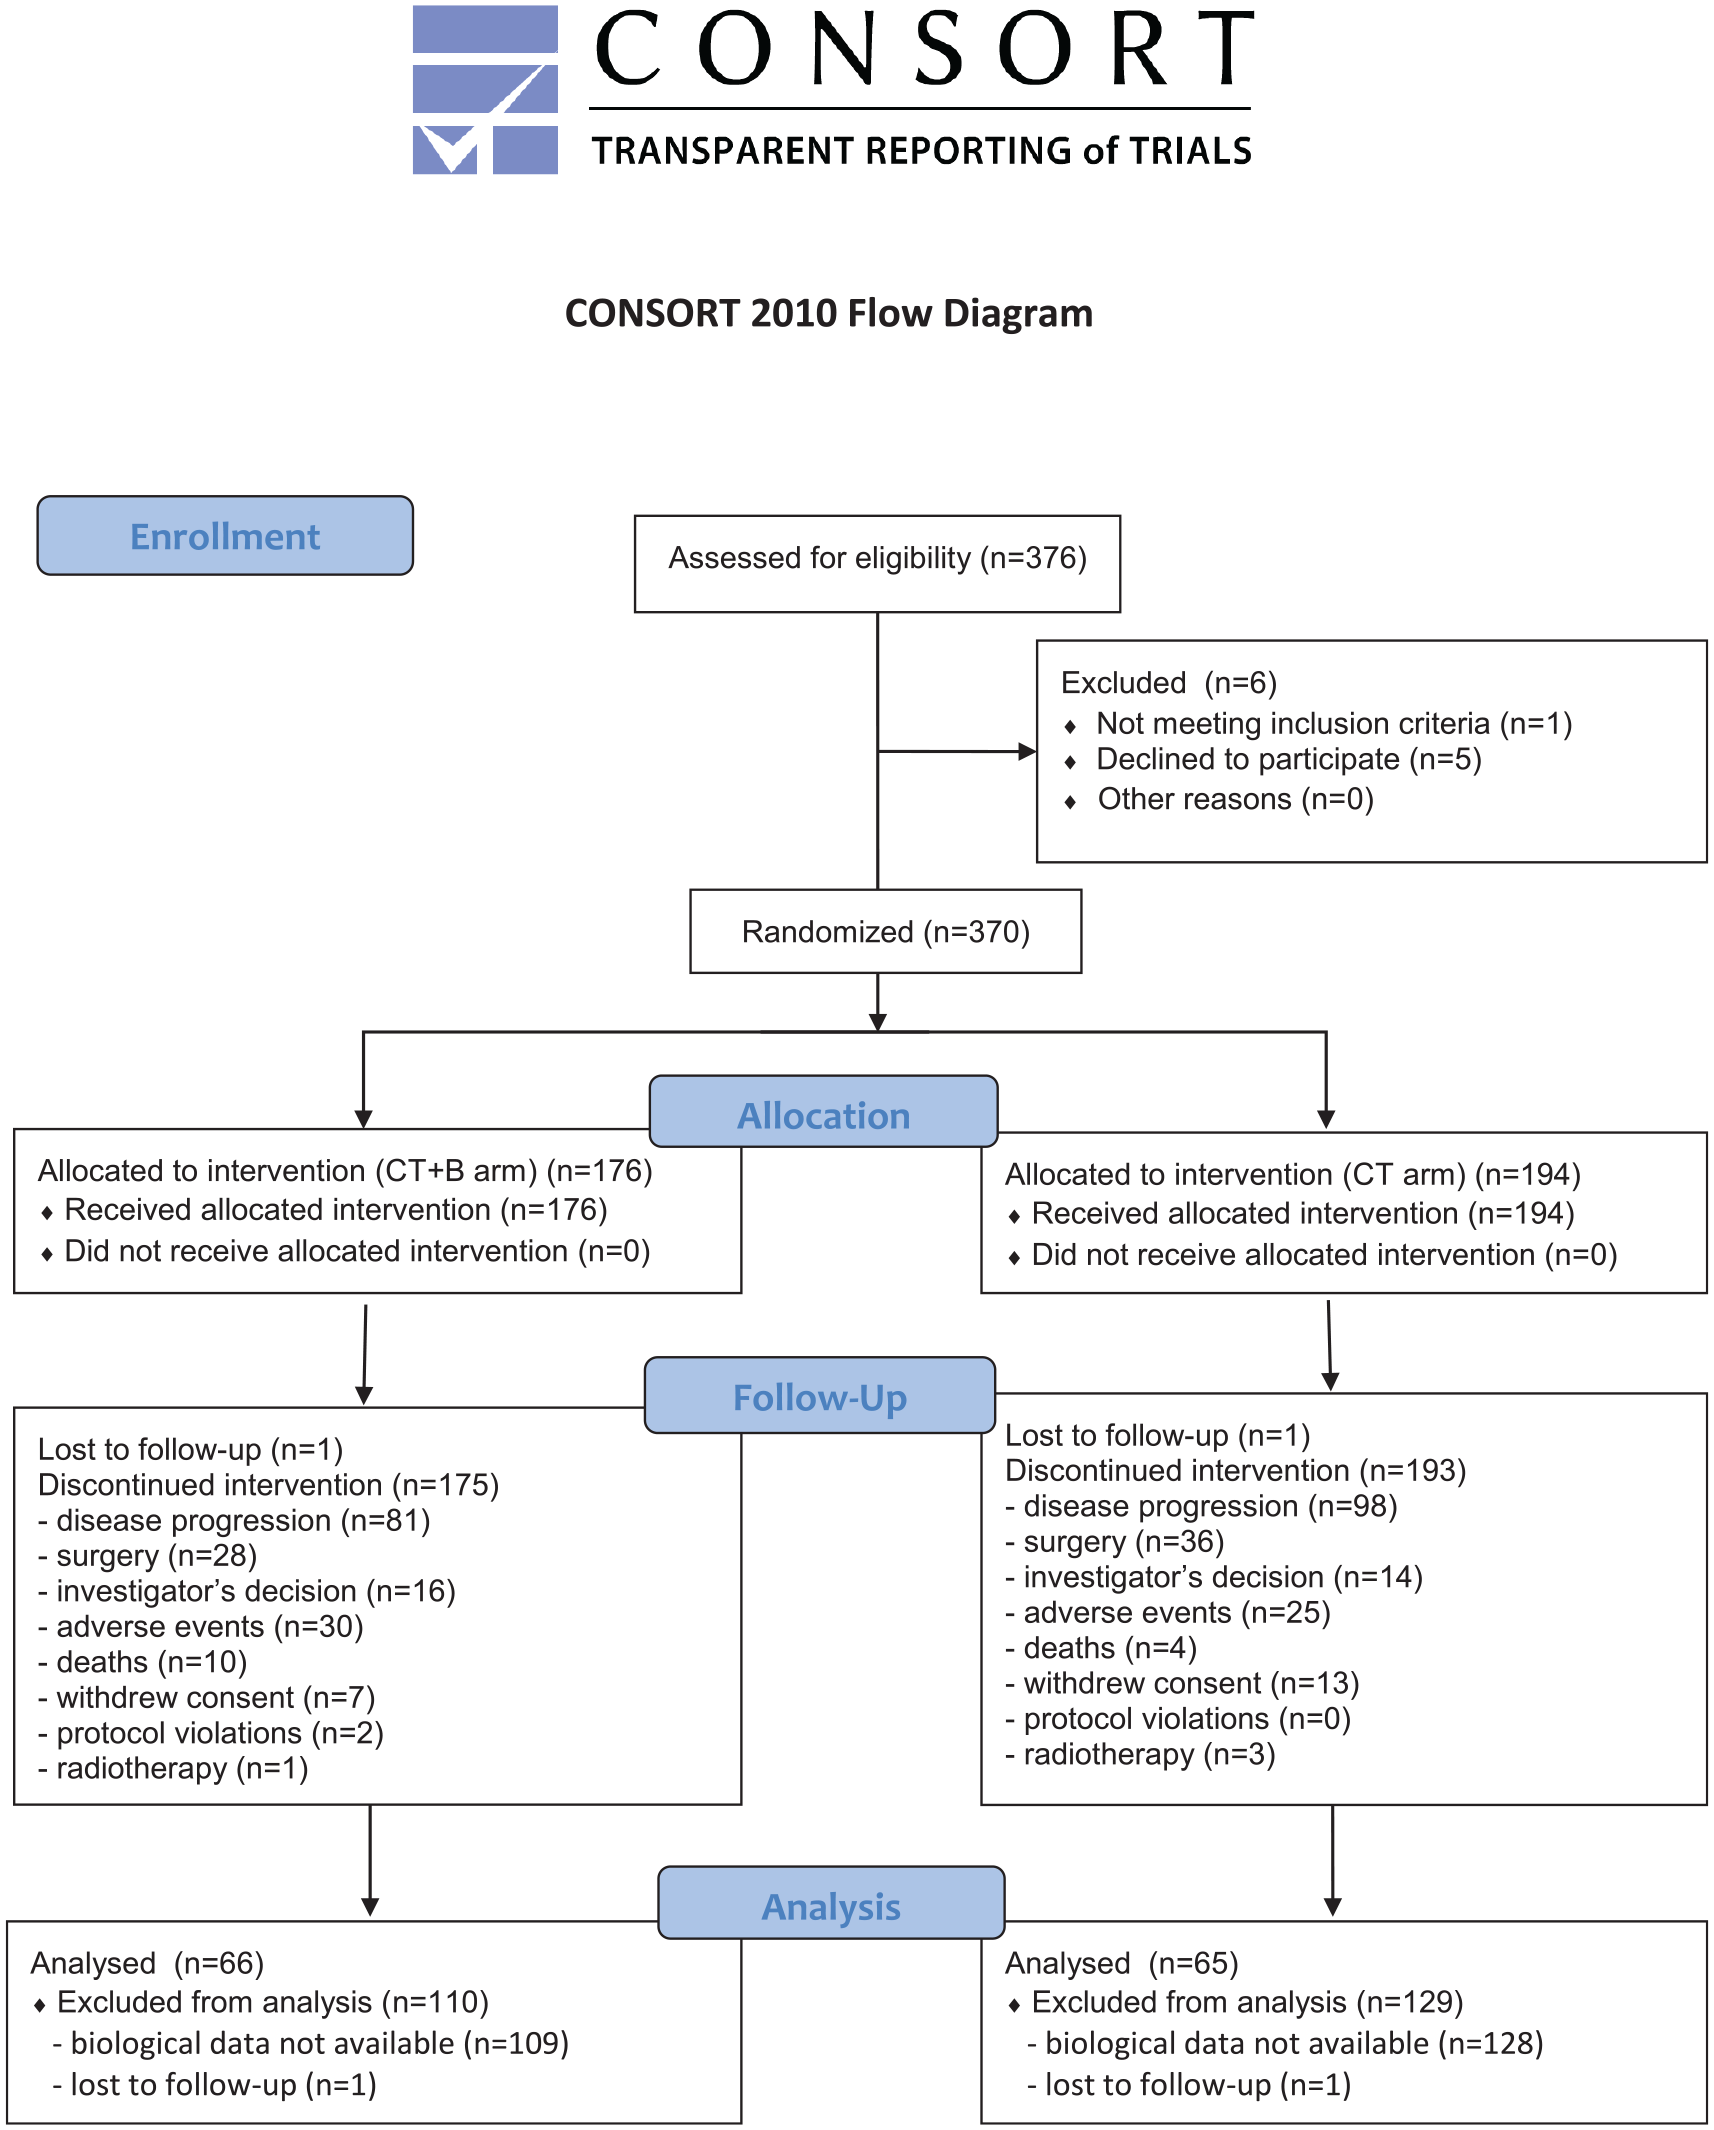
Flow chart of the study.
Patient characteristics (n = 131).

B, bevacizumab; CT, chemotherapy; ECOG PS, Eastern Cooperative Oncology Group performance status.
Baseline patient characteristics according to baseline multi-inflammatory index (MII).
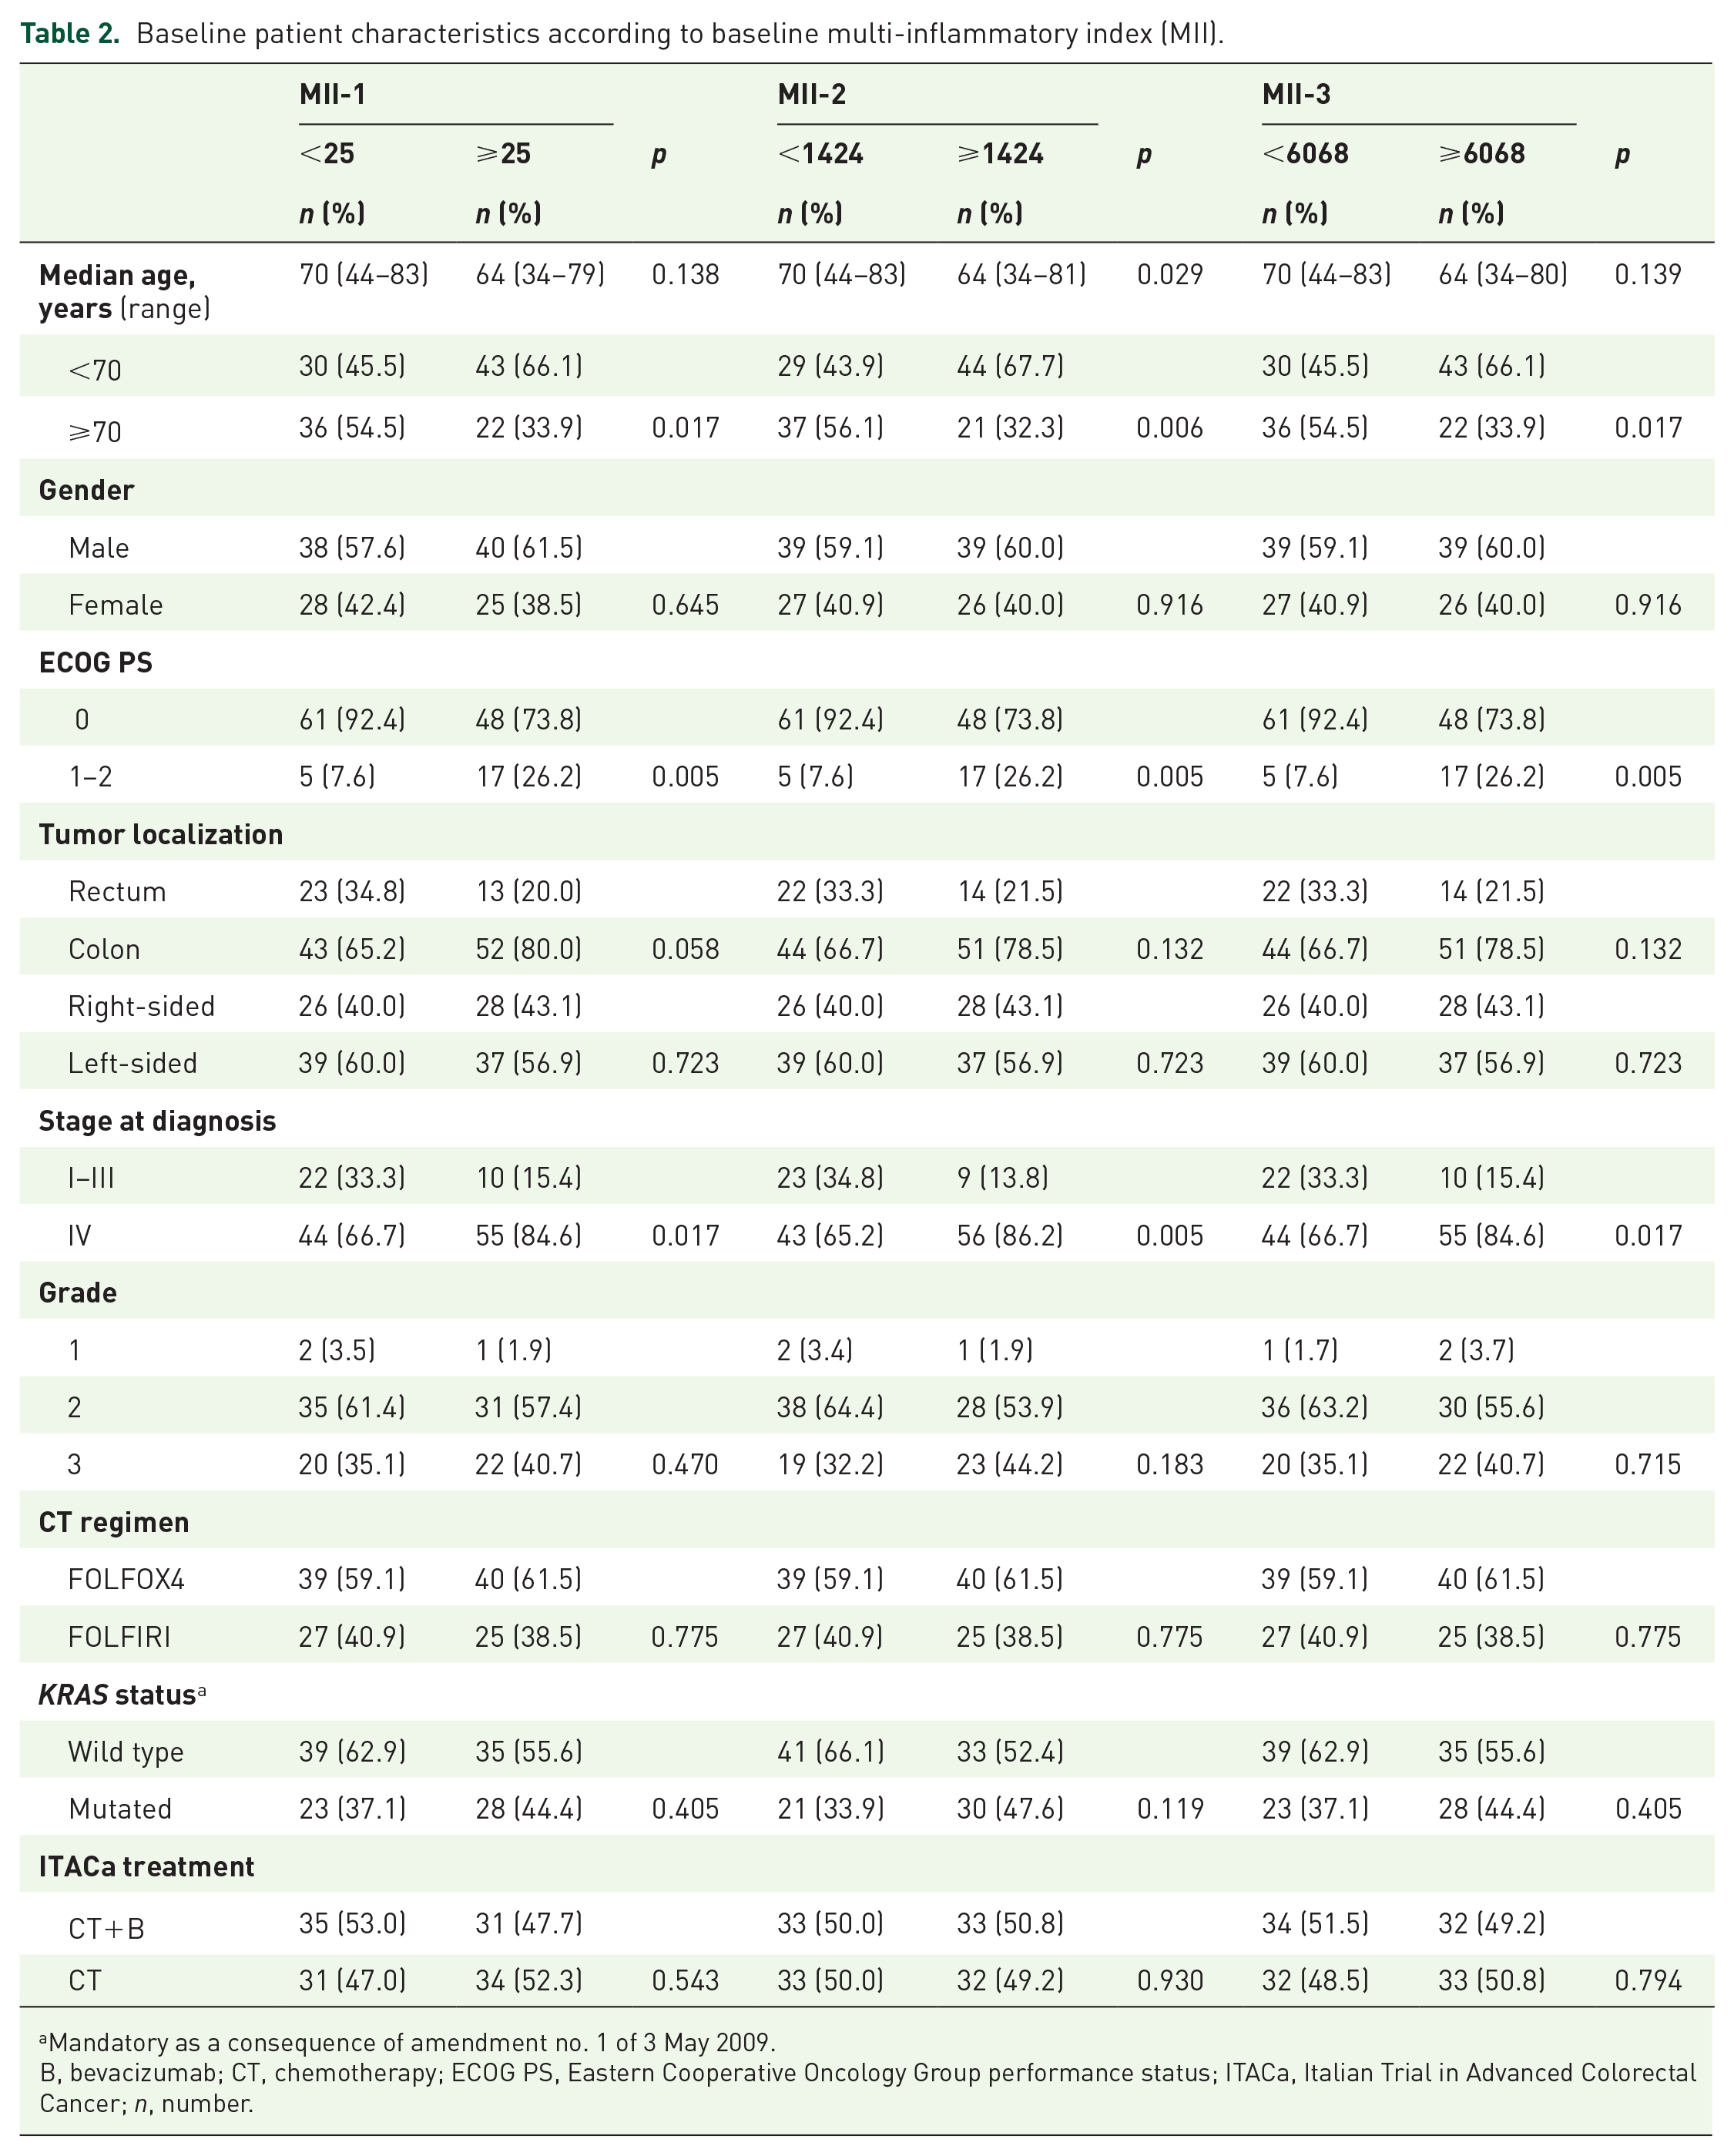
Mandatory as a consequence of amendment no. 1 of 3 May 2009.
B, bevacizumab; CT, chemotherapy; ECOG PS, Eastern Cooperative Oncology Group performance status; ITACa, Italian Trial in Advanced Colorectal Cancer; n, number.
We subdivided patients into two groups according to MII cutoff ROC analysis. There were 66 patients with low values and 65 patients with high values of each MII index.
MII-1 (NLR*hs-CRP) values and clinical outcome
Overall, considering MII-1 (NLR*hs-CRP) as a continuous variable, we observed that increased levels were associated with decreased PFS (HR = 1.001, 95% CI 1.001–1.002, p < 0.0001) and OS (HR = 1.002, 95% CI 1.001–1.002, p < 0.0001).
Median PFS was 12.4 months (95% CI 9.6–15.4) and 8.9 months (95% CI 6.9–9.7) for patients with low (<25) and high (⩾ 25) MII-1 levels, respectively (HR = 1.74, 95% CI 1.21–2.51, p = 0.003) (Figure 2A). Median OS was 30.9 months (95 % CI 25.2–39.7) and 15.0 months (95 % CI 12.7–20.2) for patients with low and high baseline MII-1, respectively (HR = 2.05, 95% CI 1.40–3.02, p = 0.0002) (Figure 2B). Following adjustment for clinical covariates (age, gender, Eastern Cooperative Oncology Group performance status (ECOG PS), tumor localization, CT regimen, KRAS status, ITACa treatment), multivariate analysis confirmed MII-1 as an independent prognostic factor for predicting PFS (HR = 1.83, 95% CI 1.24–2.70, p = 0.002) and OS (HR = 2.17, 95% CI 1.43–3.30 p = 0.0003) (Table 3).

Kaplan–Meier curves of progression-free survival
Univariate and multivariate analysis of PFS and OS according to baseline multi-inflammatory index (MII).

Adjusted by age (continuous variable), gender (male versus female), ECOG PS (1–2 versus 0), tumor localization (colon versus rectum), CT regimen (FOLFIRI versus FOLFOX4), KRAS status (mutated versus wild type), ITACa treatment (CT+B versus CT).
B, bevacizumab; CI, confidence interval; HR, hazard ratio; CT, chemotherapy; ECOG PS, Eastern Cooperative Oncology Group performance status; hs-CRP, high sensitivity C-reactive protein; ITACa, Italian Trial in Advanced Colorectal Cancer; NLR, neutrophil-to-lymphocyte ratio; OS, overall survival; PFS, progression-free survival; PLR, platelet-to-lymphocyte ratio; SII, systemic inflammatory index.
In patients treated with CT plus B, considering MII-1 as a continuous variable, we observed that increased MII-1 was associated with decreased PFS (HR = 1.001, 95% CI 1.001–1.002, p = 0.0004) and OS (HR = 1.001, 95% CI 1.001–1.002, p < 0.0001). Median PFS was 12.5 months (95% CI 9.2–16.0) and 9.0 months (95% CI 6.8–12.2) for patients with low and high MII-1, respectively (HR = 1.46, 95% CI 0.87–2.43, p = 0.148) (Supplemental Material Figure 1A online). Conversely, median OS was 31.6 months and 14.4 months for patients with low and high baseline MII-1, respectively (HR = 1.85, 95% CI 1.07–3.18, p = 0.027) (Supplemental Figure 1B). In patients treated with CT alone, considering MII-1 as a continuous variable, we observed that increased MII-1 levels were associated with decreased PFS (HR = 1.002, 95% CI 1.001–1.002, p = 0.0001) and OS (HR = 1.002, 95% CI 1.001–1.002, p = 0.0002). Median PFS was 12.2 months (95% CI 9.1–16.2) and 8.3 months (95% CI 6.0–9.6) for patients with low and high MII-1 levels, respectively (HR = 2.07, 95% CI 1.22–3.51, p = 0.007) (Supplemental Figure 1C). Median OS was 30.2 months and 16.8 months for patients with low and high baseline MII-1 levels, respectively (HR = 2.28, 95% CI 1.31–3.96, p = 0.003) (Supplemental Figure 1D). Interaction tests on MII-1 levels and treatment efficacy in the CT+B and CT only groups were not significant for PFS (p = 0.257) or OS (p = 0.648).
MII-2 (PLR*hs-CRP) values and clinical outcome
In all patients, considering MII-2 (PLR*hs-CRP) as a continuous variable, we observed that increased levels were associated with decreased PFS (HR = 1.000, 95% CI 1.000–1.000, p < 0.0001) and OS (HR = 1.000, 95% CI 1.000–1.000, p < 0.0001).
Median PFS was 12.6 months (95% CI 9.6–16.2) and 8.9 months (95% CI 6.9–9.7) for patients with low (<1424) and high (⩾1424) MII-2 levels, respectively (HR = 1.95, 95% CI 1.35–2.82, p = 0.0004) (Figure 2C). Median OS was 32.4 months (95 % CI 27.1–41.4) and 14.6 months (95 % CI 12.7–19.3) for patients with low and high baseline MII-2, respectively (HR = 2.42, 95% CI 1.64–3.57, p < 0.0001) (Figure 2D). MII-2 (PLR*hs-CRP) was associated with different toxicities (Table 2). Following adjustment for clinical covariates (age, gender, ECOG PS, tumor localization, CT regimen, KRAS status, ITACa treatment), multivariate analysis confirmed MII-2 as an independent prognostic factor for predicting PFS (HR = 2.14, 95% CI 1.44–3.20, p = 0.0002) and OS (HR = 2.48, 95% CI 1.62–3.77, p < 0.0001) (Table 3).
In patients treated with CT+B, considering MII-2 as a continuous variable, we found that increased MII-2 was associated with decreased PFS (HR = 1.000, 95% CI 1.000–1.000, p = 0.0009) and OS (HR = 1.000, 95% CI 1.000–1.000, p = 0.0002). Median PFS was 12.5 months (95% CI 9.2–19.6) and 9.1 months (95% CI 6.9–12.2) for patients with low and high MII-2, respectively (HR = 1.49, 95% CI 0.89–2.49, p = 0.124) (Supplemental Figure 2A). Conversely, median OS was 31.6 months and 14.4 months for patients with low and high baseline MII-2, respectively (HR = 1.85, 95% CI 1.07–3.19, p = 0.027) (Supplemental Figure 2B).
In patients treated with CT alone, considering MII-2 as a continuous variable, we observed that increased MII-2 levels were associated with decreased PFS (HR = 1.000, 95% CI 1.000–1.000, p = 0.002) and OS (HR = 1.000, 95% CI 1.000–1.000, p = 0.003). Median PFS was 13.0 months (95% CI 9.1–18.2) and 8.3 months (95% CI 4.9–9.6) for patients with low and high MII-2 levels, respectively (HR = 2.55, 95% CI 1.49–4.35, p = 0.0006) (Supplemental Figure 2C). Median OS was 36.6 months and 15.3 months for patients with low and high baseline MII-2 levels, respectively (HR = 3.24, 95% CI 1.84–5.70, p < 0.0001) (Supplemental Figure 2D).
Interaction tests on MII-2 levels and treatment efficacy in the CT+B and CT only groups were significant for PFS (p = 0.086), but not for OS (p = 0.207).
MII-3 (SII*hs-CRP) values and clinical outcome
In all patients, considering MII-3 (SII*hs-CRP) as a continuous variable, we found that increased levels were associated with decreased PFS (HR = 1.000, 95% CI 1.000–1.000, p < 0.0001) and OS (HR = 1.000, 95% CI 1.000–1.000, p < 0.0001). Median PFS was 12.6 months (95% CI 9.8–16.0) and 8.9 months (95% CI 6.9–9.6) for patients with low (<6068) and high (⩾6068) MII-3 levels, respectively (HR = 1.91, 95% CI 1.33–2.76, p = 0.0005) (Figure 2E). Median OS was 30.9 months (95 % CI 25.2–39.7) and 15.0 months (95 % CI 12.7–20.2) for patients with low and high baseline MII-3, respectively (HR = 2.10, 95% CI 1.43–3.09, p = 0.0002) (Figure 2F). MII-3 was associated with different toxicities (Table 2). Following adjustment for clinical covariates (age, gender, ECOG PS, tumor localization, CT regimen, KRAS status, ITACa treatment), multivariate analysis confirmed MII-3 as an independent prognostic factor for predicting PFS (HR = 1.98, 95% CI 1.34–2.90, p = 0.0005) and OS (HR = 2.07, 95% CI 1.39–3.09, p = 0.0004) (Table 3).
In patients treated with CT+B, considering MII-3 as a continuous variable, we observed that increased MII-3 was associated with decreased PFS (HR = 1.000, 95% CI 1.000–1.000, p = 0.0003) and OS (HR = 1.000, 95% CI 1.000–1.000, p = 0.0001). Median PFS was 12.6 months (95% CI 9.1–19.6) and 9.2 months (95% CI 6.8–12.2) for patients with low and high MII-3, respectively (HR = 1.50, 95% CI 0.90–2.49, p = 0.122) (Supplemental Figure 3A). Median OS was 30.2 months and 14.4 months for patients with low and high baseline MII-3, respectively (HR = 1.71, 95% CI 1.00–2.94, p = 0.052) (Supplemental Figure 3B). In patients treated with CT alone, considering MII-3 as a continuous variable, we saw that increased MII-3 levels were associated with decreased PFS (HR = 1.000, 95% CI 1.000–1.000, p < 0.0001) and OS (HR = 1.000, 95% CI 1.000–1.000, p < 0.0001). Median PFS was 12.6 months (95% CI 9.1–18.2) and 8.3 months (95% CI 6.0–9.6) for patients with low and high MII-3 levels, respectively (HR = 2.43, 95% CI 1.43–4.14, p = 0.001) (Supplemental Figure 3C). Median OS was 33.4 months and 16.8 months for patients with low and high baseline MII-3 levels, respectively (HR = 2.60, 95% CI 1.49–4.54, p = 0.0007) (Supplemental Figure 3D).
Interaction tests on MII-3 levels and treatment efficacy in the CT+B and CT only groups were not significant for PFS (p = 0.125) or OS (p = 0.349).
Best index
To identify the best index we evaluated the area under the curve (AUC) of the ROC curve. MII-1 (NLR*hs-CRP) proved to be the best index, with an AUC of 0.6874 (95% CI 0.5924–0.7823) for PFS and 0.7679 (95% CI 0.6846–0.8511) for OS. The AUC for MII-2 (PLR*hs-CRP) was 0.6797 (95% CI 0.5840–0.7754) for PFS and 0.7633 (95% CI 0.6781–0.8484) for OS, whereas the AUC for MII-3 (SII*hs-CRP) was 0.6738 (95% CI 0.5776–0.7701) for PFS and 0.7591 (95% CI 0.6740–0.8442) for OS.
The prognostic value of MII indexes was also examined in comparison with establish scores, such as Glasgow prognostic score 19 and Kohne prognostic index. 20
Kohne and Glasgow scores showed a slightly worse performance with C indexes of 0.59 (95% CI 0.50–0.67) and 0.56 (95% CI 0.50–0.63), respectively.
Discussion
Our study showed that the MII-1 index composed of NLR and hs-CRP was superior to the separate indexes in predicting prognosis in patients with metastatic CC undergoing first-line CT. In respect to other indexes published in the literature, the MII-1 index reflects all inflammatory aspects of the patients with metastatic CC. The MII-1 index proved to be superior in respect to the single components. Furthermore, the low cost, easy assessment, reproducibility and good risk-stratification performance make the MII-1 index a promising tool to comprehensively assess and discriminate the prognosis of metastatic CC patients in future daily clinical practice.
We previously demonstrated that CRP 16 and inflammatory indexes 17 are prognostic factors in first-line metastatic CC. Both NLR and hs-CRP may be an indirect index of Vascular Endothelial Growth Factor (VEGF) levels and inflammatory status of patient, hence the rationale for combining them into a single index. The NLR index is composed of neutrophils and lymphocytes and several studies have shown that it is correlated with VEGF secretion. 21 Similarly, CRP is correlated with IL-6 values and it is an indirect index of level of VEGF. Several studies highlighted a correlation between CRP levels and patients’ prognoses. This correlation seems to be related to the tissue damage caused by the neoplasm and consequent release of cytokines (in particular IL-6). 22
Increased IL-6 levels (and, indirectly, hs-CRP values) are an indicator of elevated levels of VEGF. IL-6 increases the production of VEGF by fibroblasts thus inducing angiogenesis. Several studies have hypothesized that VEGF may stimulate angiogenesis in colon cancer, and this is strongly supported by results showing that B-induced VEGF inhibition leads to decreased angiogenesis and the abrogation of cancer growth.
Interestingly, our study found that all three indexes were correlated with PFS in the CT alone arm but not in the CT+B arm, suggesting that patients with a poorer prognosis (MII-1 ⩾25, MII-2 ⩾1424 and MII-3 ⩾6068) may benefit more if treated with B. The higher efficacy of B in poor-MII-1/MII-2/MII-3 patients may also be attributable to a higher efficacy of the drug in inflammatory conditions, as for high NLR and hs-CRP. These data suggest a possible predictive role of these indexes. Other biomarkers highlighted a possible predictive role in patients treated with B, but none of them have been validated.
Inflammation is an intrinsic feature of cancer. It is due to the release of several proinflammatory cytokines (such as TNF-alpha, IL-1, IL-6, reactive oxygen and nitrogen species, prostaglandins and microRNAs) resulting in a protumorigenic microenvironment.
Several limitations should be acknowledged. First, this secondary analysis was not preplanned in the ITACa trial and only a subset of the enrolled patients were included in this analysis due to data availability on markers resulting in the low number of patients in each subgroup. Second, the cutoff value shown in this study is dependent on the study population and thus could be not generally applicable. Inflammatory indexes will be validated in an independent ongoing prospective study, with the same inclusion and exclusion criteria of this study population and with cutoffs defined in this secondary analysis.
In conclusion, MII-1 appears to be a good prognostic index for patients with metastatic CC receiving first-line CT. Furthermore, our data suggest a possible role of MII-1/MII-2/MII-3 in identifying patients who are more likely to benefit from the use of B in a first-line setting.
Supplemental Material
Figure_1S – Supplemental material for Prognostic role of a new index (multi inflammatory index) in patients with metastatic colorectal cancer: results from the randomized ITACa trial
Supplemental material, Figure_1S for Prognostic role of a new index (multi inflammatory index) in patients with metastatic colorectal cancer: results from the randomized ITACa trial by Andrea Casadei Gardini, Emanuela Scarpi, Martina Valgiusti, Manlio Monti, Silvia Ruscelli, Laura Matteucci, Giulia Bartolini, Bernadette Vertogen, Flavia Pagan, Giulia Rovesti, Giovanni Luca Frassineti and Alessandro Passardi in Therapeutic Advances in Medical Oncology
Supplemental Material
Figure_2S – Supplemental material for Prognostic role of a new index (multi inflammatory index) in patients with metastatic colorectal cancer: results from the randomized ITACa trial
Supplemental material, Figure_2S for Prognostic role of a new index (multi inflammatory index) in patients with metastatic colorectal cancer: results from the randomized ITACa trial by Andrea Casadei Gardini, Emanuela Scarpi, Martina Valgiusti, Manlio Monti, Silvia Ruscelli, Laura Matteucci, Giulia Bartolini, Bernadette Vertogen, Flavia Pagan, Giulia Rovesti, Giovanni Luca Frassineti and Alessandro Passardi in Therapeutic Advances in Medical Oncology
Supplemental Material
Figure_3S – Supplemental material for Prognostic role of a new index (multi inflammatory index) in patients with metastatic colorectal cancer: results from the randomized ITACa trial
Supplemental material, Figure_3S for Prognostic role of a new index (multi inflammatory index) in patients with metastatic colorectal cancer: results from the randomized ITACa trial by Andrea Casadei Gardini, Emanuela Scarpi, Martina Valgiusti, Manlio Monti, Silvia Ruscelli, Laura Matteucci, Giulia Bartolini, Bernadette Vertogen, Flavia Pagan, Giulia Rovesti, Giovanni Luca Frassineti and Alessandro Passardi in Therapeutic Advances in Medical Oncology
Footnotes
Acknowledgements
The authors thank Gráinne Tierney and Cristiano Verna for editorial assistance. The study sponsor was not involved in the study design nor in the collection, analysis, or interpretation of data. The study sponsor did not provide writing support for the report. All authors had full access to all the data in the study. The corresponding author had the final responsibility to submit for publication.
Author contributions
Conception and design: ACG. Collection and assembly of data: all authors. Data analysis and interpretation: ACG, ES and AP. Manuscript writing: all authors. Final approval of manuscript: all authors.
Availability of data and material
The datasets generated and/or analyzed during the current study are available from the corresponding author upon reasonable request.
Conflict of interest statement
The authors declare that there is no conflict of interest.
Funding
The authors disclosed receipt of the following financial support for the research, authorship, and/or publication of this article: This trial was partially supported by the Italian Medicines Agency (Agenzia Italiana del Farmaco, AIFA – research grant no. FARM6FJJAY).
Supplemental material
Supplemental material for this article is available online.
References
Supplementary Material
Please find the following supplemental material available below.
For Open Access articles published under a Creative Commons License, all supplemental material carries the same license as the article it is associated with.
For non-Open Access articles published, all supplemental material carries a non-exclusive license, and permission requests for re-use of supplemental material or any part of supplemental material shall be sent directly to the copyright owner as specified in the copyright notice associated with the article.