
Abstract
Aims:
Evidence shows that community group activities can support and improve health and wellbeing. However, research into the patterning of community engagement suggests that socioeconomic factors may act as barriers to participation. Yet, because this research has mainly been conducted in high-income, Western and Global North countries, it remains unclear whether these patterns are consistent across different countries and cultural settings, especially in Global South, low-middle income, and non-Western countries. Further, we do not know whether country-level socioeconomic factors influence community engagement.
Methods:
Data from 64,065 adult respondents in the World Values Survey were analysed to examine the association between individual-level (education, income, and employment) and country-level (years of compulsory education, GDP per capita, Gini coefficient, and unemployment) socioeconomic factors and community organization membership rates. Multilevel regression modeling was used. Further analyses tested the associations between active membership and various types of community organization memberships. Analyses were adjusted for age, gender, country of birth, household size and marital status.
Results:
Prevalence of community organization membership varies across countries. Kenya, Colombia and Mongolia have the highest numbers of memberships and Greece, Russia and Egypt have the lowest numbers. Individual education and perceived household income, and country-level income inequality and employment rate were all positively associated with group membership. Some variations by organisation type were observed.
Conclusions:
We found a universal social gradient in community organisation membership, with individual education as the most influential predictor of more memberships across countries. Given that participation in community organizations can improve and support individual and community wellbeing, and plays a role in cultural and social capital development, reducing participatory disparities in these organisations could contribute to the reduction of health and social inequalities.
Introduction
As a social species, the propensity of humans to come together and support one another is sometimes cited as one of our characterising and evolutionarily advantageous traits.1–4 Since our earliest civilisations, we have organised ourselves into systems that allow the exchange of practical and psychosocial resources. 5 Theorists from a range of disciplines, including psychology, social epidemiology, and anthropology have built frameworks to explain how and why coming together benefits our lives, our society, and our health.6–10 For example, from a social and political perspective, theorist Robert Putnam proposed that civic participation is a key aspect of social capital, and suggested that its decline has deteriorated the quality of American society. 6 From a psychological perspective, social and community involvement can prevent the onset of anxiety and depression and support mental wellbeing. 11 From a biological and neural perspective, social connections and interactions engage neural circuits involved in social reward processing, modulate autonomic and neuroendocrine stress responses, and influence inflammatory neuroimmune responses.7,12,13 In fact, some researchers have argued that social resources are fundamental, yet often overlooked, determinants of health. 14 Some of this discourse has focused on community groups, including arts groups, 15 sports clubs,16,17 or voluntary organisation,18–20 and investigated how membership of such associations benefits individuals and communities, as well as wider society.
Yet, research into the patterns and predictors of community engagement has suggested there is a social gradient in accessing these spaces.21–25 At present, much of our understanding of community engagement and group membership comes from analysis of countries such as the Western, Global North countries such as the UK,21,22,26–28 the US,29,30 and Europe, 31 although there is also evidence from China 32 and Latin America. 33 These typically find that individual-level socioeconomic factors, such as income, education and employment are associated with membership rates. Practically, this may reflect how individuals in higher social positions are able to meet the costs of membership fees, transportation or equipment. In addition, motives to engage with communities may be transmitted through educational, occupational, or familial systems, as forms of cultural capital.22,34 As a result, membership may be more prevalent among individuals, as well as families, communities and societies with greater resources. However, because most of this research has been conducted in countries with similar demographic and economic structures, it is still not entirely clear whether this social gradient persists across diverse demographic and cultural settings. One Global South analysis of 20 Sub-Saharan African countries found a similar social patterning of community group membership, suggesting this challenge is not geographically isolated. 20 But research taking a global perspective is missing.
In addition, the potential role of country-level socioeconomic factors in predicting membership rates are at present underexplored. This is important because community participation involves individuals interacting with their communities and wider society, and so is likely to reflect the structure and nature of the wider socioeconomic context. However, these country-level predictors may be complex. On the one hand, higher income countries with greater infrastructure may offer more opportunities for community group formation, like venues and local funding. For example, one investigation into the predictors of volunteering in 55 countries across the world found that country wealth and educational levels, as well as indicators of social values and democracy and religiosity, predicted volunteering rates. 35 On the other hand, groups can emerge organically within communities even in the absence of formal infrastructure, through collective efforts of individuals. 36 The 20-country Sub-Saharan African analysis described above found that membership rates were also high in less advantaged social groups, and less wealthy countries. 20 Accordingly, there is a need to extend these analyses by exploring how country-level socioeconomic factors may influence a person’s engagement in community activities, and how these country-level factors may interplay with individual-level factors to predict membership rates across the world.
In this light, for the present analysis we used data from 50 countries across seven geographical regions in the World Values Survey (WVS), 37 to map individual- and country-level socioeconomic predictors of community organisation memberships. We examined associations between community organisation membership and individual income, educational level, and employment status, as well as four country-level socioeconomic factors: country-level wealth (GDP per capita), income inequality (Gini coefficient), educational provision (compulsory educational years) and employment (unemployment rate).
Methods
Data
Data from Wave 7 of the WVS (2017–2022) were analysed. WVS is a repeated cross-sectional survey conducted in over 90 countries, exploring global differences in people’s values, attitudes, behaviors, and subjective wellbeing. We selected Wave 7 as it is the most recent wave that includes questions on community organisation membership. In this wave, geographic coverage was expanded to include countries such as Greece, Myanmar, Nicaragua, and Tajikistan for the first time, and a total of over 129,000 respondents from 78 countries or territories were interviewed. Each of these countries used nationwide random probability sampling, and there was a minimum sample size of 1200. Samples were representative of all people aged 18 and above living in private households in each country. National research teams obtained as many Primary Sampling Units (PSU) as possible to ensure that the sample is representative of the population of each country, with a maximum of 10 respondents per PSU. Data were collected through face-to-face interviews conducted at respondents’ homes or residences, with responses recorded via paper questionnaires or CAPI (Computer Assisted Personal Interview).37,38
This study analysed data from the latest (6.0) version of the Wave 7 data release, which comprised data for 66 countries or territories. 37 Of those included in the data release (N = 97,220), 86,796 individuals from 64 countries or territories answered the questions on community organization membership, and 81,765 completed measures of individual sociodemographic variables. Sixteen countries did not include questions on the country-level predictors we planned to include, providing a final analytical sample of 64,065 participants from 50 countries across seven geographical regions. These countries were diverse geographically and economically: Argentina, Armenia, Australia, Bangladesh, Bolivia, Brazil, Canada, Chile, China, Colombia, Cyprus, Czechia, Ecuador, Egypt, Ethiopia, Germany, Great Britain, Greece, Guatemala, India, Indonesia, Iraq, Japan, Kazakhstan, Kenya, Kyrgyzstan, Lebanon, Malaysia, Mexico, Mongolia, Morocco, Myanmar, Netherlands, Nicaragua, Pakistan, Peru, Philippines, Romania, Russia, Serbia, South Korea, Tajikistan, Thailand, Tunisia, Turkey, Ukraine, United States, Uruguay, Vietnam, and Zimbabwe.
Measures
Community organisation membership was measured as self-reported active and inactive membership across the following activities: sports or recreational organization (e.g. football/baseball/rugby team); art, music, or educational organisation; political party; environmental organization; professional association; humanitarian or charitable organisation; consumer organisation; self-help or mutual aid groups; women’s groups; or any other organisation. Religious or labor group organisation was excluded as these can require specific beliefs or types of employment, meaning they are not open to everybody. Each respondent’s number of memberships was summed to generate a total membership score which ranged from zero to 10. We included both active and inactive membership in our main analyses, but sensitivity analyses focused on active memberships only.
Three individual-level socioeconomic predictors were used: (1) perceived household income; (2) educational level; and (3) employment. For perceived household income, participants were asked to position their household on a 10-point scale that represents the highest and lowest income groups in their country, taking all wages, salaries, pensions, and other incomes into account. This measure has the strength of providing more insight into the value of a specific salary within a particular country context and enabling comparisons of income position between countries with very different socioeconomic structures. To ensure comparability across countries, education was measured using the International Standard Classification of Education (ISCED), as endorsed by the United Nations (UN) and UNESCO. 39 Four categories were used; none or primary education only (ISCED 0–1), secondary education (ISCED 2–3), postsecondary education (ISCED 4–5), and Bachelor’s degree or above (ISCED 6–8). Employment status was measured as a three-category variable indicating whether participants were employed (either full-time working 30 + hours a week or part-time working less than 30 hours a week) or self-employed, not in labor force (e.g. retired, students, homemakers), or unemployed.
Four country-level socioeconomic predictors were considered: (1) compulsory education duration (in years) measured by the World Bank in 2018; (2) unemployment rate (% of total labor force) measured by the World Bank in 2019; (3) Gini income inequality index measured by the World Bank in 2012–2019; and (4) GDP per capita measured by the World Bank in 2019 (transformed into log to ensure a normal distribution; countries with zero GDP per capita were omitted). 37
The analyses were adjusted for age (a continuous variable, top coded at the 95th percentile; ranges from 18 to 89); gender (female vs male), respondent’s country of birth (native born vs immigrant), marital status (married or living together as married, divorced/separated/widowed, single), and household size (a continuous variable ranges from 1 to 10).
Analysis
To explore the associations between individual-level and country-level socioeconomic predictors and community organisation membership, we used multilevel models (MLM). We fitted a two-level model to account for the nested structure of the WVS data, as individuals living in the same country might be more similar to each other than to those living in another country. In the model, we allowed for the estimation of a random slope for education, perceived household income and employment status as we assumed that the relationship between these socioeconomic predictors and community organisation membership varied across countries. Two sensitivity analyses were conducted. First, we redefined the outcome variable and explored the total number of active membership organisations (N = 43,010). Second, we ran multilevel logistic regression modeling to examine the associations between socioeconomic predictors and membership in each type of community organisation. In these models, we were only able to estimate random slopes for perceived household income for the models to converge.
We used coefficients and 95% confidence intervals (CIs) to present the associations between individual- and country-level factors and community organisation membership, except for the sensitivity analysis that used multilevel logistic regression modeling. When fitting the MLM, we applied an ‘individual-level’ weight (level 1) to adjust some sociodemographic characteristics in the sample population to the distribution of the target population. This was calculated based on the marginal distribution of age, gender, education and religion.37,40 We also applied a ‘country-level’ weight (level 2) using the population scaled weight to transform each country’s sample size to 1000, so that all countries contributed equally to the combined analysis, while also ensuring the sample size for each country was in proportion to the population size of the region covered by the sample. 40 Both weights were provided in the WVS. Missing data were handled using listwise deletion (16% of participants did not complete individual-level data). The risk of multicollinearity was minimal (mean VIF = 1.70). Stata v18 was used for the analyses.
Results
Descriptive analyses
In our analytical sample, 52.7% of respondents were female and the average age was 42.8 years (standard deviation [SD] = 16.5). The minority (3.90%) had immigrated to their current country of residence, 58.4% were employed, 22.8% of the sample had a degree or higher educational qualification. The mean of respondents reported their position on the subjective 10-step income scale was 4.95 (SD = 2.08). A breakdown of distribution between average number of organisation memberships and age, gender, education, employment status and perceived household income by country is presented in Figures S1–S5.
Prevalence and patterns of memberships across the globe
When looking at the full sample (a sample with data on community organisation memberships who might or might not have completed other key measures), participants were members of, on average, 1.58 community organisations (SD = 2.52). Across 64 countries or territories, the highest average number of memberships were seen in Kenya (4.33 community organization memberships) followed by Colombia (3.56) and Mongolia (3.54). Lowest rates were reported in Greece (0.50), Russia (0.35), and Egypt (0.24) (Figure 1; Table S1). A similar demographic distribution was also observed in our analytical sample (Table S2). The average number of active organization memberships was positively correlated with the total number of organisation memberships, indicating that countries with a greater number of memberships also tend to have more individuals actively involved in these organisations. However, there are exceptions. For instance, in our analytical sample living in Morocco, the average number of total organisation memberships was 2.44, but only 0.35 of these were active. A similar pattern was observed in Malaysia, where 3.29 memberships with 0.56 active memberships, and in Zimbabwe, where the averages were 2.32 memberships and 0.38 active memberships.
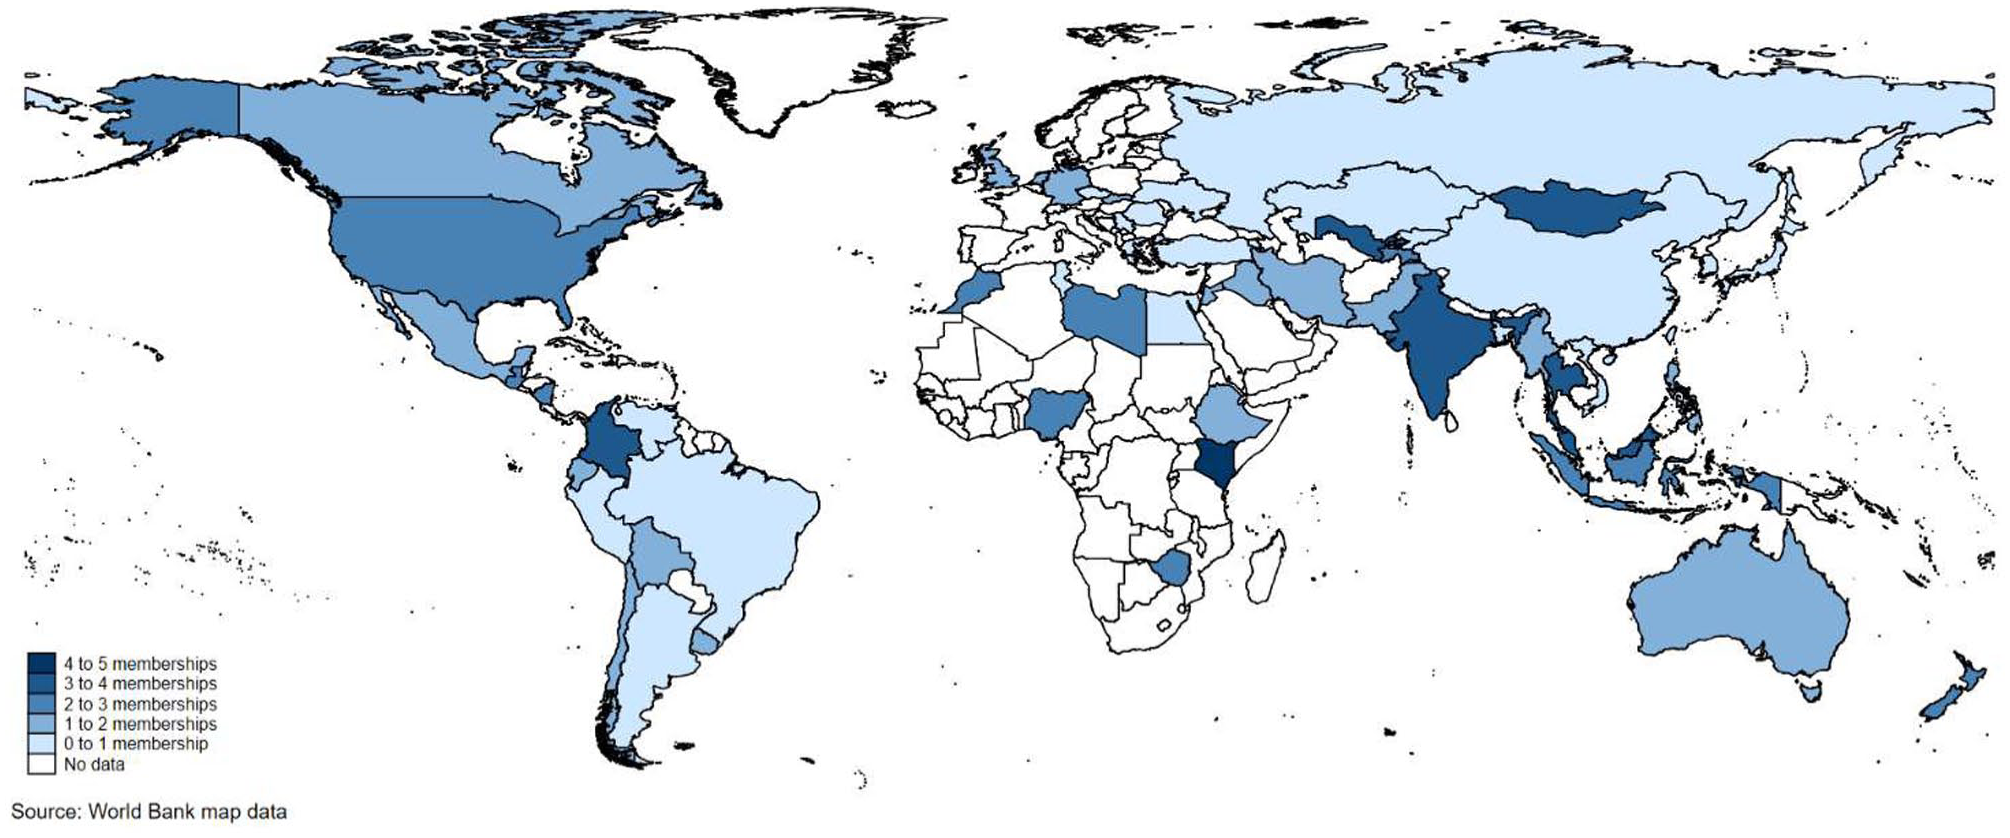
Prevalence of the average number of community organisation memberships by nation in Wave 7 (2017–2022) N = 86,796 participants from 64 nations. This map includes all nations with data on community organisation membership.
Individual-level socioeconomic factors
When compared with respondents with no or primary education, those with postsecondary education and degree or above had 0.26 (95%CI = 0.07, 0.45) and 0.49 (95%CI = 0.29, 0.69) more community organisation memberships, respectively (Figure 2; Table S3). Most countries show an educational gradient in community memberships, especially for participants with a degree or above (Figures S6a-S6c). However, this trend is reversed in Thailand, where individuals with no or primary education instead had more organisation memberships than those with a degree or higher (Figure S6c). There was also a positive correlation between perceived household income and organisation membership, in which a unit increase in perceived household income was associated with 0.06 more memberships (Figure 2; Table S3). This pattern was most prevalent in India, Pakistan and Canada, and was reversed in Thailand (Figure S7). No significant association at a multinational level was found for employment status, although some countries showed individual associations. For instance, employed individuals living in Thailand, Malaysia and India had more organisation memberships than those who were unemployed. However, the trend is reversed for those living in Colombia, Tajikistan and the US where unemployed individuals had more organisation memberships. On the other hand, those who were not in labor force living in Mongolia, Colombia and Great Britain had more organisation memberships than those who were unemployed, whereas those who were not in labor force living in Tajikistan, the US and Nicaragua had less memberships than unemployed individuals (Figure 2; Table S3; Figures S8a and 8b).
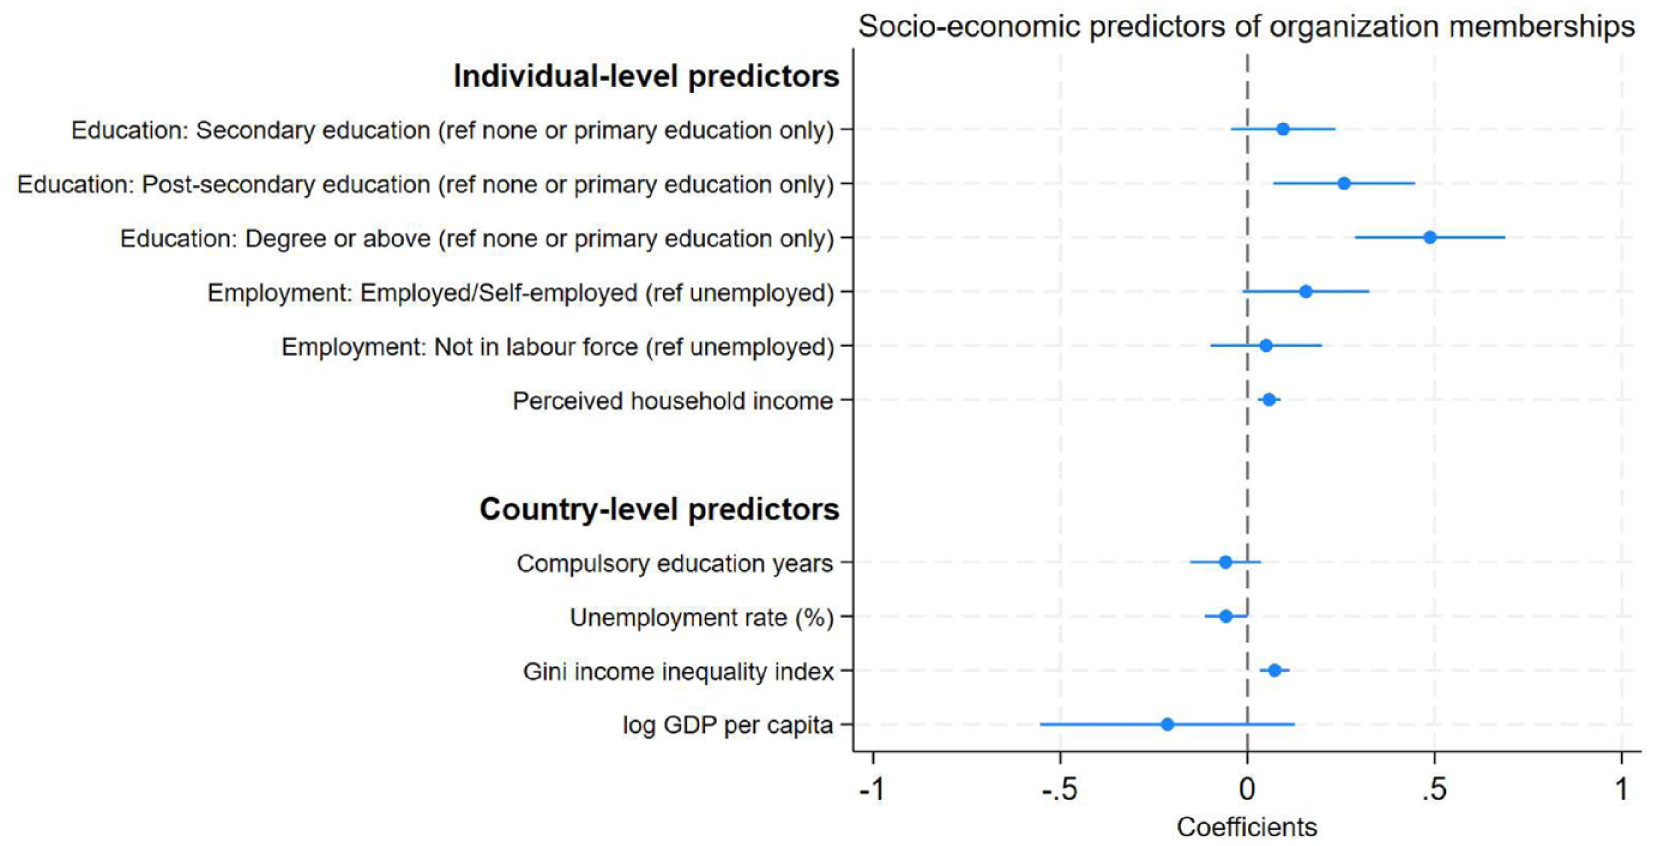
Association between individual- and country-level socioeconomic predictors and the number of organisation memberships across 50 nations (N = 64,065)
Country-level socioeconomic factors
When exploring country-level factors, memberships were negatively associated with unemployment rate (coef =-0.06, 95%CI =-0.11, -0.00) but positively associated with Gini income inequality index (coef = 0.07, 95%CI = 0.03, 0.11) (Figure 2; Table S3). These associations are shown in more detail in Figure 3, with the predicted probability of organisation memberships from the MLM plotted according to each country-level predictor. No associations were found for GDP per capital and compulsory education years.
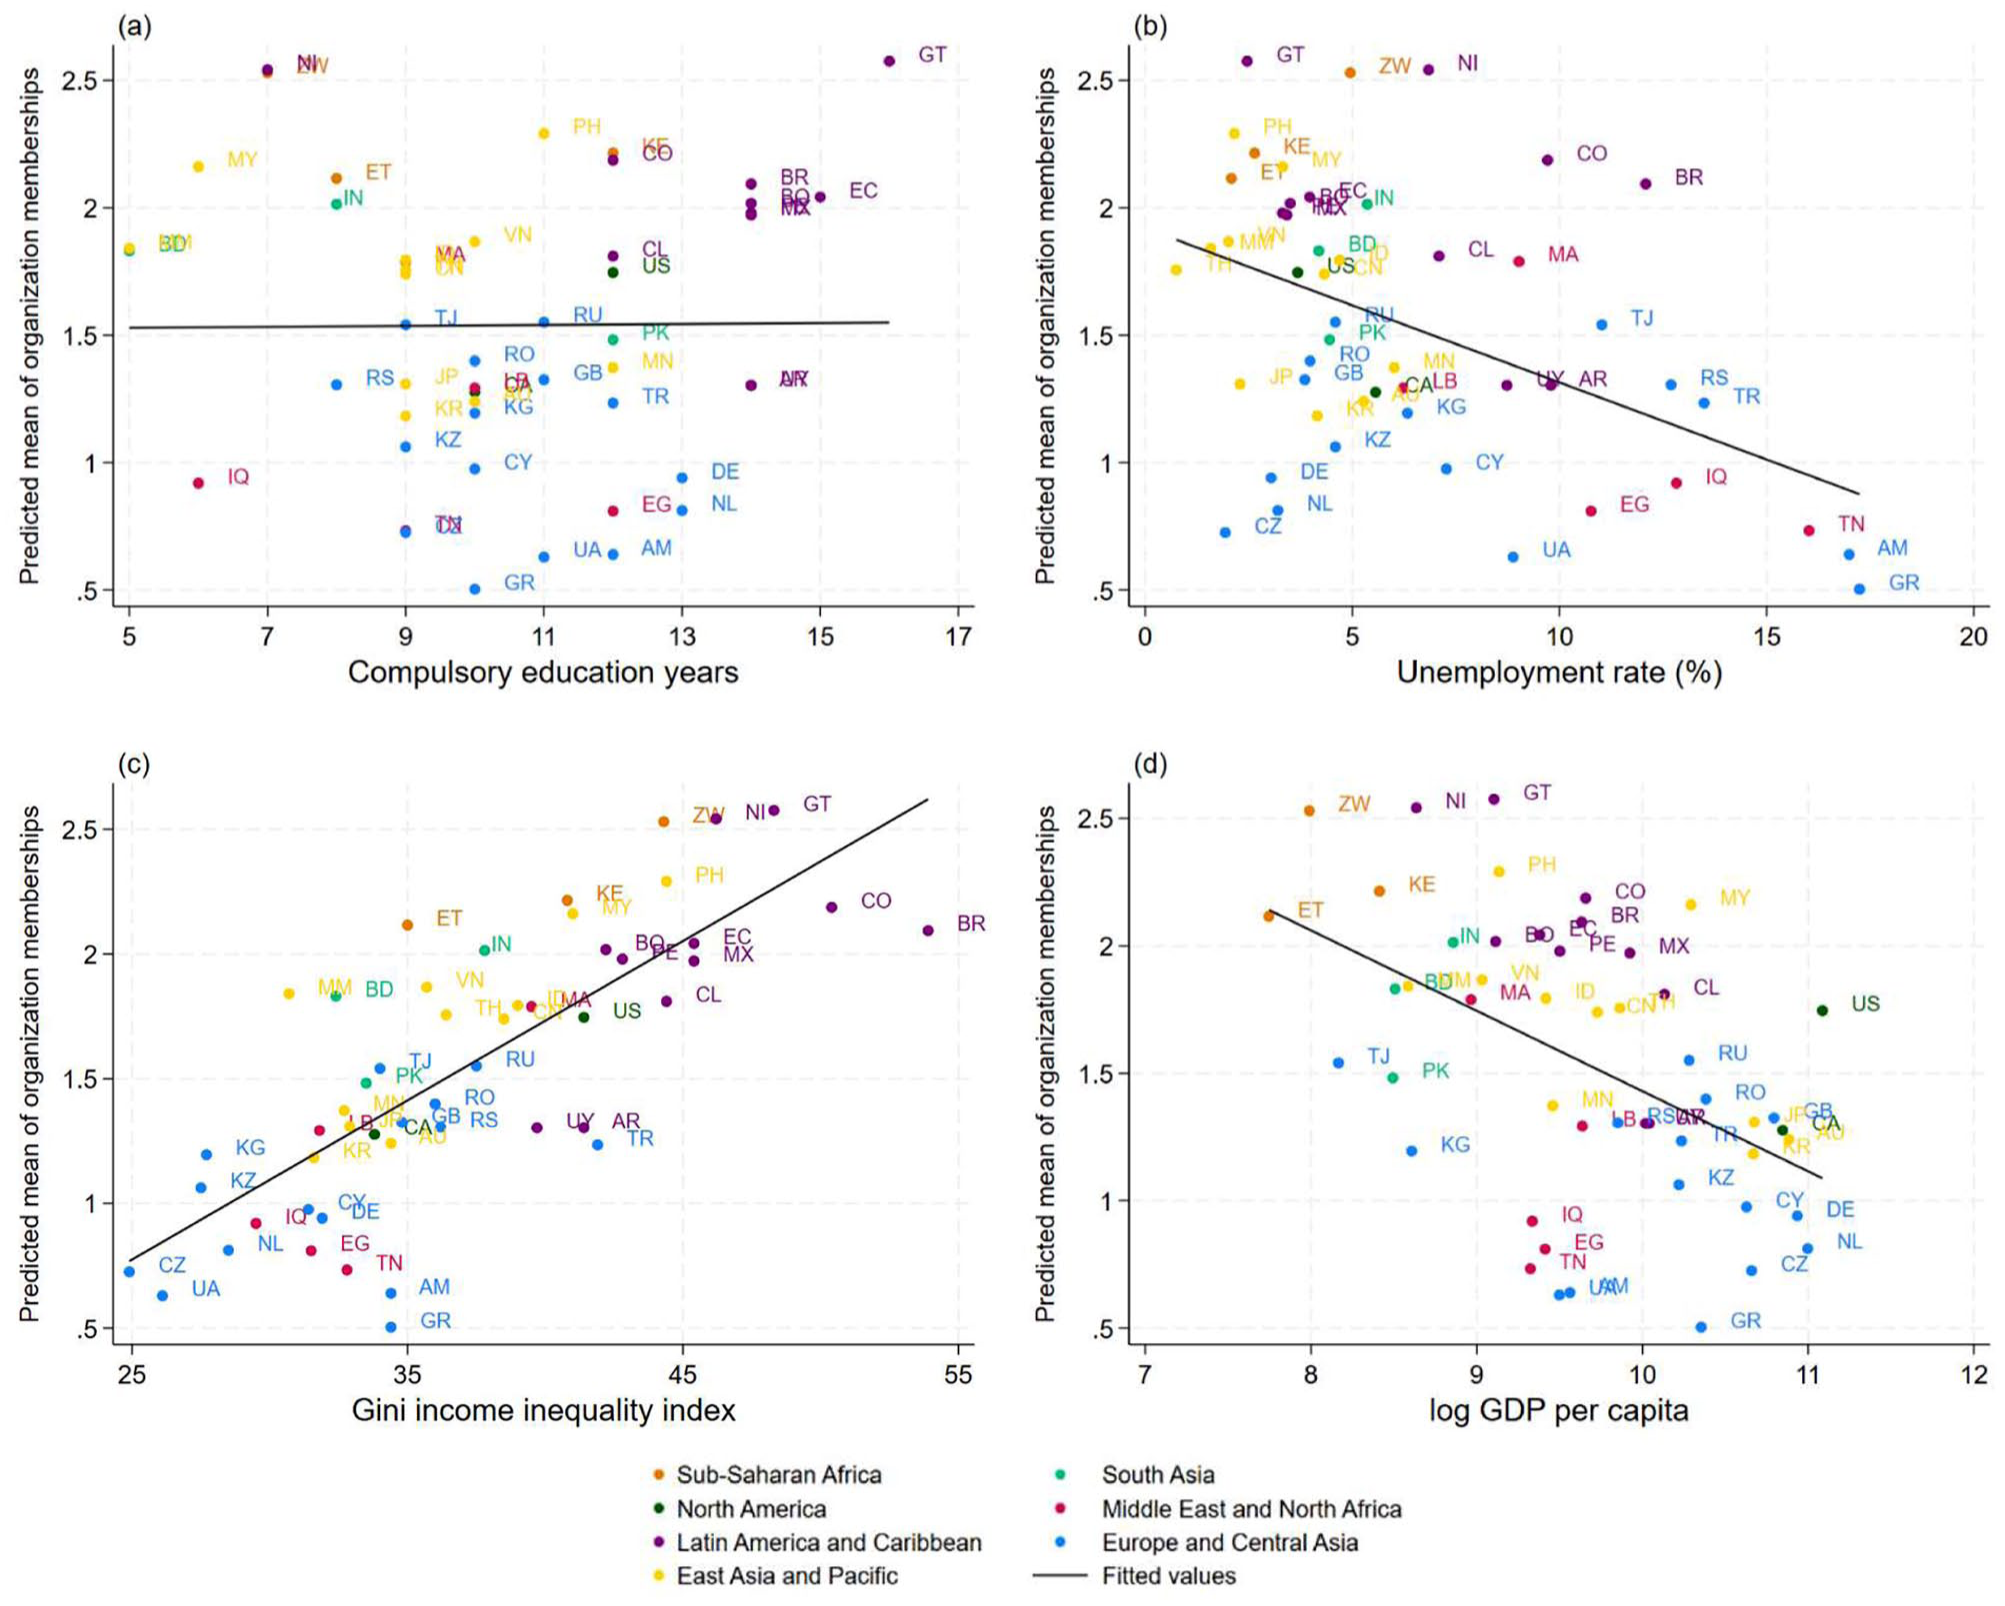
Associations between predicted means of organisation membership (estimated from multilevel models) and country-level predictors. (a) Compulsory education years, (b) Unemployment rate %, (c) Gini income inequality index, and (d) log GDP per capita AM = Armenia, AR = Argentina, AU = Australia, BD = Bangladesh, BO = Bolivia, BR = Brazil, CA = Canada, CL = Chile, CN = China, CO = Colombia, CY = Cyprus, CZ =Czechia, DE = Germany, EC = Ecuador, EG = Egypt, ET = Ethiopia, GB = Great Britain, GR = Greece, GT = Guatemala, ID = Indonesia, IN = India, IQ = Iraq, JP = Japan, KE = Kenya, KG = Kyrgyzstan, KR = South Korea, KZ = Kazakhstan, LB = Lebanon, MA = Morocco, MM = Myanmar, MN = Mongolia, MX = Mexico, MY = Malaysia, NI = Nicaragua, NL = Netherlands, PE = Peru, PH = Philippines, PK = Pakistan, RO = Romania, RS = Serbia, RU = Russia, TH = Thailand, TJ = Tajikistan, TN = Tunisia, TR = Turkey, UA = Ukraine, US = United States, UY = Uruguay, VN = Vietnam, ZW = Zimbabwe.
Sensitivity analyses
The sensitivity analysis on socioeconomic predictors of active membership shows a similar trend to the main analysis: individuals with postsecondary education, those with a degree or above, people with higher income, those living in countries with lower unemployment rate or people living in countries with a higher Gini income inequality index had more active memberships (Figure S9). However, we also found that individuals who were employed or self-employed also had more active memberships in community organisations than unemployed individuals, which was not observed in the main analysis.
When exploring each community organisation, we found some variations in a socioeconomic gradient across community organisations. For instance, a stronger educational gradient was observed particularly for sports or recreational organisation, arts, music or educational organisation, professional organisation, and charitable or humanitarian organisation memberships (Table S4). Compulsory education was negatively associated with the odds of being in a political party membership and the odds of being in a self-help/mutual aid group. With the exception of membership of self-help/mutual aid group, political party, and other community organisations, perceived household income was positively correlated with the odds of membership. Unlike all other organisations, no individual socioeconomic factors were observed for self-help/mutual aid group membership.
Discussion
Using data from over 64,000 individuals across seven geographical regions, we demonstrate ubiquitous engagement with community groups across every region of the world. But we also find intriguing and important differences in individual- and country-level socioeconomic predictors of community organisation membership and unique insight on how compositional and contextual factors may promote or prevent membership rates. Across 64 nations, we found the highest membership rates in Kenya, where the average respondent was a member of 4.33 community groups, and the lowest rates in Egypt, where the average rate was 0.24. Countries with a greater number of memberships also tend to have more individuals actively involved in these organisations. But there are exceptions; for instance, of the analytical sample living in Morocco, Malaysia and Zimbabwe, the average number of organisation memberships was over 2.3 but the average number of active memberships was less than 0.6. In our analytical sample from 50 nations, a social gradient in membership rate was observed and individual educational level emerged as a particularly important and consistent socioeconomic predictor of group involvement, although some differences across activity-type were also seen. At a country level, higher income inequality and lower unemployment rates were also associated with a higher group membership rate.
For the individual-level predictors, educational level appeared to be the most consistent and important factor in influencing community organisation membership across countries and activities. First, educational environments such as schools, colleges or universities are places where ideas are introduced and exchanged. As a result, they may foster pro-social attitudes, or environmental, political, or social justice related values that motivate membership. 41 Second, school environments may valorise creative, community-oriented or self-expressionist attitudes, and therefore could influence individuals with higher levels of education to seek out community groups.20,42 Third, skills and knowledge that are typically acquired in educational systems may be required for some community group activities. This could include literacy, or creative or sports skills. This skill accumulation can be framed as forms of capital, and may extend to the social skills, customs or knowledge that allow individuals with higher levels of education to feel more comfortable or welcome in community group settings. Finally, many social theories frame education as an aspect of cultural capital, and see community groups as a way for individuals with higher educational levels to demonstrate or affirm their cultural capital or social position.22,23,43 This may extend to social roles, whereby community organisation memberships, particularly professional organisations (which may also be a work requirement in some countries), may enable members to demonstrate their status. Indeed, it is notable that individuals across all nations reported membership of groups that they did not actively participate in currently. This affirms previous research on capital, suggesting that membership alone can be a way for individuals to project an image of themselves as active, knowledgeable, or community-oriented individuals, and bolster their social identity. 44
Although individual-level education is an important factor of community organisation memberships, country-level education (measured by compulsory education years) is not. This suggests that joining community organisations may not depend on the length of mandatory education in a country, but rather on whether individuals have equal opportunities to pursue higher education or build cultural and social capital. In fact, apart from Thailand where the trend is reversed, participants with a university degree or higher tend to have more memberships than those with only primary or no education, regardless of whether attaining a university degree is more or less common within their country. That said, there is exception for political party and self-help/mutual aid group memberships, where compulsory education was negatively associated with the odds of being in these organisations. One explanation is that in countries with fewer compulsory education years, people may have actively joined these organisations to support their country’s socio-political development.
Income was another significant and consistent individual-level predictor of community organisation membership. With the exception of membership of self-help/mutual aid group, political party, and other community organisations, individuals who perceived their household income to be higher had higher membership rates. This is most prevalent in countries such as India, Pakistan and Canada. This association may, again, reflect resource accumulation, whereby household level financial resources, or the perception of affluence, encourage people to invest into community organisations. This might involve purchasing equipment or membership fees, but also could act at a community level. In addition to resource accumulation, the resource theory developed in the volunteering literature may also explain this observation. The theory suggests that employed and wealthy individuals have more financial and psychosocial resources to engage with voluntary associations, and volunteer their time, but also their interest and care. 35 This is reflected in our main analysis, as well as in the sensitivity analysis where employed or self-employed individuals have a greater number of active memberships than those who were unemployed.
While individual income was associated with community organisation memberships, we did not find evidence that this extended to country-level wealth. There was no association between GDP per capita and organisational memberships. However, a positive correlation was observed between memberships and Gini income inequality index. One interpretation is that countries with greater income inequality have less developed infrastructures or are more likely to contribute to unequal access to essential services, and as a result, community organisations serve as proxies for formal provisions.45–47 This might be particularly relevant to educational and professional community groups. Alternatively, in high-income countries (which often have lower income inequality), community organisations are generally funded though membership fees, 48 while in lower income countries (which often have higher income inequality) community organisations may be less about leisure and more about essential collective cooperation, or the distribution of basic, essential resources and social groups are systems of reciprocity. 18 The correlation between higher Gini income inequality and higher membership rates could also reflect differences in values and cultural norms. High-income, western, Global North countries with low-income inequality such as the UK, are often described as highly individualist. 49 In these settings, community engagement relates more to leisure and is accordingly more associated with individual socioeconomic resources. By contrast, countries in the Global South typically have more collectivist cultures49,50 which may encourage community engagement. Although cultural values are complex and require more detailed research, this could explain the exceptionally high rates of memberships we observed in countries such as Kenya and Colombia. However, cultural values may only explain part of the picture for some countries and not for others. For instance, Russian, despite being considered as a collectivist country, did not show a significantly high average number of memberships. Overall, these unexpected findings invite us to consider not only how engagement rate in community groups differs across countries, but also how the potential health and social benefits of community engagement might vary in different social and cultural contexts.
We also observed a correlation between country-level employment rates and community organisation membership, but no correlation between individual employment status and membership, suggesting this effect occurs at a country-level but not at an individual-level. Specifically, as unemployment rate increased, the average number of group memberships per person was seen to decrease. There could be two explanations for this. First, employment status is less relevant in predicting community organisation memberships because these memberships may reflect one’s cultural and economic capital, which is influenced by education and income. Second, at a country-level, labor forces generate country-wide resources, services and infrastructures that could support community group formation. 20 High unemployment rates can occur alongside fewer social, cultural, and economic opportunities, such as those resulting from lower state funding and poorer social leisure and community infrastructures. As a result, fewer people engage in these activities.
Our findings reveal a clear socioeconomic gradient in community group membership across various countries and cultural settings. Such gradient is in parallel with the socioeconomic gradient in health, whereby people with higher socioeconomic position enjoy better health. As such, our results can be interpreted in two ways. First, community engagement could be considered an ‘asset’ more frequently accessed by those from privileged backgrounds. Second, community engagement can be seen as a modifying health behavior. Indeed, epidemiological studies have suggested that community engagement, including arts and cultural participation,15,29,51,52 volunteering53–56 or leisure activities more generally57,58 are beneficial to health. Mechanistically, this has been proposed to act through a range of social, psychological, biological and behavioral processes, such as the establishment of psychosocial support networks, changes to inflammatory systems or habit formation. 7 In particular, participation in groups or in communities can facilitate social connections, build social capital and develop social identities, which have been shown to help improve health and wellbeing. 14 All of these can help contribute to community wellbeing, collective happiness, social cohesion and societal harmony. In this light, we might consider how socioeconomic barriers to community participation could exacerbate health and social inequalities by preventing those most in need from accessing community spaces. 59 Yet, because this work has largely examined socioeconomic patterning in wealthy countries, our understanding of role of these socioeconomic barriers in exacerbating health inequalities is limited to resource-rich contexts. Therefore, our demonstration that lower educational levels and lower perceived income are persistent barriers to community organisation membership across countries could be relevant to understanding global health inequalities. Further still, the roles of both individual-level and country-level socioeconomic factors in predicting membership highlight how compositional and contextual factors may compound and further entrench socioeconomic barriers to the benefiting effects of community engagement on individual and societal wellbeing.
One of the key strengths of this analysis is the use of a large dataset of representative samples from over 50 countries, which allowed us to examine how diverse socioeconomic and geographic contexts may influence community engagement. The richness of the WVS dataset permitted us to examine associations between individual- and country-level socioeconomic factors and membership rates. Our analyses also accounted for the nested structure of the WVS data and allowed for the associations between individual socioeconomic predictors and membership to vary across countries. However, because the WVS data were only available cross-sectionally, we were limited in drawing causality, and this represents a limitation of the study. In addition, measurement error may have arisen from the use of subjective measures, such as perceived income, in the analysis. We also lacked data on the country’s heterogeneity in high-level infrastructure and policy, which may affect individual-level predictors of organisational membership, as well as data on individual social media use, which may play a role in membership. Bias may be introduced due to interviews being conducted in residents’ homes, the exclusion of the underhoused population from the sample, as well as the exclusion of religious and labor group organisations. Nevertheless, our findings are important in understanding how socioeconomic factors promote or inhibit participation and could contribute to the reduction of global social and health inequalities. That said, we also acknowledge the cross-country differences in how socioeconomic factors influence membership, and recognise the need for a more comprehensive socio-ecological model, beyond socioeconomic factors (such as political pressures), to better capture broader contextual influences on participation in future studies.
In addition, we acknowledge important challenges around undertaking global epidemiological research on complex social exposures. The definition or interpretation of concepts such as community groups will naturally vary by country. While the data collection for WVS is designed by social scientists representing each country involved, the necessity of using the same question cross-nationally could mean other forms of community engagement may have been missed or individuals may have under-reported related activities that they perceived to fall outside the definition of community groups. This is particularly a challenge for countries where close community activity may be more interwoven in daily life rather than constituting separate ‘leisure’ behaviors. As such, it is important to acknowledge our analysis presents just part of the overall picture of global patterns of membership enrolment to community activities. We support efforts to further decolonise global epidemiological research through expanding the tools, approaches and lenses used.
Conclusions
This analysis has demonstrated associations between individual-level and country-level socioeconomic factors and community group memberships across seven geographical regions in the WVS. Owing to the globality of the dataset, we were able to generate a range of novel findings and offer insight into the role of country-level factors in predicting community group membership rates. By using a large-scale dataset of representative samples from 50 different countries, we demonstrated associations between community organisation membership and individual-level income, education, employment, but showed that individual educational level was the most consistent across different countries and type of group. Gini coefficient and employment rates were also positively associated with community organisation membership, suggesting country-level resources and infrastructure may influence participation. Overall, we show that there are socioeconomic barriers to community organisations that persist across different socioeconomic and geographical contexts. We therefore highlight community groups, and the targeting of these socioeconomic barriers, as a possible focus for efforts to reduce global health and social inequalities.
Supplemental Material
sj-docx-1-rsh-10.1177_17579139261421163 – Supplemental material for Individual- and country-level socioeconomic predictors of community group membership across 50 countries in the World Values Survey
Supplemental material, sj-docx-1-rsh-10.1177_17579139261421163 for Individual- and country-level socioeconomic predictors of community group membership across 50 countries in the World Values Survey by Emma Walker, Daisy Fancourt and Hei Wan Mak in Perspectives in Public Health
Footnotes
Conflict of Interest
The authors declared no potential conflicts of interest with respect to the research, authorship, and/or publication of this article.
Funding
The authors disclosed receipt of the following financial support for the research, authorship, and/or publication of this article: HWM was supported by Jameel Arts & Health Lab Global Population Health Fellowship, and supported by the UK Research and Innovation [MR/Y01068X/1]. DF was supported by a British Academy Mid-Career Fellowship MCFSS22\220006.
Ethical Approval
Ethical approval was not required for this study, as it analysed secondary data that were anonymised and publicly available.
Data Sharing
Data are publicly available on the World Values Survey database site: https://www.worldvaluessurvey.org/wvs.jsp. All code used for these analyses is publicly available online: ![]() .
.
Supplemental Material
Supplemental material for this article is available online.