
Abstract
Keywords
Today, the total alcohol consumption in Sweden is one of the lowest in Europe (World Health Organization [WHO], 2018). Despite that fact, in 2019 alcohol use accounted for 4.8% of the total disease burden and 4.6% of total deaths in the country, with the corresponding measures appearing higher in the capital region, the Stockholm Region (5.3% and 5.2%, respectively) (Institute for Health Metrics and Evaluation, 2021). A recent report from the Swedish Council for Information on Alcohol and Other Drugs (CAN) on alcohol consumption indicated a relative stability in overall per capita alcohol intake (in litres of pure alcohol per inhabitant aged ≥15 years) in Sweden in 2001–2019, with a tendency to decrease (overall 2% decrease in total alcohol consumption since 2001 and, in the past decade, a 9% decrease since 2010) (Trolldal, 2020). Data on beverage-specific intake in 2019 compared to that in 2001 demonstrated a pronounced and constant decrease in the consumption of spirits and low alcohol content beer (alcohol with a volume of 3.5%) by 33% and 52%, respectively. Over the same period, consumption of wine and strong beer (alcohol with a volume of >3.5%) fluctuated and increased overall by 23% and 12%, respectively, although it has become relatively stable in recent years (Trolldal, 2020). The tendencies overall remained the same in 2020, as shown in the report by CAN on alcohol consumption in Sweden during the COVID-19 pandemic, with total alcohol consumption continuing to decrease, as was the case for the consumption of spirits and low alcohol content beer, while the consumption of wine did not change in 2020 compared to that in 2019, and consumption of strong beer slightly decreased (Trolldal & Åström, 2021). Despite a steady decrease in the consumption of spirits and declining total alcohol consumption over the last two decades, age-standardised incidence of alcohol-related disorders and disease in Sweden remained fairly unchanged (Bergman et al., 2020).
Several studies indicated that variability in alcohol consumption over time is at least as important the “driving forces” determining health outcomes and societal costs attributable to alcohol as the actual level of consumption measured cross-sectionally (as recent intake, weekly average consumption, etc.) (Berg et al., 2013; Böckerman et al., 2017; Britton et al., 2016; Heckley et al., 2014; O’Neill et al., 2017, 2018). For example, individuals with a consistently moderate alcohol intake were shown to be at a lower risk of cardiovascular morbidity than those with inconsistent moderate alcohol consumption over time, those with stable heavy intake or former drinkers (Britton et al., 2016; O’Neill et al., 2017, 2018), with similar findings reported for the risk of poor self-rated health (Gemes et al., 2019; Powers & Young, 2008) and dementia (Sabia et al., 2018). To gain insights into the development of distinct longitudinal alcohol consumption trajectories, several studies examined sociodemographic and socioeconomic factors that could predispose the stability or change in various drinking patterns over time (Moore et al., 2005; Syden et al., 2014; Tran et al., 2015), although their results differ considerably probably due to methodological differences. Furthermore, taking account of alcohol beverage preferences was suggested to be of importance in order to prevent overlooking patterns of drinking behaviours and associated risks among those exposed to beverages lower in alcohol content, such as wine or beer (Boban et al., 2016; Makela et al., 2011; Room et al., 2011). Thus, a study from Switzerland reported preferences of beer, rather than that of other beverages, to be associated with risky drinking behaviour (Dey et al., 2014). In addition, a Swedish study showed that consumption of strong beer better predicts the subsequent development of a heavy drinking pattern than the consumption of spirits (Ramstedt & Boman, 2011). A recent systematic review on disease burden due to different beverages pointed out that the assessment of alcohol-attributable harm (and its implications for alcohol control policies) should consider both beverage preferences and patterns of consumption (Rehm & Hasan, 2020).
To our knowledge, scientific evidence on the predictors of life-course drinking patterns that considers the beverage type is limited, mostly due to shortage of repeated measures of beverage-specific alcohol consumption. Therefore, we investigated whether trajectories of alcohol consumption over time in Sweden differ according to beverage types using data from a population-based, longitudinal cohort study with repeated alcohol consumption measure. Furthermore, we explored the association between various socioeconomic, lifestyle and health-related determinants and beverage-specific alcohol consumption trajectories.
Methods
Study population and design
The study is set in the Stockholm Public Health Cohort (SPHC), which has been described in detail elsewhere (Svensson et al., 2013). In brief, the SPHC is based on a gender- and area-stratified random sample of Stockholm County residents aged ≥18 years. From 2002, the SPHC survey is sent out approximately every four years to collect information on sociodemographic characteristics, somatic and mental health, psychosocial factors, and health-related behaviours, including alcohol consumption habits (Svensson et al., 2013). Individuals who responded to the baseline survey in 2002 and the first follow-up survey in 2007 were asked if they consented to register linkages. For each respondent who consented, self-reported data were linked to the Swedish nationwide registers using the unique personal identity number (Ludvigsson et al., 2009).
In this study, we included the SPHC participants who were first surveyed in 2002 and then responded to the follow-up surveys in 2007, 2010, and 2014. However, to ensure completeness and comparability of information on alcohol consumption habits, we retrieved and analysed data from surveys in 2002, 2010 and 2014 only. Information from the follow-up survey in 2007 was not included in the study as that survey used a different set of questions and limited response options regarding alcohol consumption, compared to the ones used in 2002, 2010 and 2014. Out of 31,182 respondents to the baseline survey in 2002, 23,794 (76.3%) later consented to register linkage and further responded to follow-up questionnaires in 2010 (n = 19,327; 62.0%) and 2014 (n = 14,541; 46.6%). We restricted the study population to individuals aged ≥25 years at baseline (n = 22,205), i.e., to those with established employment, educational and social backgrounds. Overall, 96.5% of the participants responded to alcohol-related items at baseline, and the corresponding response rate remained high in follow-up surveys in 2010 (97.2%) and 2014 (99.6%) (Table S1). Finally, we restricted the study population to individuals with valid data on alcohol consumption in all three surveys, yielding the analytical sample of 13,152 people (Figure 1). Table S2 describes individuals included in and excluded from analytical sample.
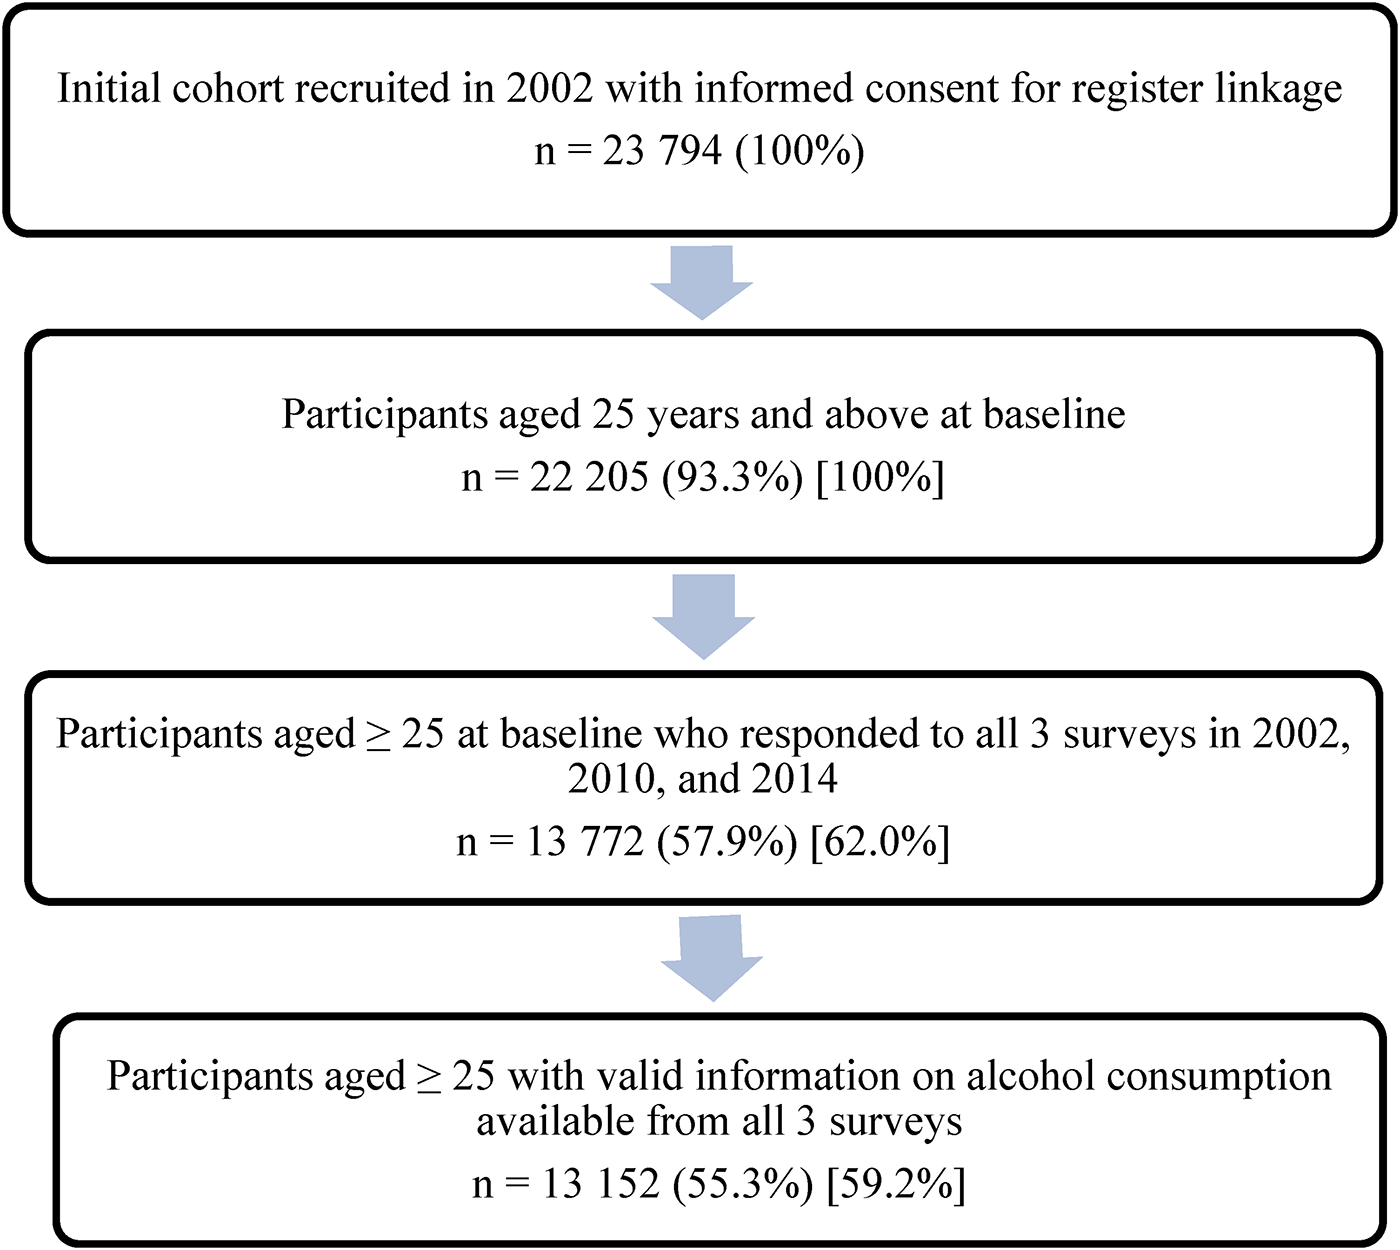
Flow chart of the selection process of 23,794 respondents to the Stockholm County Public Health Cohort surveys in 2002 (baseline), 2010 and 2014 (follow-ups).
Measures
Information on alcohol consumption
In each SPHC survey, the average amount and frequency of consumption of spirits, wine, low-alcohol wine, strong beer and low alcohol content beer were assessed for a “typical week” referring to 12 months before the survey. This period-specific, normal week concept showed higher validity and greater prevision than the commonly used, quantity-frequency method of surveying alcohol consumption (Ekholm et al., 2008; Romelsjo et al., 1995). Self-reported, beverage-specific consumption in centilitres was recalculated in grams of 100% alcohol per week based on standard estimates of a drink size (Andreasson et al., 1988) (in Sweden, one standard drink contains approximately 12 grams of 100% ethanol (WHO, 2018)). Further, in line with previous studies on alcohol consumption levels, including studies from Sweden (Holmes et al., 2014; Landberg & Ramstedt, 2021; Leifman et al., 1995; Roerecke & Rehm, 2014; Shield et al., 2017; Smyth et al., 2015), we applied gender-specific cut-offs and defined the following weekly alcohol consumption categories: non-drinkers (0 g for both genders), light-to-moderate drinkers, hereafter “moderate drinkers” (>0 to ≤168 g for women and >0 to ≤252 g for men), and heavy drinkers (>168 g for women and >252 g for men).
Next, in line with prior research (Britton et al., 2015, 2016; Gemes et al., 2019), we built eight alcohol consumption trajectory groups based on the levels of alcohol consumption reported in 2002, 2010 and 2014 (Table S3). The respondents who reported the same consumption level at all three surveys were defined as either (1) stable non-drinkers, (2) stable moderate drinkers, and (3) stable heavy drinkers. If the same level of consumption was indicated in two out of three surveys, the participants were categorised as (4) unstable non-drinkers, (5) unstable moderate drinkers, or (6) unstable heavy drinkers, regarding the most frequent alcohol intake level. The respondents were defined as (7) former drinkers if they reported not drinking alcohol in 2014 and indicated any level of consumption in 2002 and 2010. Any other drinking patterns were combined in (8) the mixed trajectory group.
Finally, for each respondent, apart from stable non-drinkers (n = 862), we established the “mainly consumed beverage type” by considering the most consumed beverage within each survey and the beverage consumed most frequently across all three surveys (Table S4). Thus, 12,290 out of 13,152 individuals from analytical sample had information on consumed beverage types. To ease the comparison between beverage-specific trajectories, we combined mainly consumed beverage types into three categories, namely spirits, wine (wine or low-alcohol wine) and beer (strong beer or low alcohol content beer). A total of 11,222 individuals had mainly consumed a beverage type falling into one of those three categories. The rest of the analytical sample (n = 1068) composed a category called “other beverages” if no clear pattern in preferred beverages was established or if the respondent reported consuming mainly alcopops/cider since these beverages were not included in the baseline survey in 2002. The “other beverages” category was not considered for analysis due to substantial heterogeneity.
Predictors
Information on predictors was retrieved from the baseline survey. “Current main daily activity” was categorised as employed/self-employed or unemployed/others (with “others” referring to retirement, long-term sick leave, studying, parental leave, housework or any other activities). “Self-rated general health” was defined as good (if rated as very good or good), average or poor (if rated as poor or very poor) (Idler & Benyamini, 1997), based on the responses to the standardised question with answers on a 5-pointLikert-scale (Bjorner et al., 1996). “Tobacco smoking” was categorised as never, former or current smoking. “Fruit consumption” frequency was used as a proxy for healthy eating habits, and categorised as high (if reported consuming fruits/berries as more than one serving per day) or, otherwise, low (WHO, 2003). “Physical activity” was categorised as active (if reported >120 minutes of weekly moderate physical activity) or, otherwise, inactive (WHO, 2010). “Social support” referred to having someone who can provide support for personal problems, and was categorised as high (if reported having support always or most of the time) or, otherwise, low.
Further, register-based sociodemographic data on sex, age at baseline (10-year splits from age 25), marital status (as married/cohabiting or single/divorced/widowed) and socioeconomic position (SEP) (i.e., current or past occupation, according to the Swedish socioeconomic classification, categorised as higher, intermediate or lower non-manual, skilled or unskilled manual, or self-employed) were obtained through linkage to the Longitudinal Integration Database for Medical Insurance and Labour Market Studies (Ludvigsson et al., 2019).
Statistical analysis
Multinomial logistic regression was fitted to assess the association of different alcohol consumption trajectories and individual predictors (i.e., SEP, current main daily activity, marital status, self-rated general health, tobacco smoking, fruit consumption, physical activity, and social support). The predictors were assessed first in the analyses for the overall alcohol consumption trajectories (regardless of beverage type) where the stable moderate drinking trajectory was used as a reference. Then, the predictors for beverage-specific trajectories were analysed, separately for each beverage type. For these analyses, the stable moderate drinking trajectory of a corresponding beverage was used as a reference. Due to the lack of statistical power, the analysis of beverage-specific trajectories was not performed for individuals who reported spirit as the preferred beverage (n = 236). Among individuals with beer and wine as preferred beverages, two trajectory groups were further excluded from beverage-specific analysis, namely unstable non-drinkers (n = 25 and n = 53 in individuals with beer and wine as preferred beverages, respectively) and mixed trajectories (n = 5 and n = 22, respectively). All models were adjusted for age at baseline and gender, and the results were reported as odds ratios (OR) and 95% confidence intervals (CI). For each predictor, the analyses were based on all individuals with data available on the corresponding predictor. Hence, the analytical samples marginally varied between the analyses of different predictors; however, the proportions of missing data were low (in the range of 0.1%–1.4%), apart from slightly higher proportions of missing current main daily activity (2.0%), SEP (2.7%) and smoking (5.2%).
The STROBE checklist is presented in Table S5. The study was approved by the Stockholm Regional Ethical Review Board (case numbers 2006/112-31 and 2012/1812-32).
Results
Descriptive results
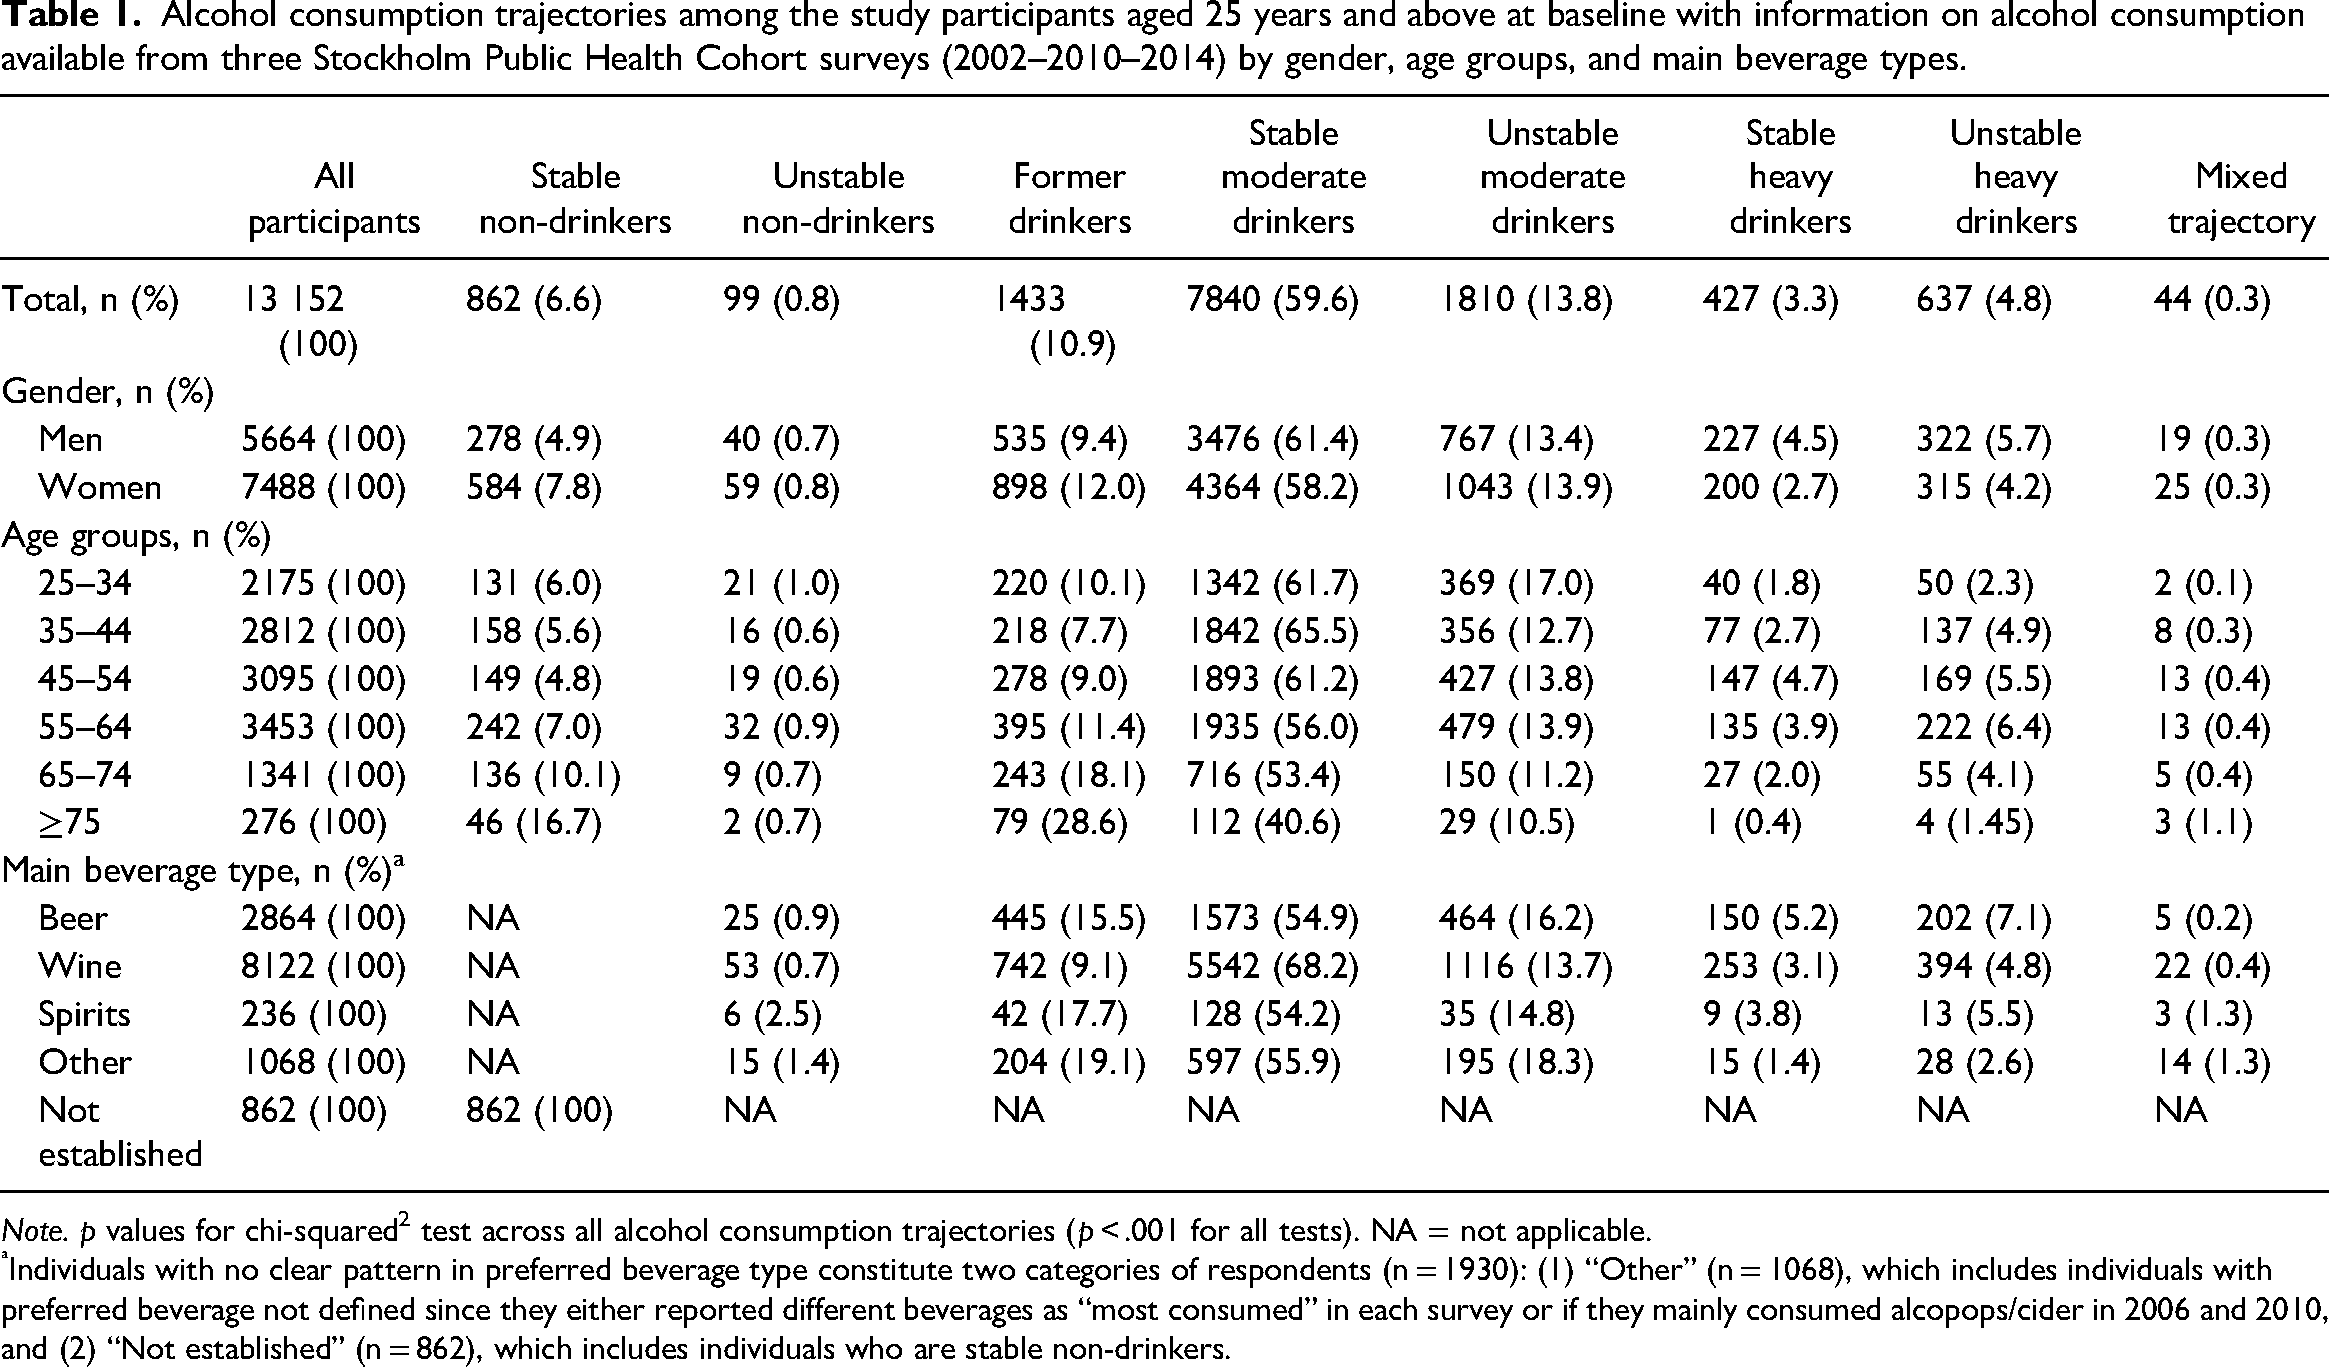
At baseline and in each follow-up survey, the majority of respondents were defined as moderate drinkers (Table S1). Table 1 shows the distribution of alcohol consumption trajectories over time across genders, age groups and beverages in the analytical sample of 13,152 individuals (56.9% women) aged 25–84 years at baseline (mean age 49.2 years, SD [13.1]). In total, stable moderate drinking was defined in approximately 60% of study participants and prevailed over other trajectories regardless of gender, age and beverage type. Other trajectories were less common with, for example, unstable moderate drinking and former drinking being established for 13.8% and 10.9% participants, respectively. Only 6.6% individuals were defined as having a stable non-drinking trajectory. Among women and respondents aged ≥65 years, stable non-drinking and former drinking were defined more frequently compared to men and younger individuals. Least frequently, the respondents were defined as having stable and unstable heavy drinking trajectories (3.3% and 4.8%, respectively) and these trajectories prevailed among men compared to women and in individuals aged 35–64 years compared to other age groups. Among 11,222 participants with established beverage type, wine was defined as a preferred beverage for 72.4% (n = 8122) of individuals, followed by beer (25.5%; n = 2864) and spirits (2.1%; n = 236). Interestingly, among the participants with beer as their preferred beverage, the proportions of stable and unstable heavy drinking were higher than that in individuals with other preferred beverages. Among those with spirits as their preferred beverage, the proportion of former drinkers and unstable non-drinkers were higher compared to those with beer and wine as preferred beverages. Tables S6–S8 show the distribution of individual predictors across alcohol intake level at baseline as well as across the trajectories of alcohol consumption and types of beverages.
Alcohol consumption trajectories among the study participants aged 25 years and above at baseline with information on alcohol consumption available from three Stockholm Public Health Cohort surveys (2002–2010–2014) by gender, age groups, and main beverage types.
Note. p values for chi-squared2 test across all alcohol consumption trajectories (p < .001 for all tests). NA = not applicable.
Individuals with no clear pattern in preferred beverage type constitute two categories of respondents (n = 1930): (1) “Other” (n = 1068), which includes individuals with preferred beverage not defined since they either reported different beverages as “most consumed” in each survey or if they mainly consumed alcopops/cider in 2006 and 2010, and (2) “Not established” (n = 862), which includes individuals who are stable non-drinkers.
Association between alcohol consumption trajectories and individual predictors
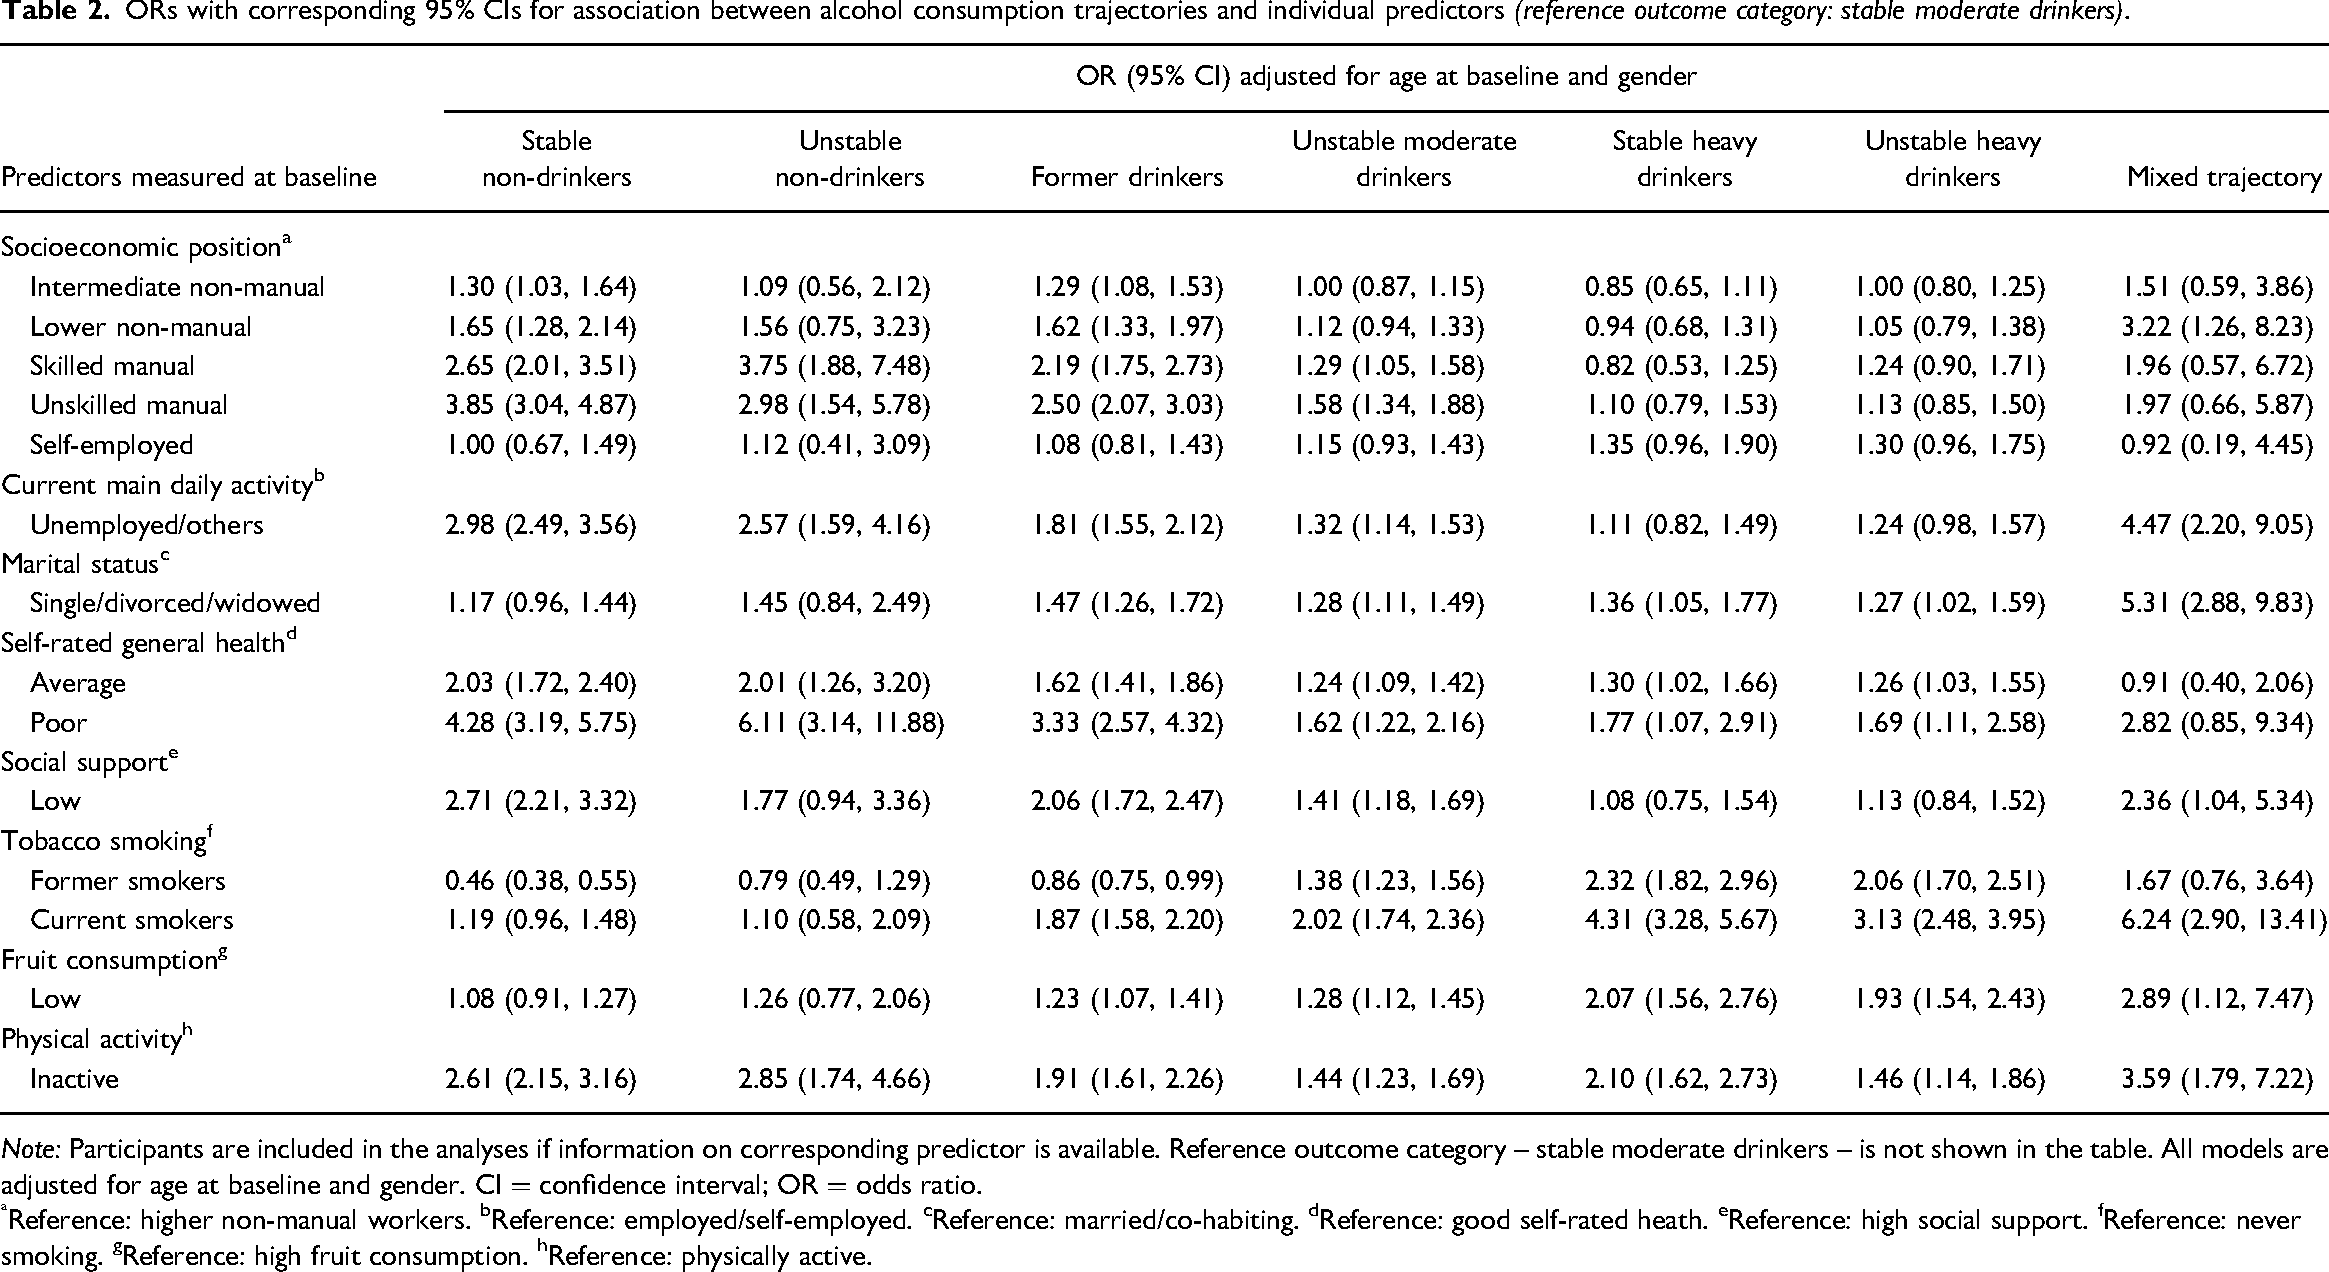
Table 2 reports associations between the predictors and all distinct trajectories of alcohol consumption, compared to the stable moderate drinking trajectory (the reference trajectory). For the stable and unstable non-drinking trajectories, the significant associations were found with a wide spectrum of individual characteristics reported at baseline, including poorer self-rated health, lower social support, unemployment/other current main daily activity and physical inactivity. In addition, unstable non-drinking was associated with manual SEP. Stable and unstable heavy drinking trajectories were associated with a higher likelihood of poor self-rated health and several determinants of unhealthy lifestyle, such as physical inactivity, low fruit consumption and current smoking. The corresponding analyses for the unstable moderate drinking trajectory revealed significant associations with poorer self-rated health, lower social support, unemployment/other type of current activity, manual SEP and current smoking. Finally, the former drinking trajectory membership appeared to be associated with poorer self-rated health, lower social support, unemployment/other current main daily activity, physical inactivity and current smoking, as reported at baseline. The results reported for mixed trajectory, although with several associations, should be interpreted with caution as the analysis was underpowered.
ORs with corresponding 95% CIs for association between alcohol consumption trajectories and individual predictors (reference outcome category: stable moderate drinkers).
Note: Participants are included in the analyses if information on corresponding predictor is available. Reference outcome category – stable moderate drinkers – is not shown in the table. All models are adjusted for age at baseline and gender. CI = confidence interval; OR = odds ratio.
Reference: higher non-manual workers. bReference: employed/self-employed. cReference: married/co-habiting. dReference: good self-rated heath. eReference: high social support. fReference: never smoking. gReference: high fruit consumption. hReference: physically active.
Association between beverage-specific trajectories and individual predictors
Table 3 shows the associations of interest for beverage-specific alcohol consumption trajectories with wine and beer as preferred beverages (spirits-specific trajectories were not reported due to underpowered analyses). Interestingly, for individuals with former drinking trajectories, the associations with baseline predictors did not differ much among those with wine or beer as preferred beverages, if compared to stable moderate drinking of corresponding beverages. Thus, regardless of the preferred beverage, former drinking was consistently strongly associated with unemployment/other type of current activity, average or low self-rated health, low social support and unhealthy lifestyle (particularly regarding current smoking and physical inactivity). The only difference by beverage type in the predictors of the former drinking trajectory appeared for having a marital status as single, divorced or widowed, which was significantly associated with former drinking of wine, but not associated with former drinking of beer. It is worth mentioning that lower SEP (as skilled and unskilled manual SEP) was associated with former drinking of beer, while all levels of SEP, including non-manual, revealed associations with former drinking of wine.
ORs with corresponding 95% CIs for association between beverage-specific alcohol consumption trajectories and individual predictors (reference outcome category for wine- and beer-specific trajectories: stable moderate drinkers of corresponding beverages).
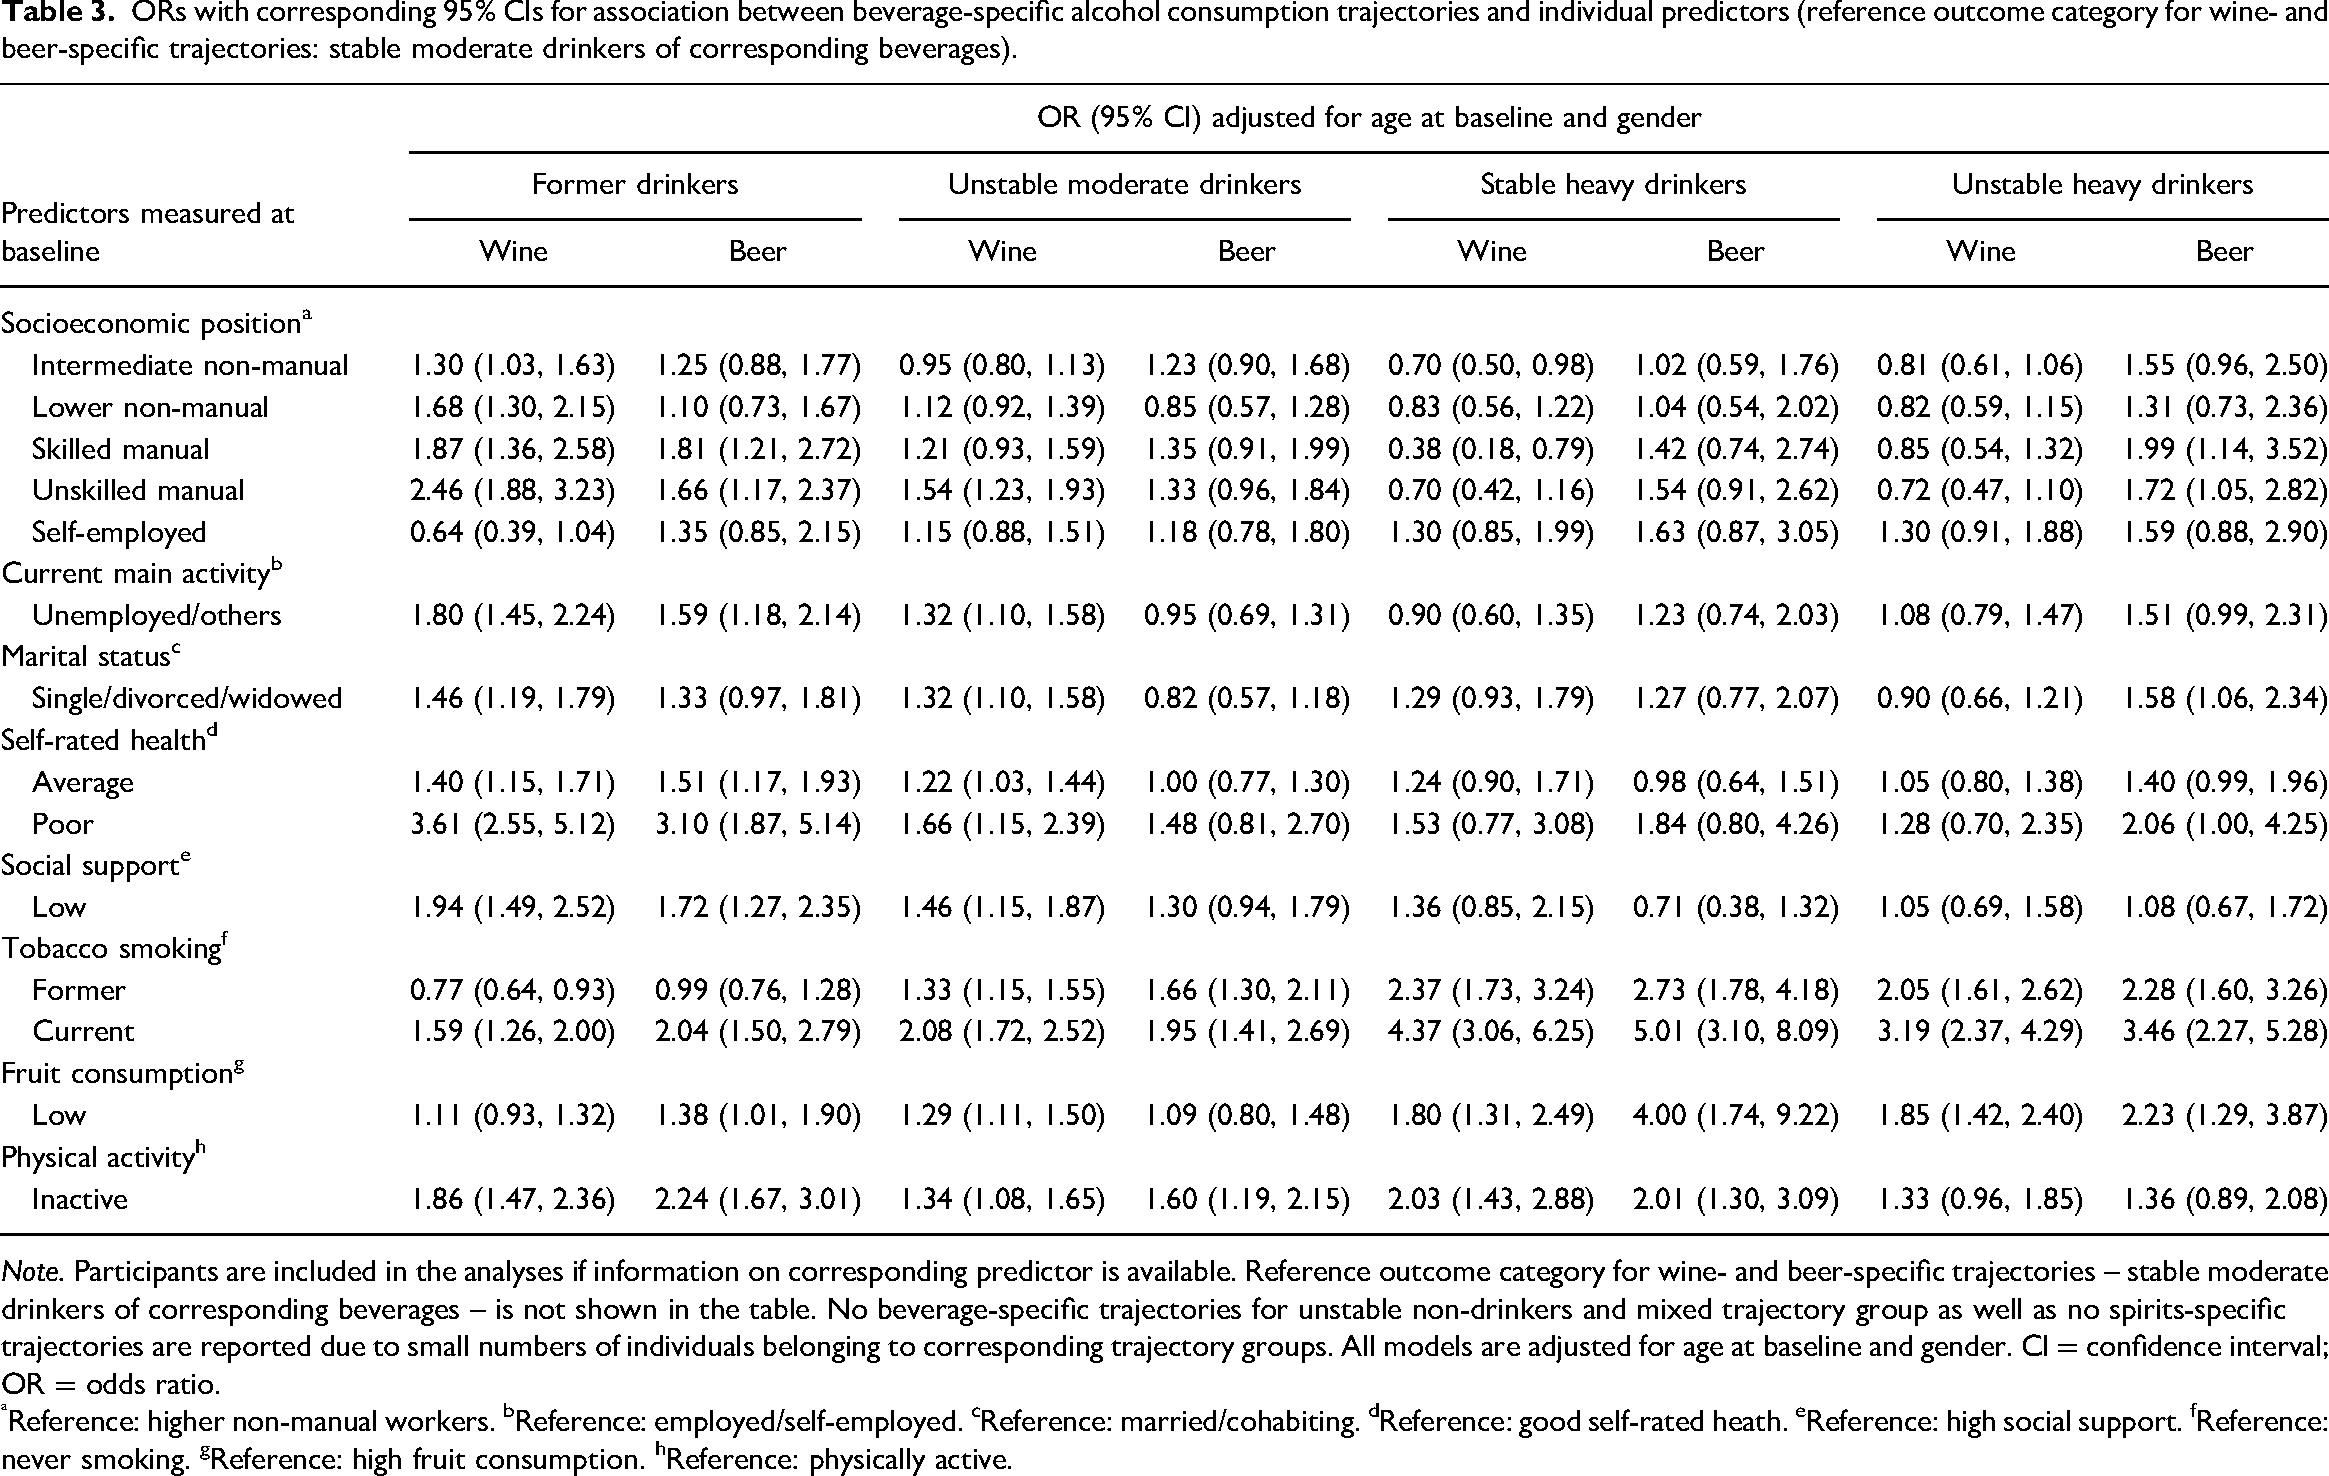
Note. Participants are included in the analyses if information on corresponding predictor is available. Reference outcome category for wine- and beer-specific trajectories – stable moderate drinkers of corresponding beverages – is not shown in the table. No beverage-specific trajectories for unstable non-drinkers and mixed trajectory group as well as no spirits-specific trajectories are reported due to small numbers of individuals belonging to corresponding trajectory groups. All models are adjusted for age at baseline and gender. CI = confidence interval; OR = odds ratio.
Reference: higher non-manual workers. bReference: employed/self-employed. cReference: married/cohabiting. dReference: good self-rated heath. eReference: high social support. fReference: never smoking. gReference: high fruit consumption. hReference: physically active.
Likewise, for stable heavy drinking of wine or beer – if compared to stable moderate drinking of corresponding beverages – the associations with any predictors did not differ much regarding the preferred beverage type. It might be interesting to mention that intermediate non-manual SEP and skilled manual SEP were both inversely associated with stable heavy drinking of wine with no such associations seen in stable heavy drinking of beer.
For individuals with unstable moderate drinking and unstable heavy drinking trajectories, the associations between the predictors and trajectory membership appeared to differ by preferred beverage type when compared with the stable moderate drinking of corresponding beverages. Thus, unstable moderate drinking of wine was associated with unskilled manual SEP, unemployment/other type of current activity, single, divorced or widowed marital status, average or poor self-rated health, and low social support, while no such factors were associated with unstable moderate drinking of beer. In contrast, manual SEP and single, divorced or widowed marital status were associated with unstable heavy drinking of beer, but not wine. Finally, the associations of lifestyle factors with unstable moderate drinking trajectories and stable and unstable heavy drinking trajectories were similar among those with wine as the preferred beverage type and those with beer as a preferred beverage (apart from low consumption of fruit that was associated only with unstable moderate drinking of wine).
Discussion
In this population-based cohort study with 12 years of follow-up, we not only investigated whether trajectories of alcohol consumption over time differ according to beverage types, but also examined the predictors of distinct beverage-specific trajectories. Our findings pointed towards three main issues. First, out of the preferred types of beverage, wine was the most common followed by beer and spirits. Stable moderate drinking prevailed over other trajectories of alcohol intake regardless of age, gender or beverage type. The proportions of former drinking and unstable non-drinking were higher among individuals with spirits as a preferred beverage type compared to the corresponding proportions among those with beer and wine as preferred beverages; whereas stable and unstable heavy drinking trajectories were more prevalent in individuals with beer as a preferred beverage type compared to that in individuals with spirits and wine as preferred beverages. Second, stable moderate drinking was associated with good self-rated health and healthy lifestyle behaviours at baseline, while other trajectories were mainly associated with poorer self-rated health, lower social support, lower SEP and unhealthy lifestyle. Third, the associations between baseline measures of lifestyle factors and alcohol consumption trajectories were similar in individuals with wine and beer as their preferred beverage types; while there were some differences in associations of beverage-specific drinking trajectories with socioeconomic factors and self-rated health. This was particularly notable for unstable moderate drinking (where lower SEP, low social support and poor health were associated with such a trajectory if wine was the preferred beverage) and for unstable heavy drinking (where the same predictors were associated with beer as the preferred beverage).
Our identification of stable moderate alcohol consumption as the most prevalent drinking pattern was in line with prior research on alcohol consumption trajectories (Böckerman et al., 2017; Britton et al., 2016; Kerr et al., 2002; O’Neill et al., 2017; Tran et al., 2015), with relatively small shares of heavy drinking and lifetime abstaining in Sweden (Guttormsson, 2019; WHO, 2018). These relatively stable trajectories might be due to the fact that most changes in drinking patterns typically appear in late adolescence/young adulthood and in advanced age (Knott et al., 2018), while 71.2% of our participants were aged 35–64 years at enrolment. Prior studies also reported a U-shape association of alcohol consumption trajectories with socioeconomic and lifestyle determinants, indicating stable low and/or moderate alcohol consumption to be associated with most favourable socioeconomic circumstances (Fuehrlein et al., 2018; Mugavin et al., 2020; Platt et al., 2010; Tran et al., 2015) as well as with a healthier lifestyle (Britton et al., 2016). Our results on the associations of predictors with overall drinking trajectories (i.e., when preferred beverages were not considered) generally resonate with such findings showing a U-shape association for self-rated general health and physical activity. For current smoking and low consumption of fruit, the associations were more of a J-shape as these factors were strongly related to former drinking, unstable moderate drinking and heavy drinking (in particular, to stable heavy drinking), but not to non-drinking trajectories. For the rest of the predictors, the shape of association was less consistent, although the strongest associations of manual SEP and lack of employment were noted with stable and unstable non-drinking trajectories.
A review by Mäkelä et al. (2011) raised a question as to whether alcohol-induced harm can be affected by altering the beverage choice of the population. The review proposed a conceptual model where choice of beverage type was suggested to originate from alcohol policy (e.g., through pricing, availability and alternatives) as well as from individual demographic and socioeconomic properties, with the latter to affect the choice of beverage through personal needs and preferences, purpose of drinking and nature of drinking situation. The effective alcohol prevention policies need clear understanding on whether alcohol-related harm depends on beverage-specific harmful effect per litre of ethanol, or if the beverage choice affects the quantity of consumed alcohol or, in addition, if different groups of drinkers prefer different beverages (Makela et al., 2011). In our study, while wine is overall the most preferred beverage type, the proportion of stable heavy drinkers is higher among those with beer as their preferred beverage than that in individuals with wine and spirits preferences (the same is true for unstable heavy drinkers). These observations are important since prior research indicated beer to be more strongly associated with binge drinking and underage drinking compared to other beverages as well as that there is generally low risk perception and mostly positive expectations of the effect of beer (and wine) consumption (Ramstedt & Boman, 2011; Rogers & Greenfield, 1999).
All in all, to ensure that alcohol policies are well targeted, it is important to identify the attributes of beverage-specific alcohol consumption trajectories. It has been suggested that drinking patterns influence the choice of beverage rather than the other way around (Makela et al., 2011). In our study, we found an association between SEP and beverage-specific drinking trajectories, with more prevalent beer consumption among heavy drinkers. These findings suggest that the preferred consumed beverages might be important when developing targeted alcohol prevention strategies.
Limitations and strengths
Several limitations that are inherent for surveys and alcohol research should be acknowledged. First, alcohol consumption was self-assessed, which might result in underreporting of intake, especially among heavy drinkers. Yet, if some individuals with heavy alcohol consumption were misclassified into the moderate consumption group, it might reduce the “true” association of predictors with stable and unstable heavy drinking trajectories. Furthermore, underreporting of intake might also differ by SEP (Devaux & Sassi, 2016; Livingston & Callinan, 2015) and by specific beverage types as, for example, beer consumption was shown to be more likely a subject for underreporting than the consumption of wine or spirits, which, in contrast, were shown to be overreported (Stockwell et al., 2008). It is worth mentioning that social gradients may exist within each beverage type among the consumers. Our broadly defined categories of beverages – as wine, beer and spirits – are rather heterogeneous, and each may represent a diversity of types of drinks varying by price, quality level, perceived prestige, etc., which, in its turn, all considerably correlate with SEP. Due to the risk of having underpowered statistical analyses, our data precluded us from subdividing the three major beverage types into more specific subtypes, which would be less heterogeneous with respect to the features of included types of drinks. Future studies should look within the broad categories of beverages to find more detailed and more specific patterns of beverage-specific consumption. Second, non-participation in the SPHC and selection bias due to loss to follow-up should be considered. As described elsewhere (Svensson et al., 2013), non-participants in the SPHC baseline survey in 2002 were more likely men, aged below 45 years and with lower SEP, which may limit generalisability. Importantly, a study on the SPHC response rate and pre-baseline alcohol-related hospitalisation (Ahacic et al., 2013) indicated that non-participation among individuals with presumably heavy alcohol intake (based on hospitalisation records) had only a small effect on the estimated prevalence of heavy alcohol consumption and abstinence. Regarding the loss to follow-up, in our study individuals with baseline moderate and heavy alcohol consumption had similar drop-out rates, while the highest proportions of dropouts appeared in men, non-drinkers at baseline, individuals with lower SEP and those with an unhealthy lifestyle (Table S2). This might lead to an underestimation of observed association, particularly for the trajectories where non-drinking was as an option for baseline consumption. Third, the study defined a “preferred beverage” as a type of beverage that was reported to be consumed most at each measurement point and across all surveys (Table S4). This does not rule out the fact that the respondents perhaps consumed other beverages, but at lower amounts, and beverage-specific trajectories should not be considered as homogeneous with exclusive consumption of wine, beer or spirits. Fourth, underpowered analysis precluded determining associations of interest among individuals with drinking pattern defined as mixed trajectories as well as for those with spirits as a preferred beverage type. Fifth, drinking trajectories (other than stable non-drinking, stable moderate drinking and stable heavy drinking) were each constructed by grouping certain distinct patterns of drinking and thus may suffer from heterogeneity. The size of the analytical sample precluded us from further detailing the patterns of drinking within the trajectories with “unstable” drinking and formal drinking. Sixth, a common limitation for surveys on alcohol consumption is also a possible heterogeneity within stable non-drinking trajectories as they may include individuals with heavy alcohol intake in the past and “sick-quitting” prior to baseline (Ng Fat et al., 2014). Seventh, we used a relatively higher upper limit when defining moderate alcohol consumption (as ≤168 g 100% ethanol per week for women and 252 g 100% ethanol per week for men). These cut-offs were chosen to ensure comparability to previous research on the levels of alcohol consumption, where moderate drinking was defined in a similar manner (Holmes et al., 2014; Landberg & Ramstedt, 2021; Leifman et al., 1995; Roerecke & Rehm, 2014; Shield et al., 2017; Smyth et al., 2015). Finally, the study utilised data from the SPHC survey up to 2014; therefore, caution is needed to generalise our results to more recent time periods. However, according to the reports from the Swedish Council for Information on Alcohol and Other Drugs (Trolldal, 2020; Trolldal & Åström, 2021), the levels of beverage-specific alcohol consumption observed in Sweden during the time as our study period (i.e., 2002–2014) and after 2014 either kept the same direction of changes or were relatively stable in recent years, which reassures our findings to be indicative for common beverage-specific trajectories of alcohol consumption in Sweden and their predictors.
The strengths of the study include a large population-based sample and comprehensive collection of repeatedly measured data on alcohol consumptions with a particular emphasis on beverage types. Data were prospectively collected using the same methodology as well as the standardised, validated questions and response options on alcohol consumption (Ekholm et al., 2008; Romelsjo et al., 1995), which ensures reliability of information on alcohol intake and allows establishing distinct types of longitudinal beverage-specific alcohol consumption trajectories. Furthermore, capitalising on the use of various self-reported individual characteristics provides an opportunity for extending the set of predictors to the ones commonly unavailable in register-based research.
Conclusion
We found that stable moderate drinking is most common trajectory of alcohol consumption in Sweden regardless of the beverage consumed. Stable and unstable heavy drinking is relatively rare; however, the proportions of such drinking trajectories among those who mainly consume beer are higher than among those who consume spirits and wine. We found no evidence of associations between lifestyle and beverage-specific drinking trajectories. However, lower SEP was a strong predictor of unstable moderate drinking of wine, former drinking of beer and, in particular, unstable heavy drinking of beer. In light of known social inequalities in alcohol-related harm, the different beverage preferences among heavy drinkers suggest that beverage choice must be taken into consideration when targeting alcohol prevention programmes to the groups with hazardous drinking. Further research should also focus on gaining knowledge on whether and how changes over time in socioeconomic, lifestyle and health-related characteristics of individuals may modify their beverage choices and drinking patterns to identify those at risk of developing problem drinking behaviour.
Supplemental Material
sj-docx-1-nad-10.1177_14550725221124386 - Supplemental material for Predictors of beverage-specific, alcohol consumption trajectories: A Swedish population-based cohort study
Supplemental material, sj-docx-1-nad-10.1177_14550725221124386 for Predictors of beverage-specific, alcohol consumption trajectories: A Swedish population-based cohort study by Anna Sidorchuk, Karin Engström, Jette Möller and Katalin Gémes in Nordic Studies on Alcohol and Drugs
Footnotes
Declaration of conflicting interests
The authors declared no potential conflicts of interest with respect to the research, authorship, and/or publication of this article.
Funding
The authors disclosed receipt of the following financial support for the research, authorship, and/or publication of this article: This work was supported by the Dutch Beer Institute (grant No. 2018 to KG), SRA Systembolagets råd för alkoholforskning (grant No. 2016-0097 to AS) and by the ERAB: The European Foundation for Alcohol Research (grant No. EA 16-45). The funders had no role in the design and conduct of the study; collection, management, analysis and interpretation of the data; preparation, review, or approval of the manuscript; and decision to submit the manuscript for publication.
Supplemental material
Supplemental material for this article is available online.
References
Supplementary Material
Please find the following supplemental material available below.
For Open Access articles published under a Creative Commons License, all supplemental material carries the same license as the article it is associated with.
For non-Open Access articles published, all supplemental material carries a non-exclusive license, and permission requests for re-use of supplemental material or any part of supplemental material shall be sent directly to the copyright owner as specified in the copyright notice associated with the article.