
Abstract
This paper optimizes the aerodynamic performance of quadcopter UAVs by varying the cross-section shape of the fuselage arm. In detail, a testing stand is set up to measure simultaneously the lift force as well as the input electric power. The tested quadcopter UAV has replaceable fuselage arms, allowing convenient testing for different arm cross-sections fabricated by 3D printing. The optimization process starts from a comparison between two basic cross-section shapes: circular arm and square arm. Results show that the square arm has an overall lift-to-power ratio 2.41% higher than the circular arm with the same weight. Then, by inclining and setting up curves on the side surfaces of a square arm, the optimized rhombus + 15°+arc2 arm is proposed to have an overall 3.68% increment in lift-to-power ratio and 5.77% increment in Figure of Merit (FM) as compared to the circular arm.
Introduction
The low-altitude economy (LAE) is a rapidly evolving sector that encompasses various activities such as urban air mobility, cargo logistics, agricultural spraying and industrial surveillance. Projecting a trillion-dollar market, leading economies such as the United States, Europe and China are embracing the low-attitude economy with governmental supports and technologies.
Multi-rotor Unmanned Aerial Vehicles (UAV) or drones, with a compound annual growth rate of 7.1% from 2023 to 2030 in market size, 1 are key component in the applications of the LAE. Since the customers are highly sensitive to the flight time, every additional minute in the maximum flight time significantly enhances a UAV's commercial value. To extend the flight time of UAVs, researchers and designers have conducted studies from multiple perspectives, including the improvement of aerodynamic performance,2–4 the adoption of semi-solid battery with higher energy density5–7 and the transition to hybrid propulsion systems.8,9
In terms of aerodynamic performance improvement, existing research directions includes propeller shape optimization, ducted configuration, coaxial contra-rotating propeller etc. The optimization of propeller shape accounts for a significant proportion in the literature. Bohorquez et al.10,11 experimentally visualized the flow around the propeller blade and found that the low Figure of Merit (FM) of the rotor is due to a large fraction of separated flow on the blade surface. Sun et al. 12 compared a twisted blade with an untwisted one and showed that the twisted blade had a 9.6% higher FM value in the experiment due to lower trailing edge vortices. Inspired by the cicada wing and maple seed, Ning et al. 4 investigated a biomorphic propeller experimentally. The measurements showed that the bio-inspired propeller could reach a thrust coefficient 10% higher than the baseline propeller. Given the multitude of influencing factors considered in the blade design process, some researchers13–15 applied genetic algorithm and machine-learning method to optimize the shape of the rotor propeller. Either significant improvement of thrust coefficient or significant decrease in power consumption were achieved. Instead of working on the propeller blade shape, some researchers explored the feasibility and applicability of ducted propeller and coaxial contra-rotating propeller on UAVs. Li et al. 16 and Wei et al. 17 emphasized the critical role the blade tip gap played in influencing the lift force production. Usually, the tip gap should not exceed 3% of the duct radius to maintain a superior aerodynamic performance. Mckay et al. 18 pointed out that contra-rotating propeller could increase the efficiency which makes it more suitable for large scale UAVs. The downside of it is the loudness of the aeroacoustic noise. Jayakumar et al. 19 combined the contra-rotor propulsion system with the duct configuration to design and test a high-altitude surveillance drone. The results showed significant increase in the outlet velocities.
With a considerable number of studies focusing on the propeller, few if any work is reported to study the influence of the fuselage arms on the aerodynamic performance of UAVs. However, the presence of the fuselage arm would bring about loss in the propeller's lift force. In Yoon et al.'s 20 simulation study, when the propellers are under-mounted and are placed sufficiently far from the fuselage arms, the drag force due to the fuselage arms becomes much smaller than the traditional over-mounted configuration. In Liu et al.'s study, 21 the lift force of an isolated propeller and that of a propeller with a circular fuselage arm are compared. The comparison shows that the isolated propeller has an increase lift force by 8.12% to 16.2% (depending on rpm) over the propeller with fuselage arm case.
With the above observations, it is natural to raise the following question: is it possible to optimize the shape of the fuselage arm so that it has a lower drag coefficient? In a previous simulation study, 21 Liu et al. found that the shape of the fuselage arm cross-section influences the lift force of the propeller. With the same cross-section area, the square fuselage arm has a higher lift force over the circular fuselage arm by 0.25% to 2.25% depending on the rotating speed. Liu et al. also found that neither elliptical nor slitted fuselage arm could provide less drag force. This indicates that the flow around the fuselage arm is time-varying both in flow direction and amplitude. Therefore, drag reduction techniques for uniform steady income flow problems, like slitting on the arm 22 or airfoil-like shape, 23 are not quite suitable.
This paper comes after our previous study. 21 In this paper, with the rotor-stator interaction mechanism in mind, the cross-section shape of the fuselage arm is optimized step-by-step in an experimentally way. In detail, an experimental platform that could measure the lift force and the input electric power of a quadcopter UAV is established. The arms of the UAV are designed with CAD software and fabricated using 3D printing. By varying the cross-section shapes of the fuselage arms, the FM are recorded and compared to yield an optimized configuration. To make the comparison fair, the weights of the arms are kept the same. Finally, potential mechanism to reduce arm drag force or to promote UAV's lift force is proposed based on the measured results.
Experimental setup
UAV with replaceable arms
The structure of the tested quadcopter UAV is illustrated in Figure 1. The tested UAV is composed of the body frame, the flight control board, 1 voltage¤t meter, 1 battery and 2 pairs of fuselage arms, electric motors and propellers. The voltage meter and the current meter are used to measure the input electric power from the battery to the flight control board. The fuselage arms of the UAV are replaceable to facilitate the tests on the arm cross-section shape. Detailed descriptions of the UAV's structural components are provided in Table 1.
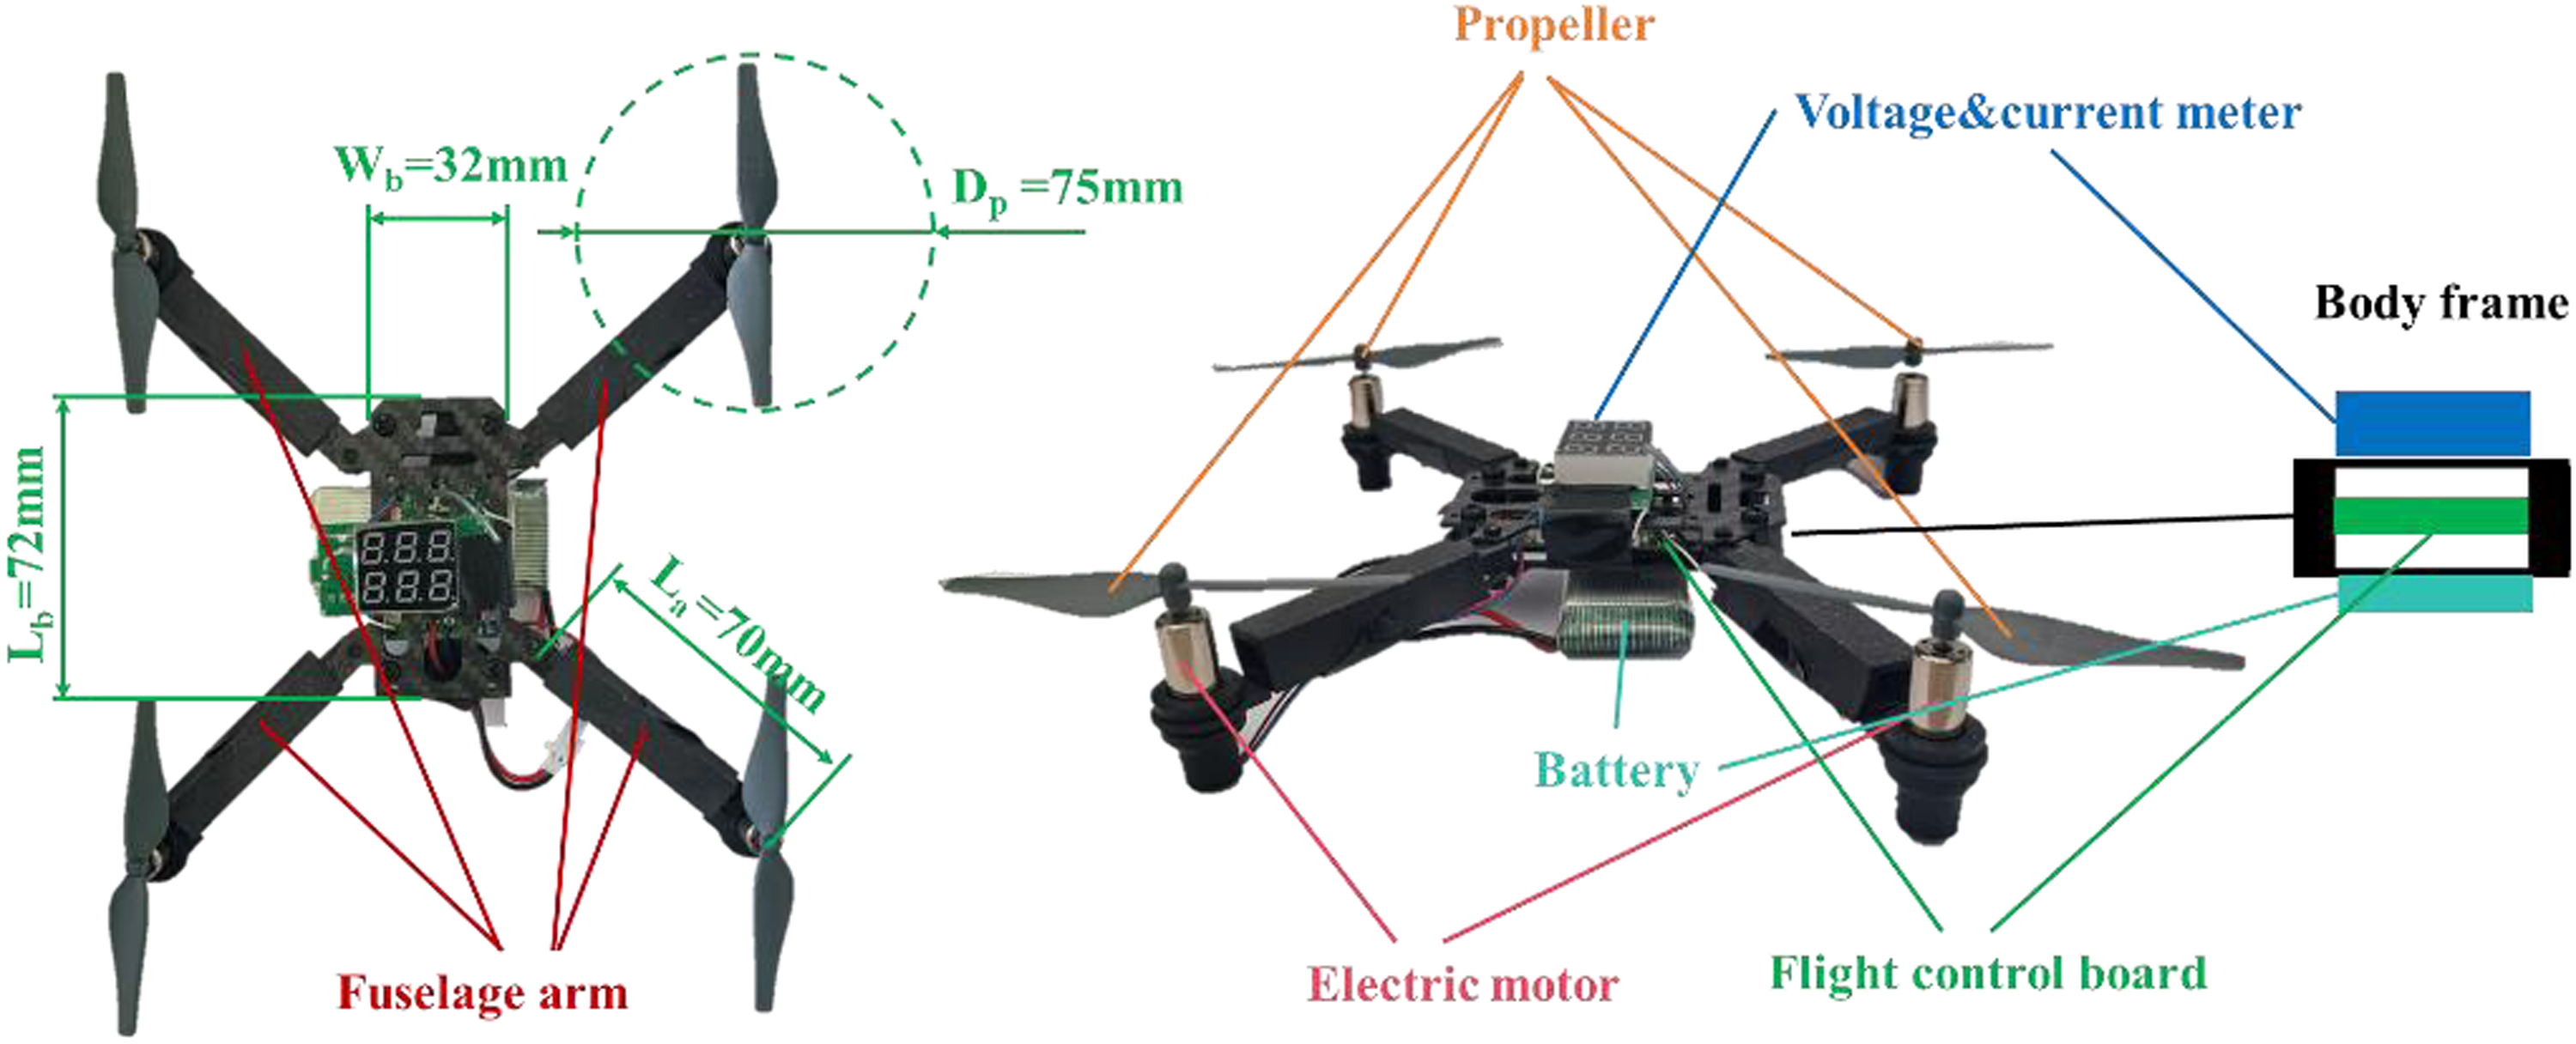
Structural diagram of the tested quadcopter UAV.
Descriptions and parameters of the UAV's structural components.

Lift force measurement stand
To measure the lift force of the tested UAV in hover state, a vertical measurement stand is established as is shown in Figure 2. The height of the frame-type support is H = 1500 mm,24,25 which is kept large to reduce the effect of ground on the measuring accuracy of the lift force. An electronic scale is set underneath the supporting frame to measure the lift force. The scale's accuracy is 0.1 g.

Diagram of the lift force measurement stand.
To estimate the aerodynamic performance of the tested quadcopter UAV, the Figure of Merit is employed. According to Bohorquez et al.,
10
the FM is defined as: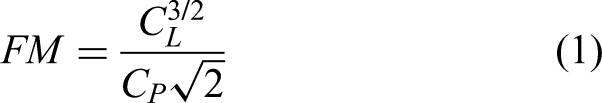
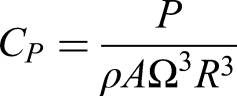
The lift coefficient CL and the power coefficient CP are defined as:
Fuselage arm with different cross-sections
In this paper, a total of 5 cross-section shapes are tested as shown in Figure 3, they are: square (#1), circle (#2), rhombus + 15°(#3), rhombus + 15°+arc1 (#4) and rhombus + 15°+arc2 (#5). These 5 shapes were proposed sequentially during course of the study. In the beginning, the square arm (#1) and circle arm (#2) were tested as a starting point of the optimization process. Then, subsequent arm shapes (#3 to #5) were proposed and compared with the square case and circle case.
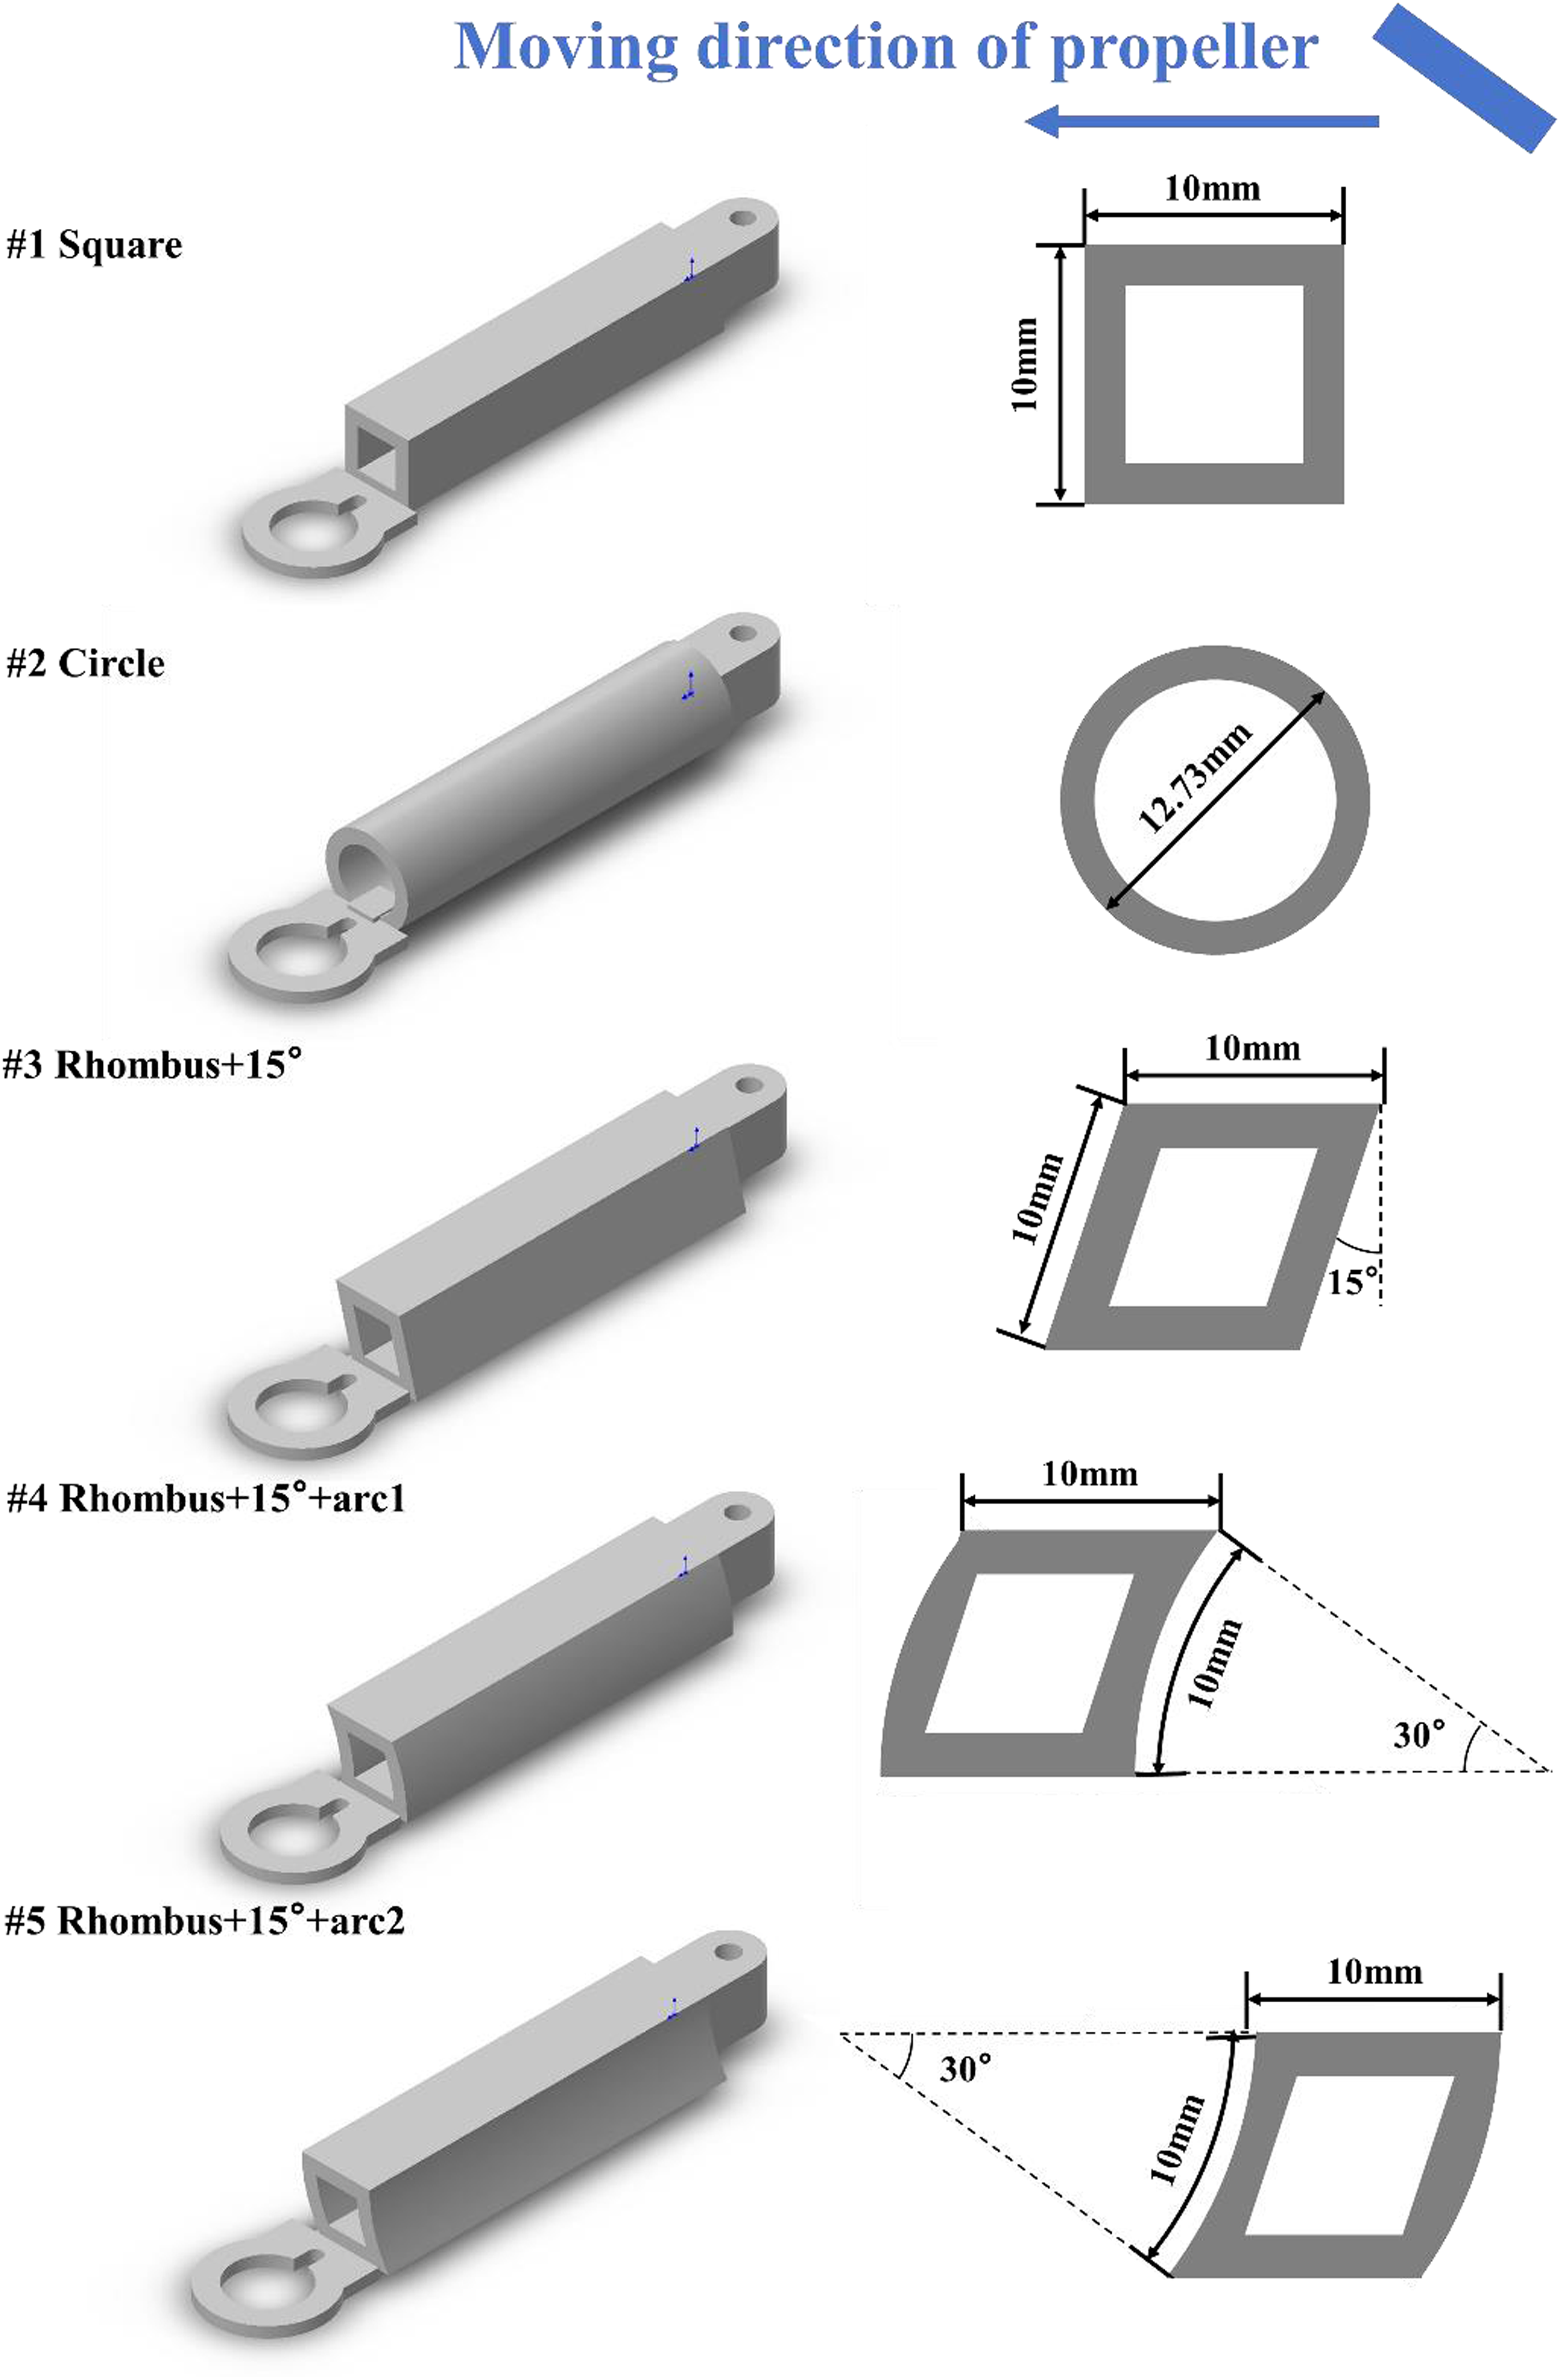
Tested cross-section shapes of fuselage arm.
To make the comparison fair, all the 5 fuselage arms have the same weight. Considering that the structure of the fuselage arm is usually in the form of thin-wall hollow tube, its weight is proportional to the perimeter of the cross-section. In all the tested cases, the perimeter is set to be 40 mm. The thickness of wall is 2 mm, which is a requirement for structural strength in 3D printing, not considered as a design parameter in this study. Another geometric parameter that might influence the comparison is the distance between the propeller blades and the fuselage arm. In this paper, the centroid of the arm cross-section is set as a fixed position.
Results and analysis
In the experiment, 3 sets of tests were performed on each of the 5 fuselage arms. Within each test set, a number of 20 to 30 sub-measurements were conducted where the state of the battery goes from 100% state of charge (SOC) for the 1st measurement to the cutoff voltage for the last measurement. Each measurement lasted approximately 10 s. The input power and the lift force data were recorded every 0.5 s. Figure 4 shows the measured input power and the lift force during a typical measurement.

Input power and lift force measured during one measurement.
Circular and square fuselage arms
First, the fuselage arms with circle cross-section (#1) and square cross-section (#2) are compared. These two cross-section shapes are two of the most commonly applied shapes in commercial quadcopter UAVs. The results could serve as a starting point for the optimization of the cross-section shape.
Figure 5 plots the measured lift-to-power ratio as a function of the output voltage of the battery. The output voltage of the battery indicates the charge level of the battery. When the battery output voltage is high, the output power from the battery as well as the rotational speed of the propellers are comparatively higher than when the battery voltage is low. From Figure 5 it could be seen that when the battery is close to fully charged (3.8 V to 3.9 V), the lift-to-power ratios of the circle and the square arm are close to each other. As the battery level goes down, the square arm tends to provide a higher lift force with the same input power. By regressing the measured data, it is found that the square arm provides 1.01% higher lift-to-power ratio at a voltage of 3.8 V. At 3.5 V, the lift-to-power ratio for the square arm is 2.64% higher than that for the circle arm.
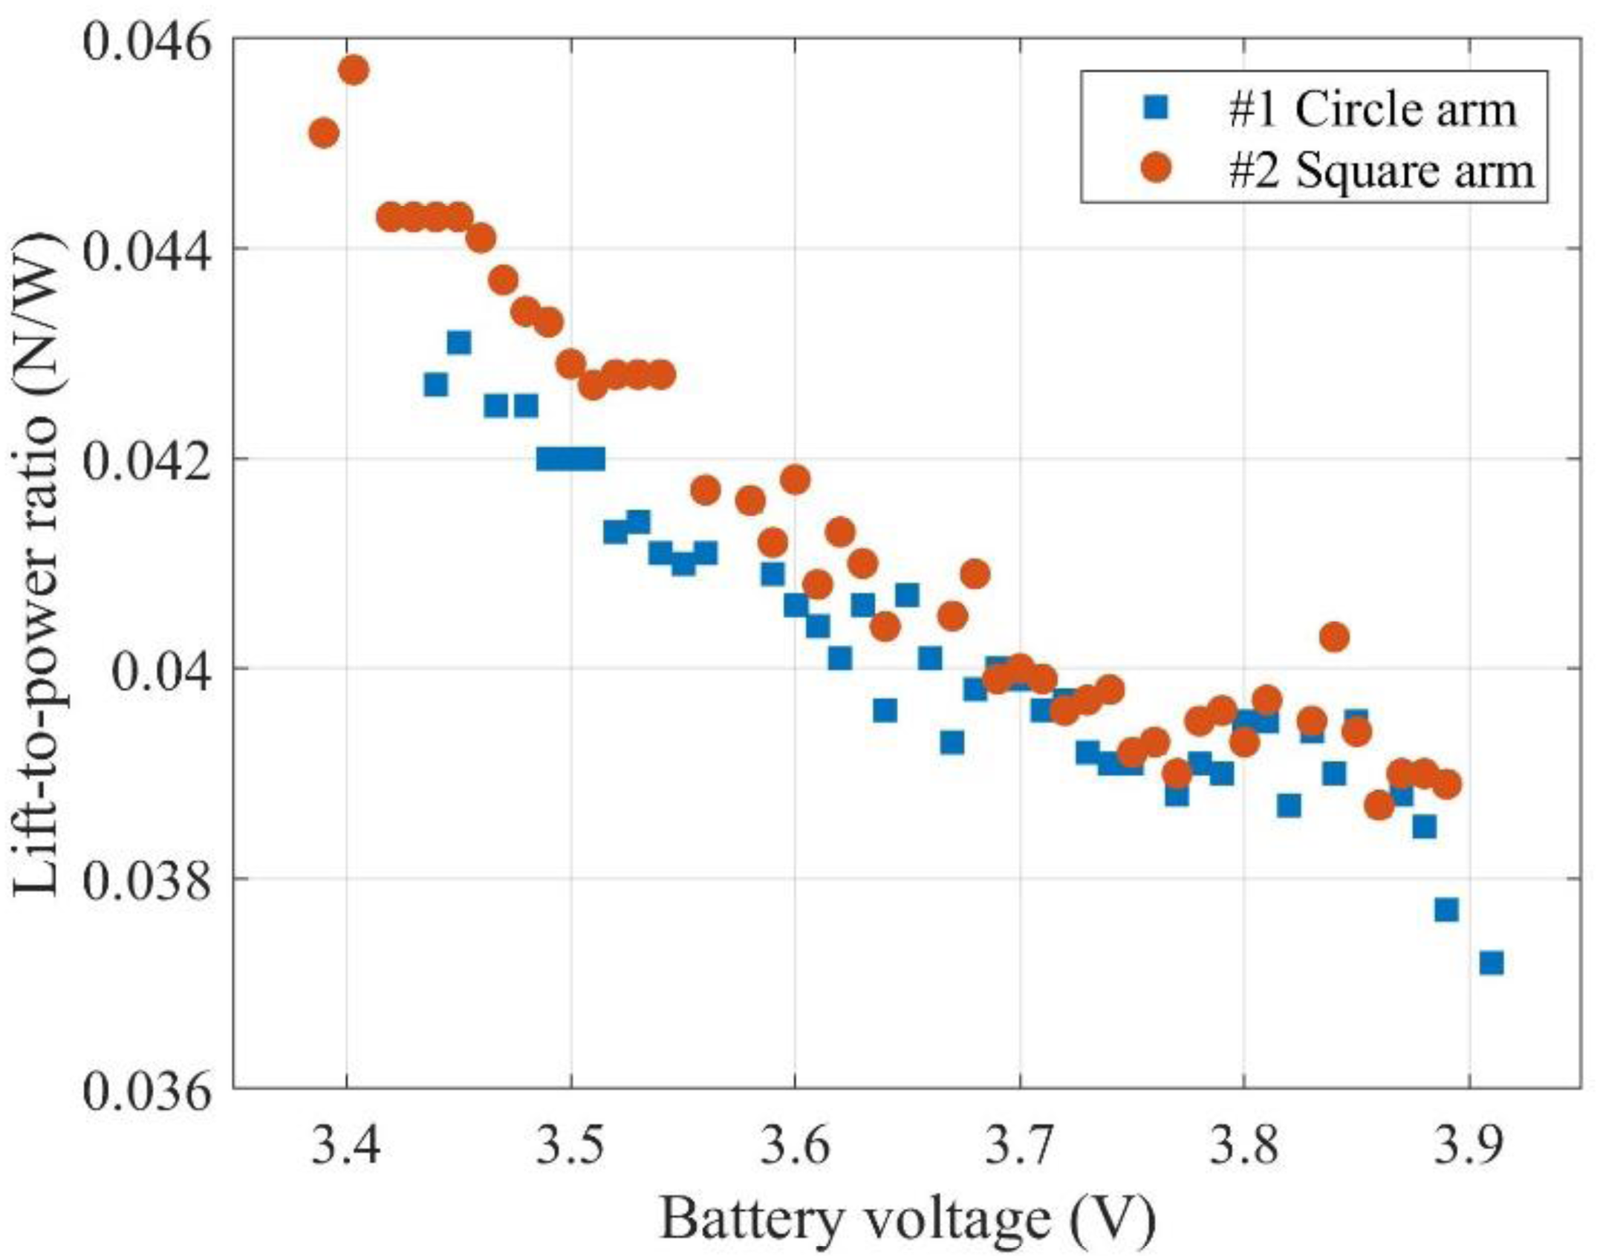
Lift-to-power ratio as a function of battery charge level (output voltage) for circle and square fuselage arms.
Figure 6 plots the FM value as a function of the output voltage of the battery. It could be seen that the square arm has superior FM values within all the tested voltage range. The difference between the behaviors of the lift-to-power curve and the FM curve is in the voltage range higher than 3.7 V. For the lift-to-power ratio curve, the value generally decreases as the battery voltage increases. However, the FM value goes down initially with the battery voltage but turn to go up as the battery voltage goes from 3.7 V to 3.9 V. This is due to a numerical issue in the calculation. In fact, the measured lift forces in the experiment are close to 1 N. When the battery level is high, the measured lift is usually over 1 N. According to the definition of the Figure of Merit in Eq. (1), the 3/2th power for the lift force would amplify the role of the lift force.
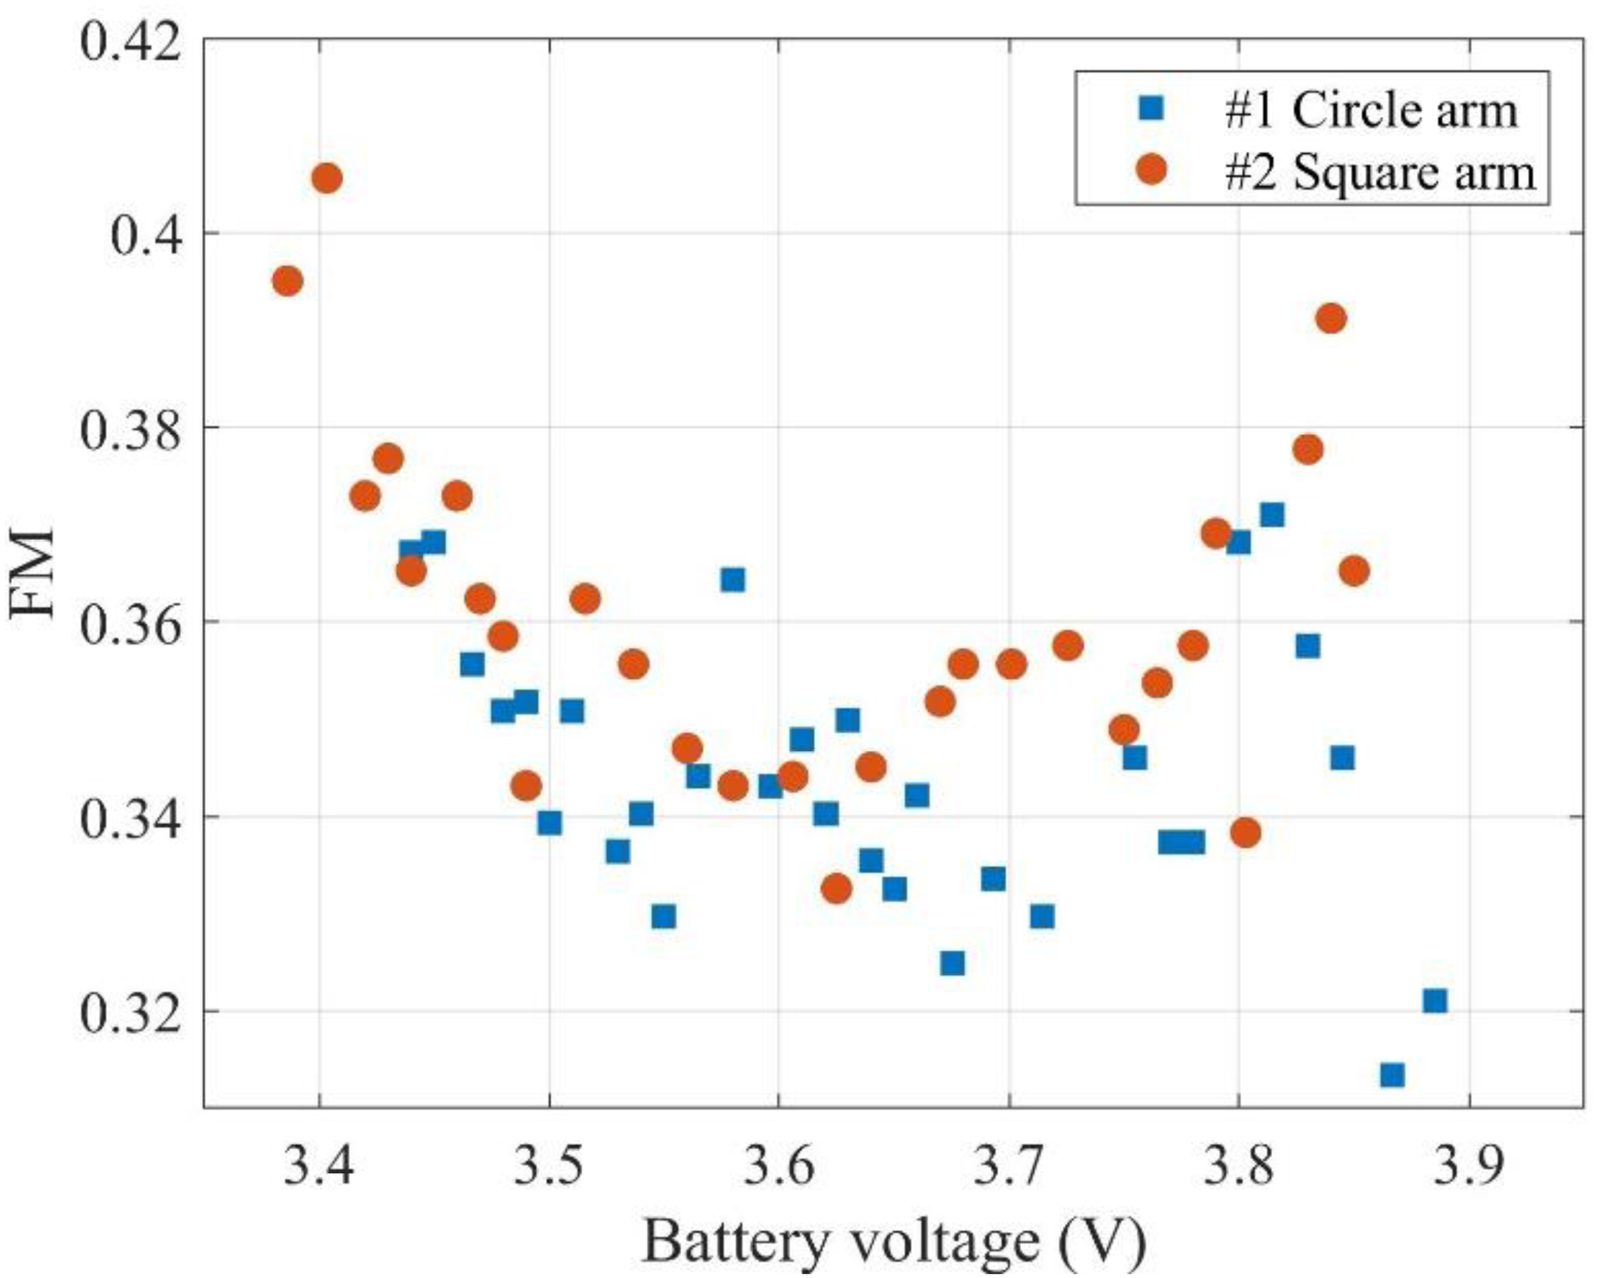
Fm as a function of battery charge level (output voltage) for circle and square fuselage arms 3.2 optimized arm cross-section shapes.
Although the behaviors of the lift-to-power curve and the FM curve are slightly different due to numerical issue, they both indicate that the square arm (#2) has a superior aerodynamic performance over the circle arm (#1). In our previous simulation study, 21 on condition that the cross-section aera are the same, the square arm could provide higher lift force. The advantage of square arm is more obvious (+2.25%) at lower speed of rotation (6000 rpm) than that (0.24%) at higher speed of rotation (12000 rpm). The agreement between the current observations and the previous results demonstrate that the square arm has better aerodynamic performance as compared to the circle arm under functional and practical criteria. Therefore, the square arm is set as the starting point for the optimization process in the next subsection.
The first optimized cross-section shape is the rhombus + 15° case (#3). It is proposed by inclining the vertical surfaces of the square arm by 15°. As is shown in many research2,20,21 in the literature, the velocity flow field of the UAV is not vertically downward, but spirally downward. Therefore, the direction of the flow velocity is inclined as it passes across the fuselage arm. By inclining the vertical surfaces of the square arm, the frontal area could be reduced to reduce the drag force. The angle of inclination is set to be 15°. We have compared three angles of inclination: 0°(square), 15° and 30°. We found that an inclination angle of 30° would result in much inferior results. Therefore, we dropped the 30° case. According to Figure 7, the rhombus + 15° arm (#3) has better lift-to-power ratio than the square arm (#2) in the battery voltage range of 3.4 V to 3.8 V. According to Figure 8, the rhombus + 15° arm (#3) has better FM value than the square arm (#2) in the battery voltage range of 3.45 V to 3.75 V.

Lift-to-power ratio as a function of battery charge level (output voltage).

Fm as a function of battery charge level (output voltage).
The second step we take in the optimization process is to change the inclined flat surfaces in case #3 into inclined arc-curved surfaces. We consider that by changing the flat surfaces into curved surfaces, the area of flow separation could be reduced so that the drag force of the fuselage arm could decrease. Two forms of arc-curved surfaces are proposed as rhombus + 15°+arc1 (#4) and rhombus + 15°+arc2 (#5) as illustrated in Figure 3. The rhombus + 15°+arc1 arm (#4) tends to guide the initially inclined flow into vertically downward direction to promote more lift forces. The rhombus + 15°+arc2 arm (#5) tends to promote the rotational motion of the flow field. According to Figure 7, the rhombus + 15°+arc1 arm (#4) and rhombus + 15°+arc2 arm (#5) performs better than the rhombus + 15° arm (#3) in terms of lift-to-power ratio. The rhombus + 15°+arc1 arm (#4) has the best performance when the battery voltage lower than 3.5 V. The rhombus + 15°+arc2 arm (#5) has the best overall performance in the tested battery range. According to Figure 8, the rhombus + 15°+arc1 arm (#4) has higher FM value than rhombus + 15° arm (#3) in low voltage range. The rhombus + 15°+arc2 arm (#5) has the highest FM value in middle voltage range (3.5 V to 3.75 V).
Discussion on the optimization mechanism
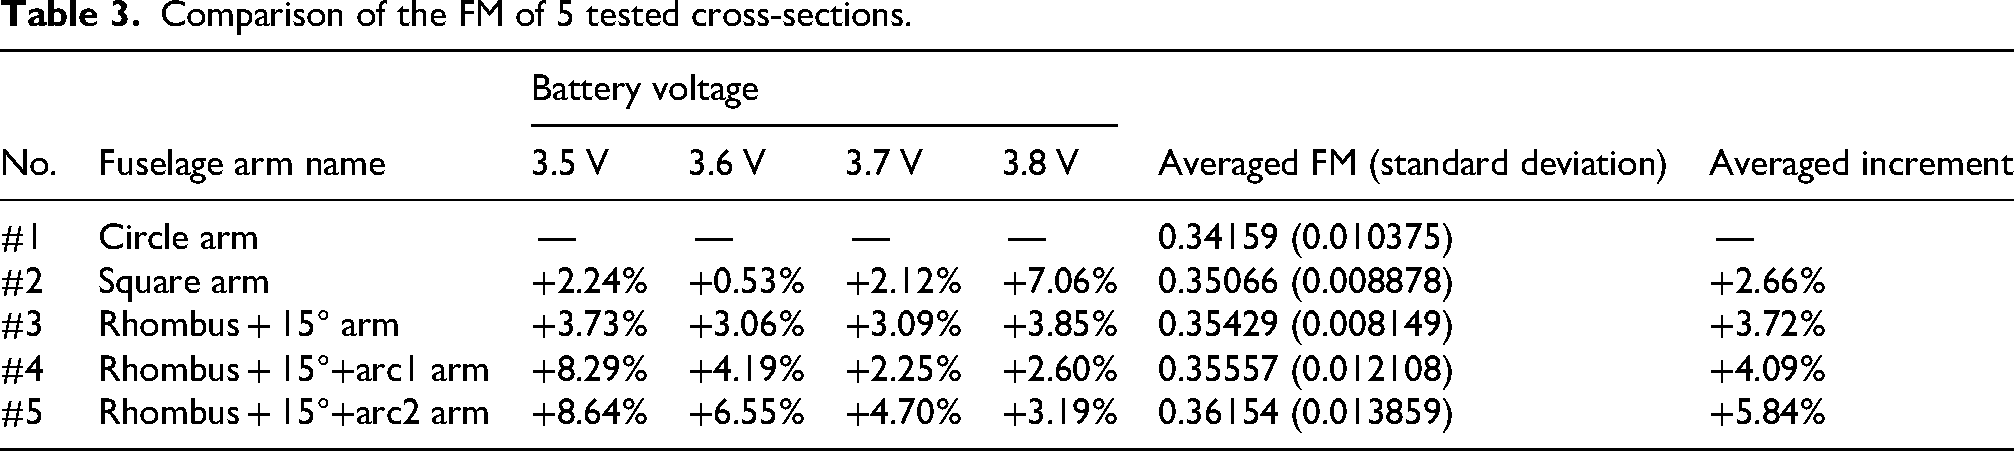
By performing quadratic regression on the measured data for the 5 fuselage arms, the lift-to-power value and the FM value at different battery charge level are obtained and compared one-by-one with the circle arm case (#1) in Table 2 and Table 3. By averaging the aerodynamic performance indicators within the measured voltage range, it could be found that the rhombus + 15°+arc2 arm (#5) has the best lift-to-power and FM values on condition that all the fuselage arm have the same weight.
Comparison of the lift-to-power ratios of 5 tested cross-sections.

Comparison of the FM of 5 tested cross-sections.
The reason that the rhombus + 15°+arc2 arm (#5) could have the best aerodynamic performance is considered three-fold as follows:
Reduced frontal area. Since the flow field of the quadcopter UAV is spirally downward, the direction of the flow is inclined around the fuselage arm as indicated in Figure 9. The rhombus shape in rhombus + 15°+arc2 case (#5) could reduce the frontal area so that the total drag force due to the fuselage arm could decrease. Curved surfaces for less flow separation. The curved side surfaces of the arm are able to reduce the area of flow separation on the arm surface so that the total drag force could decrease. Flat upper surface to create a high-pressure zone. During the aerodynamic performance optimization process, the upper surface of the arm is always kept flat. This is because we believe that reducing the drag force of the arm is only one possible direction for the optimization. Another possible optimization direction is to make use of the fuselage arm to generate more thrust force as the propeller blade passes the arm. By analogy with the rotor-stator interaction in fans and turbines, the upper surface of the fuselage arm is seen as the stator blade. When the propeller blade passes over the fuselage arm, the region between the propeller blade and the upper surface of the arm becomes highly pressured as the propeller blade squeezes the air volume. As a result, the highly pressured air flow would promote the spiral velocity flow downstream to generate more lift force.
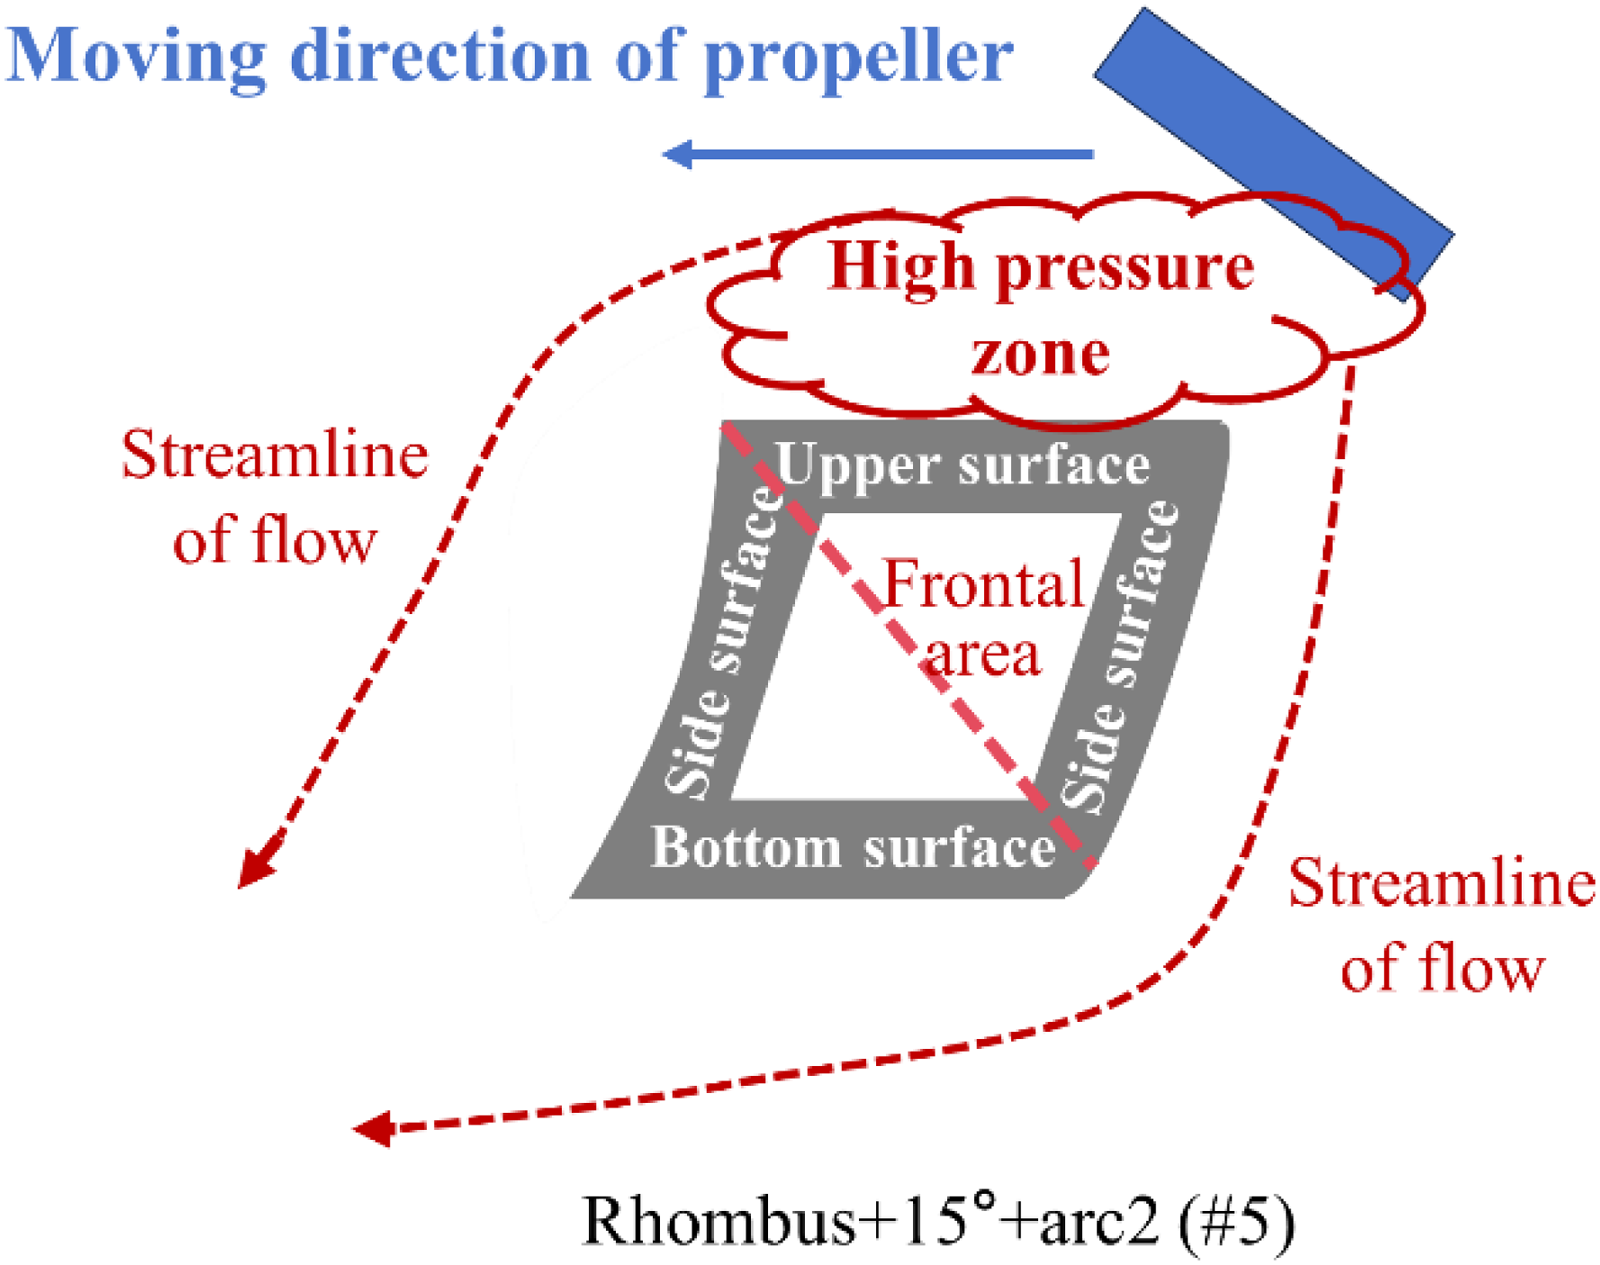
Illustration of the optimization mechanism.
Conclusions
In conclusion, this paper proposes step-by-step an optimal fuselage arm cross-section of quadcopter UAVs that generates higher aerodynamic lift with lower electric power input by experimental investigation. The following conclusions could be drawn based on the observations of the results.
By experimental measurements, it is found that the fuselage arm with a square cross-section has 2.41% higher lift-to-power ratios as compared to the one with a circular cross-section on condition that the weight of the arm or the perimeter of the cross-section is kept the same. In one of our previous simulation studies,
21
we also found that square fuselage arm could provide more lift force as compared to circular fuselage arm, but with the same cross-section area. Therefore, it is safe to conclude that the square fuselage arm has higher aerodynamic performance whether the constraint on cross-section perimeter or aera is applied. Starting from the square cross-section case (#2), the shape of the fuselage arm could be optimized to further promote the UAVs’ total aerodynamic performance by constraining the same arm weight (cross-section perimeter). An overall increase of 3.68% in the lift-to-power ratio is obtained with the proposed rhombus + 15°+arc2 arm (#5) as compared to the circular arm (#1). In optimizing the aerodynamic performance, two aspects should be kept in mind. The first one is to try to reduce the flow drag force to the arm by reducing the frontal area and setting up proper curved surfaces to reduce flow separation. The second aspect to consider is to take the propeller-arm relationship as a pair of rotor and stator or to regard the fuselage arm as a possible source of thrust force. Our practice shows that keeping the upper surface of arm flattened would help to generate more lift force.
Footnotes
Acknowledgements
This work was supported by the Natural Science Foundations of Shandong Province China under Grant ZR2021QG150 and Grant ZR2021QG061.
Funding
The authors disclosed receipt of the following financial support for the research, authorship, and/or publication of this article: This work was supported by the Natural Science Foundations of Shandong Province China, (grant number ZR2021QG061, ZR2021QG150).
Declaration of conflicting interests
The authors declared no potential conflicts of interest with respect to the research, authorship, and/or publication of this article.