
Abstract
Flexible wings, serving as the key components of tailless flapping wing micro air vehicles (FWMAVs), simultaneously generate lift, thrust, and control torques. Due to the complex unsteady fluid-structure interactions involved in their flapping, accurately predicting their aerodynamic performance, such as mean lift and lift-to-power efficiency, becomes challenging. There is also a lack of widely accepted and rational design methods for flexible wings. To address these, we propose an experimental optimization design method based on response surfaces methodology and investigate the impact of four design parameters—aspect ratio (
Introduction
Tailless FWMAVs, a category of micro air vehicles that mimic the flight of hummingbirds or insects, have emerged as a prominent research topic1–4 due to their significant advantages in flight performance, safety, and concealment compared to other micro air vehicles. Numerous teams have successfully developed prototypes of tailless FWMAVs.5–14 Flexible wings, serving as the crucial elements of tailless FWMAVs, simultaneously generate lift, thrust, and control torques. Designing high-performance flexible wings is essential for enhancing the capabilities of tailless FWMAVs.
When evaluating the aerodynamic performance of flexible wings, the mean lift generated by flexible wings and the ratio of mean lift to power consumed (also known as lift-to-power efficiency or power loading) are commonly used criteria, with higher values indicating superior performance. Despite well-defined design objectives, widely accepted design methods for flexible wings remain scarce, primarily because flexible wing flapping involves complex unsteady fluid-structure interactions, and their performance is influenced by various factors, such as shape, structure, material, and flapping motion profiles.6,14–28 The existing studies and optimization design methods for flexible wings, particularly simulation-based approaches, are challenging and computationally expensive, often restricted to 2D/3D homogeneous isotropic flexible wings19,21,29–34 and biological wings,35–37 which differ substantially from the actual flexible wings of FWMAVs. The common experimental optimization method, known as the “preferred method”, involves designing flexible wings for FWMAVs by fabricating numerous wings with various shapes, structures, or materials, testing their aerodynamic performance, and selecting the best-performing design.5–8,10,18,20,28 The “preferred method” is constrained by unclear theoretical guidance and high experimental costs, and may lead to conclusions that are not widely accepted. For instance, Keennon et al. 6 found that increasing the taper ratio (the ratio of the wing tip chord length to the wing root chord length) improves lift-power efficiency, making rectangular wings more favorable. In contrast, Nan et al. 16 concluded that the lift-to-power efficiency achieved with trapezoidal wings is superior to that with rectangular wings. Addo-Akoto et al. 22 determined that a simple wing-veined rectangular wing with a 5° slack angle (also known as camber angle) exhibits the best lift-to-power efficiency, while Yoon et al. 21 concluded that the optimal slack angle for maximum lift-to-power efficiency is approximately 15°. Furthermore, the majority of the aforementioned studies have concentrated on examining the impact of individual factors on the performance of the flexible wing while ignoring the coupling effects of these factors.
In response to these issues, we introduce an experimental optimization design method for flexible wings using the response surface methodology. This method establishes polynomial models to evaluate the performance of flexible wings influenced by four parameters (Section 2) and obtains optimal design results based on the model and the design constraints of tailless FWMAVs (Section 3). Furthermore, using the polynomial model (response surface model) derived during the optimal design process, we qualitatively analyze the effects of design parameters on flexible wing performance, considering the effects of individual design parameters as well as the coupling effects of multiple parameters (Section 3).
Experimental setup
Design of the response surface experiment
The flexible wing used in this study comprises a membrane, two straight veins, and two sleeves located respectively at the leading edge and the wing root (see Figure 1), resulting in a simple shape that is easily parameterized. The wing can rotate flexibly around both the leading edge and the wing root simultaneously. Additionally, the membrane has a slack angle (

The structure of flexible wings in this study.
The design of the flexible wing can be parameterized in the following manner. As illustrated in Figure 2, when the angle between the vein near the wing root and the chord line is fixed at 55°, the trapezoidal flexible wing can be defined by four parameters: wing length (

Geometric shape of trapezoidal flexible wings.
Utilizing above four parameters as optimization design variables, the response surface model to be established could be described as:

The optimization ranges of the four parameters need to be ascertained next. The range of the aspect ratio (

It should be noticed that the wing stiffness has a significant influence on the aerodynamic performance, particularly near resonant conditions.26,31,38 In our study, the flapping frequency is determined by the lift required and wing size, which is designed within 25–30 Hz and far from the resonant frequency of the flexible wings (when the flexible wing is regarded as a homogeneous cantilever beam, 39 its first-order natural frequency is approximately 90 Hz). Therefore, the wing stiffness is not considered as a design parameter in this study.
The experimental design for the response surface was carried out utilizing Design-Expert software (Stat-Ease Inc.). In this study, we developed response surface models based on cubic polynomials. The experiment comprised 3 blocks, with a total of 45 test points, corresponding to 45 pairs of flexible wings. Detailed information regarding these test points is provided in Tables S1 and S2 in the supplemental material.
Flexible wing
The membrane of the flexible wing (Figure 2) is polyimide film with a thickness of 25 μm, fabricated via laser cutting. The veins are carbon fiber composite cylindrical rods with a diameter of 0.3 mm, adhered to the membrane using adhesive. The method of fabricating sleeves at the leading edge and wing root is illustrated in Figure 3. The sleeves are used to mount the flexible wing on the flapping mechanism, facilitating the flexible wing flip smoothly at the end and start of each half stroke to enhance the mean lift.

Method of fabricating sleeves for flexible wings.
Flapping mechanism
As illustrated in Figure 4 (a), the flapping mechanism employed in the experiment consists of a combination of slider-crank mechanisms and two sets of four-bar mechanisms. Each of the four-link mechanisms features a driving rod connected to the rocker. This driving rod is inserted into the leading-edge sleeve of the flexible wing, facilitating its flapping motion. The theoretical movement of the driving rod approximates a sinusoidal pattern with a flapping amplitude (
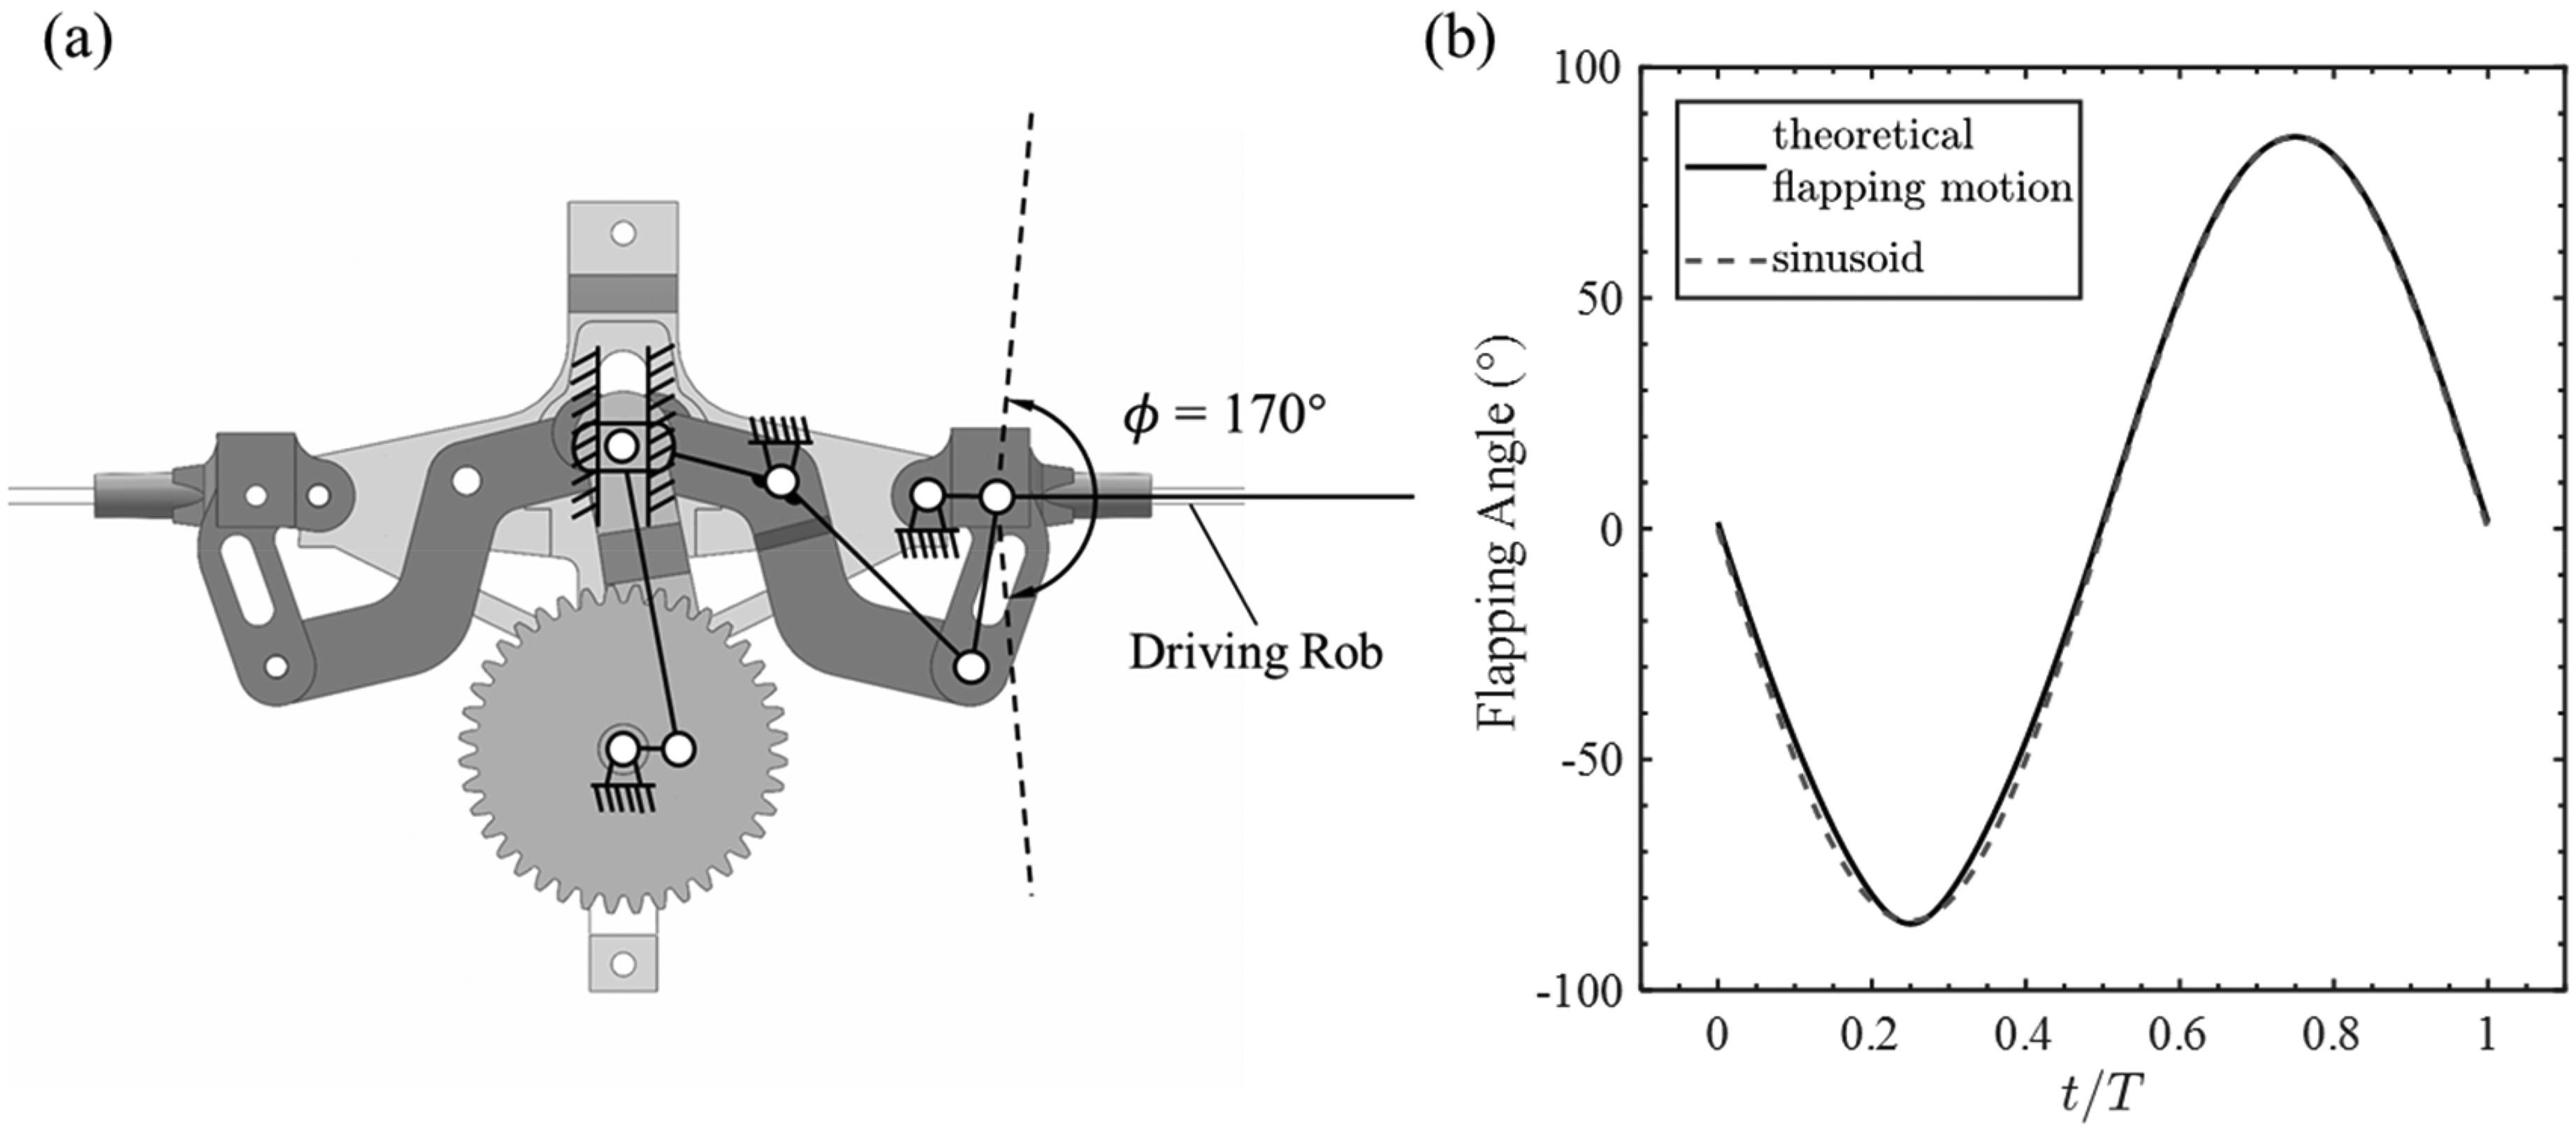
(a) Flapping mechanism and (b) its theoretical flapping motion.
Experimental setup and measurement methods
The measurement system employed in the experiment is illustrated in Figure 5. The experimental setup comprises a force transducer, a measuring amplifier, a current probe, an oscilloscope, a power supply, and a computer.

Components of the measurement system.
To measure the mean lift (
The lift-to-power efficiency (


The mean lift and lift-to-power efficiency for each test point were measured three times, and the average of these measurements was taken as the final result.
Results and discussion
Model and validation
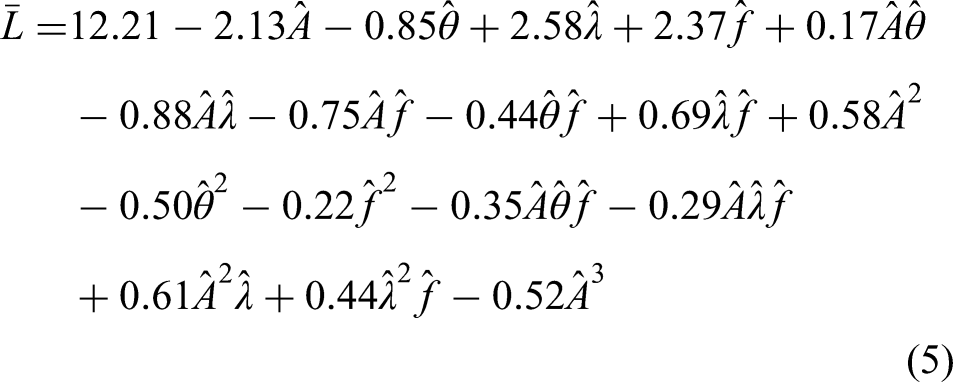
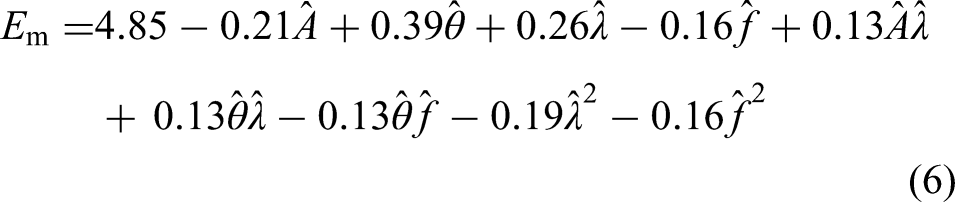
The experimental data were analyzed using Design-Expert software. After eliminating terms with p-values exceeding 0.1, we formulated response surface models for mean lift (
The analyses of variance (ANOVA) for the two models are presented in Table S3 and Table S4, respectively. The p-value for each item in the models is less than 0.1, indicating that both models are statistically significant. Figure S1 (a) and Figure S2 (a) present the normal probability plots of the residuals for the two models, respectively. The data points in the two plots are approximately linearly distributed, indicating that the two models satisfy the normality assumption of error. Figure S1 (b)-(d) and Figure S2 (b)-(d) show the residual plots for the two models, illustrating their behavior with the trial order, the fitted values, and the experimental blocks, respectively. None of these plots reveal a discernible pattern, indicating that both models satisfy the assumptions of independence and homogeneity of error. Figure 6 compares the measured values with the model-predicted values at each test point. It is evident that both models closely align with the experimental results, with the maximum relative error for the mean lift (

Plot of measured values versus model-predicted values, (a) lift model, (b) lift-to-power efficiency model.
Both experimental and theoretical methods were employed to validate the accuracy of the two models. For the experimental validation, four additional test points were chosen to assess the precision of both models. Among the four test points, one was particularly notable with the condition
Experimental validation results of the lift model and lift-to-power efficiency model.

The theoretical validation of the lift model was conducted by comparing the partial derivatives of the model (Equation (5)) with their corresponding theoretical expressions. Since both the response surface model and the theoretical model represent the mean lift, their partial derivatives should, in theory, be equal. We will begin by presenting the derivation of the theoretical expression. The mean lift (


The mean lift coefficient (

If Equation (11) is expressed in terms of the normalized parameters in Equation (2), then we obtain Equation (12), an approximate theoretical expression for the mean lift (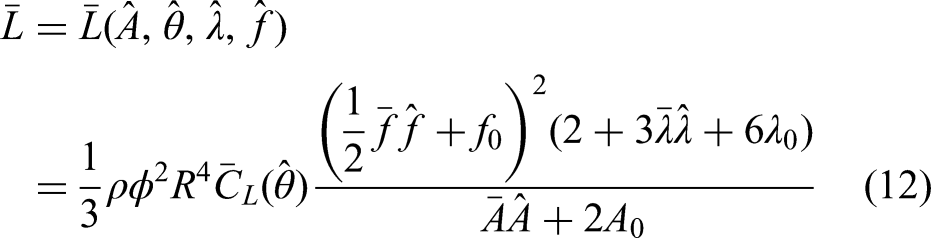
By substituting the mean lift of test point 1 (from Table 1) into Equation (12),

In contrast to the lift model, the lift-to-power efficiency model (Equation (6)) is difficult to validate using this method. This is because
Optimization design of flexible wings
As illustrated in Equations (5) and (6), the significant coupling effects present make it nearly impossible to obtain the optimal design for flexible wings by merely analyzing the variation of aerodynamic performance when one design parameter changes or by applying the frequently-used “preferred method”. However, once the response surface models of the flexible wing's aerodynamic performance are established, numerical methods can be employed to achieve optimal design results within given constraints.
If we choose maximum endurance as the design goal, the optimization design of flexible wings can be described as:
The numerical solution of Equation (13) was obtained from Design-Expert (assuming m =15 gf):
Predicted and measured values of the aerodynamic performance, as well as of the relative errors of optimized flexible wings.

Beyond aerodynamic performance, it is important to verify that flexible wings meet other requirements. For tailless Flexible Wing Micro Air Vehicles (FWMAVs), it is essential to ensure that the wing design complies with the control system's specifications. The verification is associated with the vehicle's control mode. For instance, Nano Hummingbird,
6
COLIBRI,
10
KUbeetle-S,
14
etc., alter the AoA during flapping by deflecting the wing root position to generate control moments. This control method is equivalent to changing the slack angle (
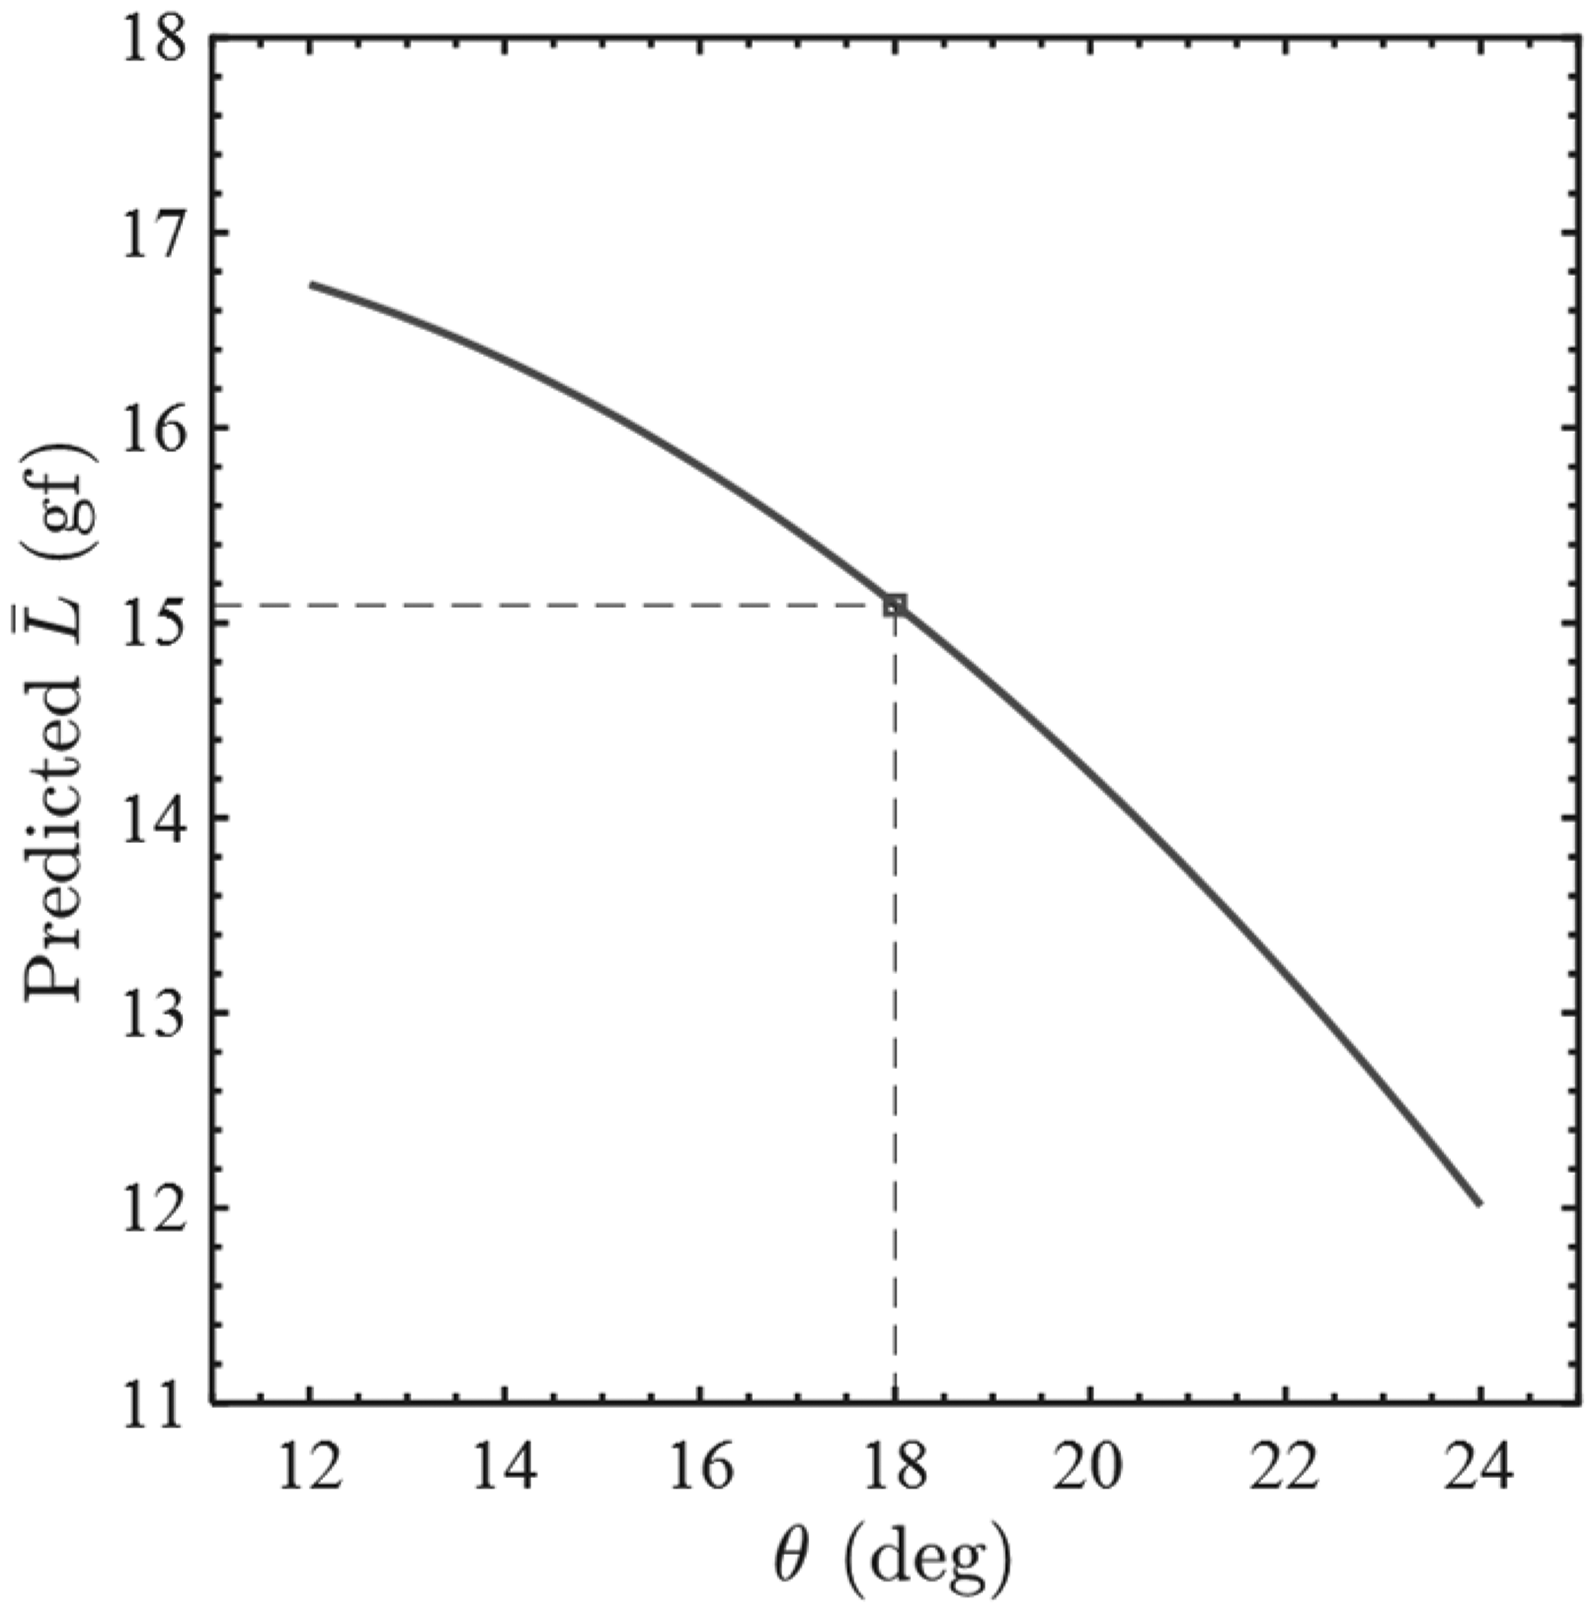
Changes in the mean lift (
If the design objective of a tailless FWMAV is altered (e.g., with maximum payload as the design objective), the design results will vary accordingly. The designer only needs to establish design constraints akin to Equation (13) based on the vehicle's operating state and requirements, and then obtain the optimized wing design results utilizing the models. Methods for determining design constraints are beyond the scope of this study and thus will not be further discussed.
Effects of design parameters on mean lift and lift-to-power efficiency in flexible wings
Effects of individual variable parameters on mean lift and lift-to-power efficiency
Before this section, for ease of discussion, we perform a simple transformation of equation (6) to obtain two approximate expressions of lift-to-power efficiency (
Mean drag (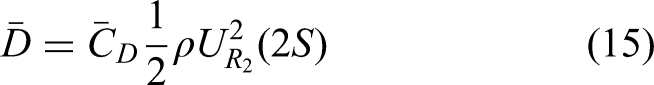

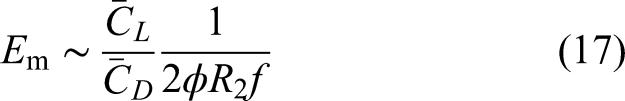
Figure 8 illustrates the effects of individual parameters on the mean lift (
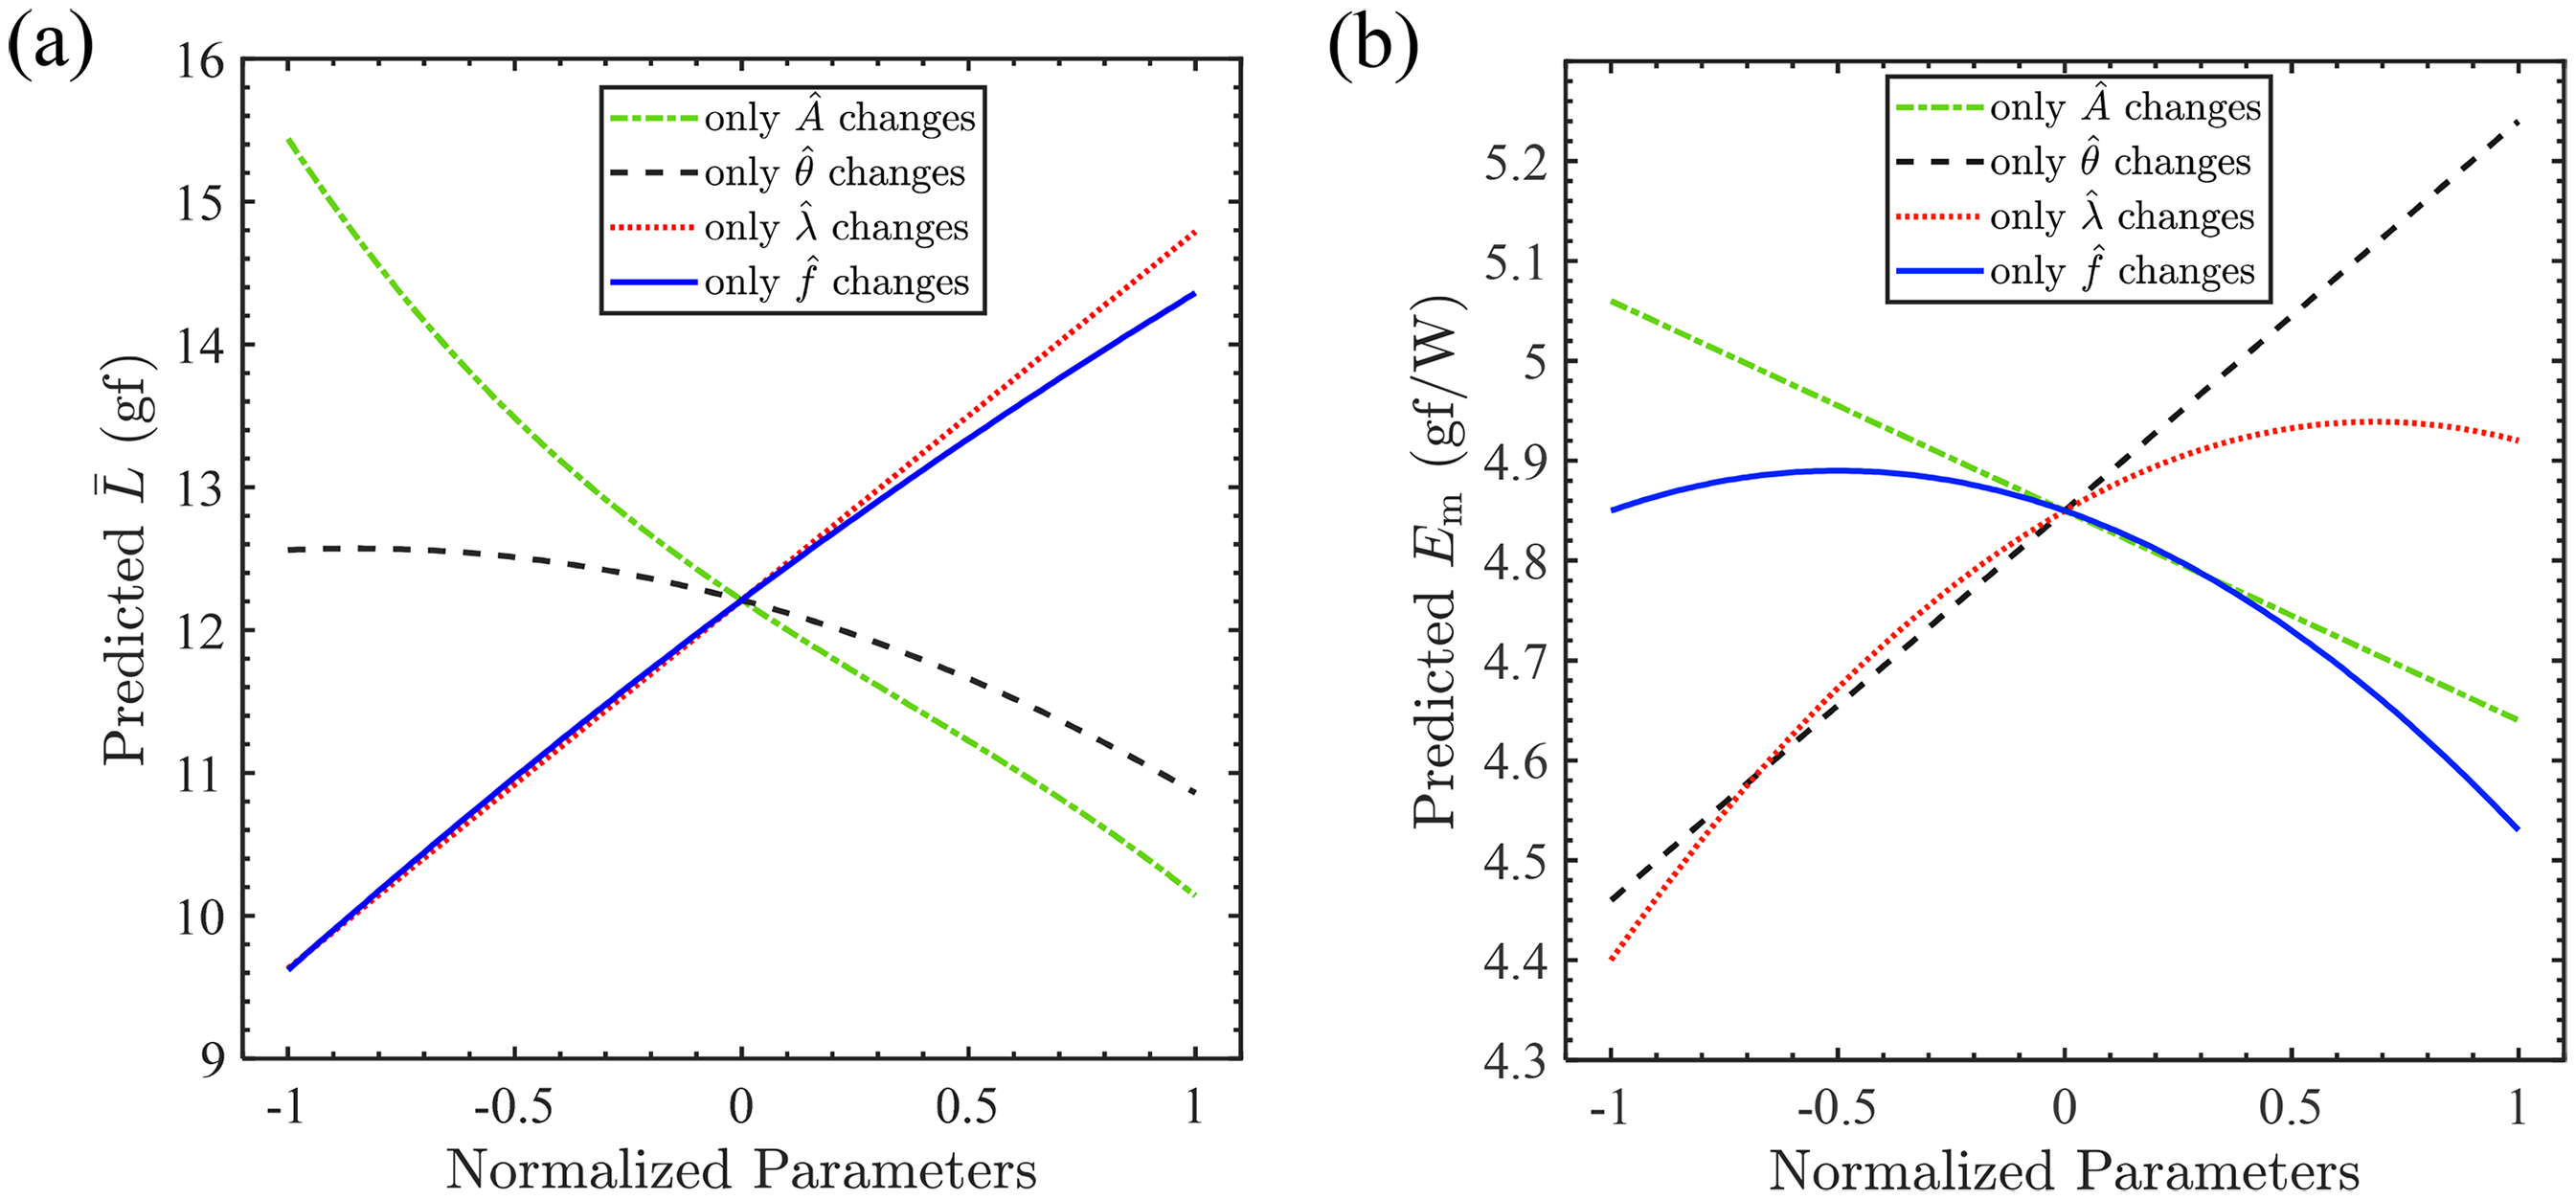
(a) Mean lift (
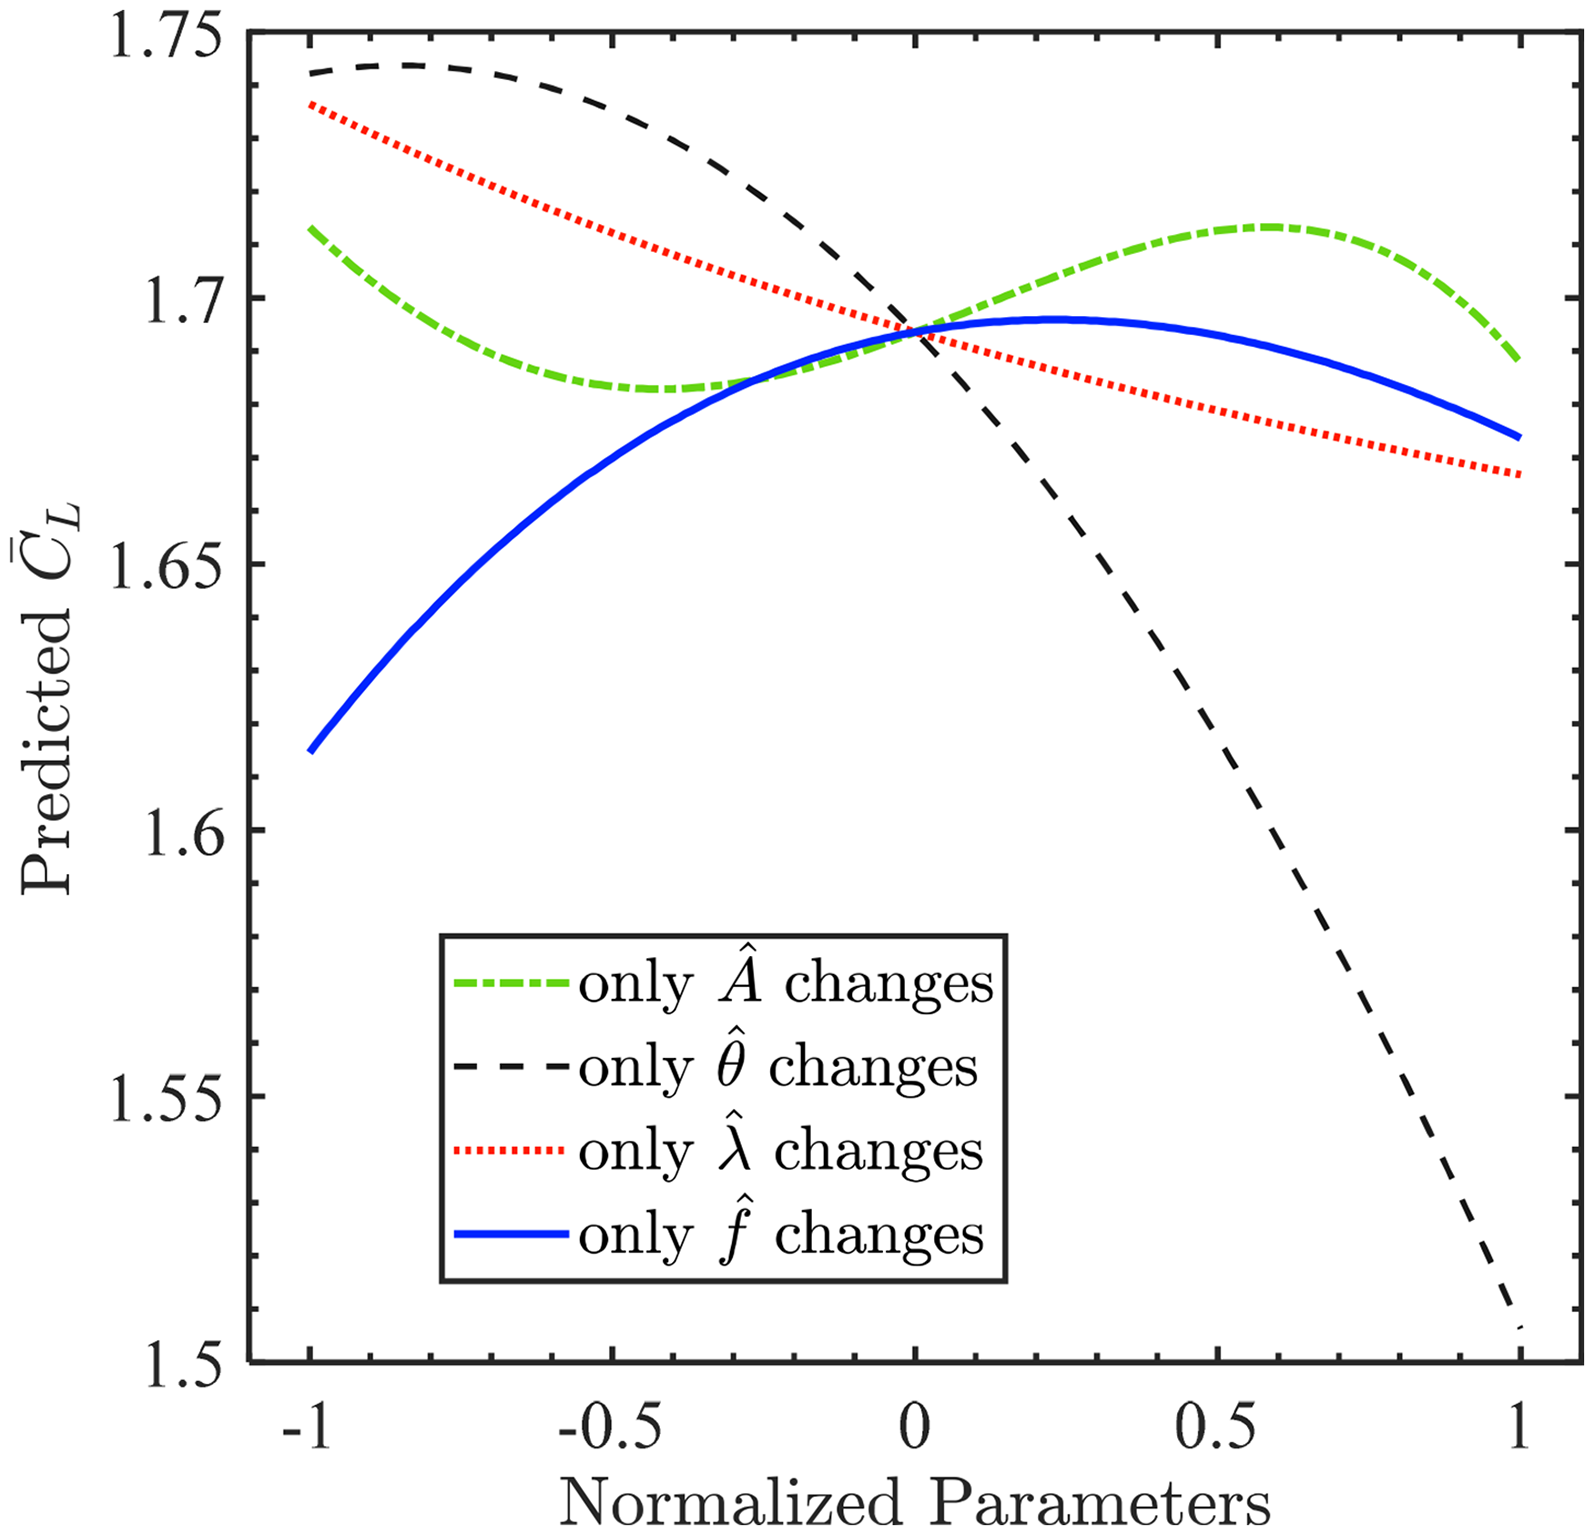
The mean lift coefficient (

The mean lift coefficient (
As the slake angle (
As the taper ratio (

Wing loading (
As the flapping frequency (
Overall, in the optimization space, when all other normalized parameters are set to zero, increasing the aspect ratio (
Coupling effects of two parameters on mean lift and lift-to-power efficiency
In Equation (5), it is evident that the absolute values of the coefficients of the terms
The four significant coupling effects on mean lift (

Coupling effect of (a, b) aspect ratio (
Owing to the wing's flexibility, the coupling effect of the slack angle (
Coupling effect of (a, b) aspect ratio (
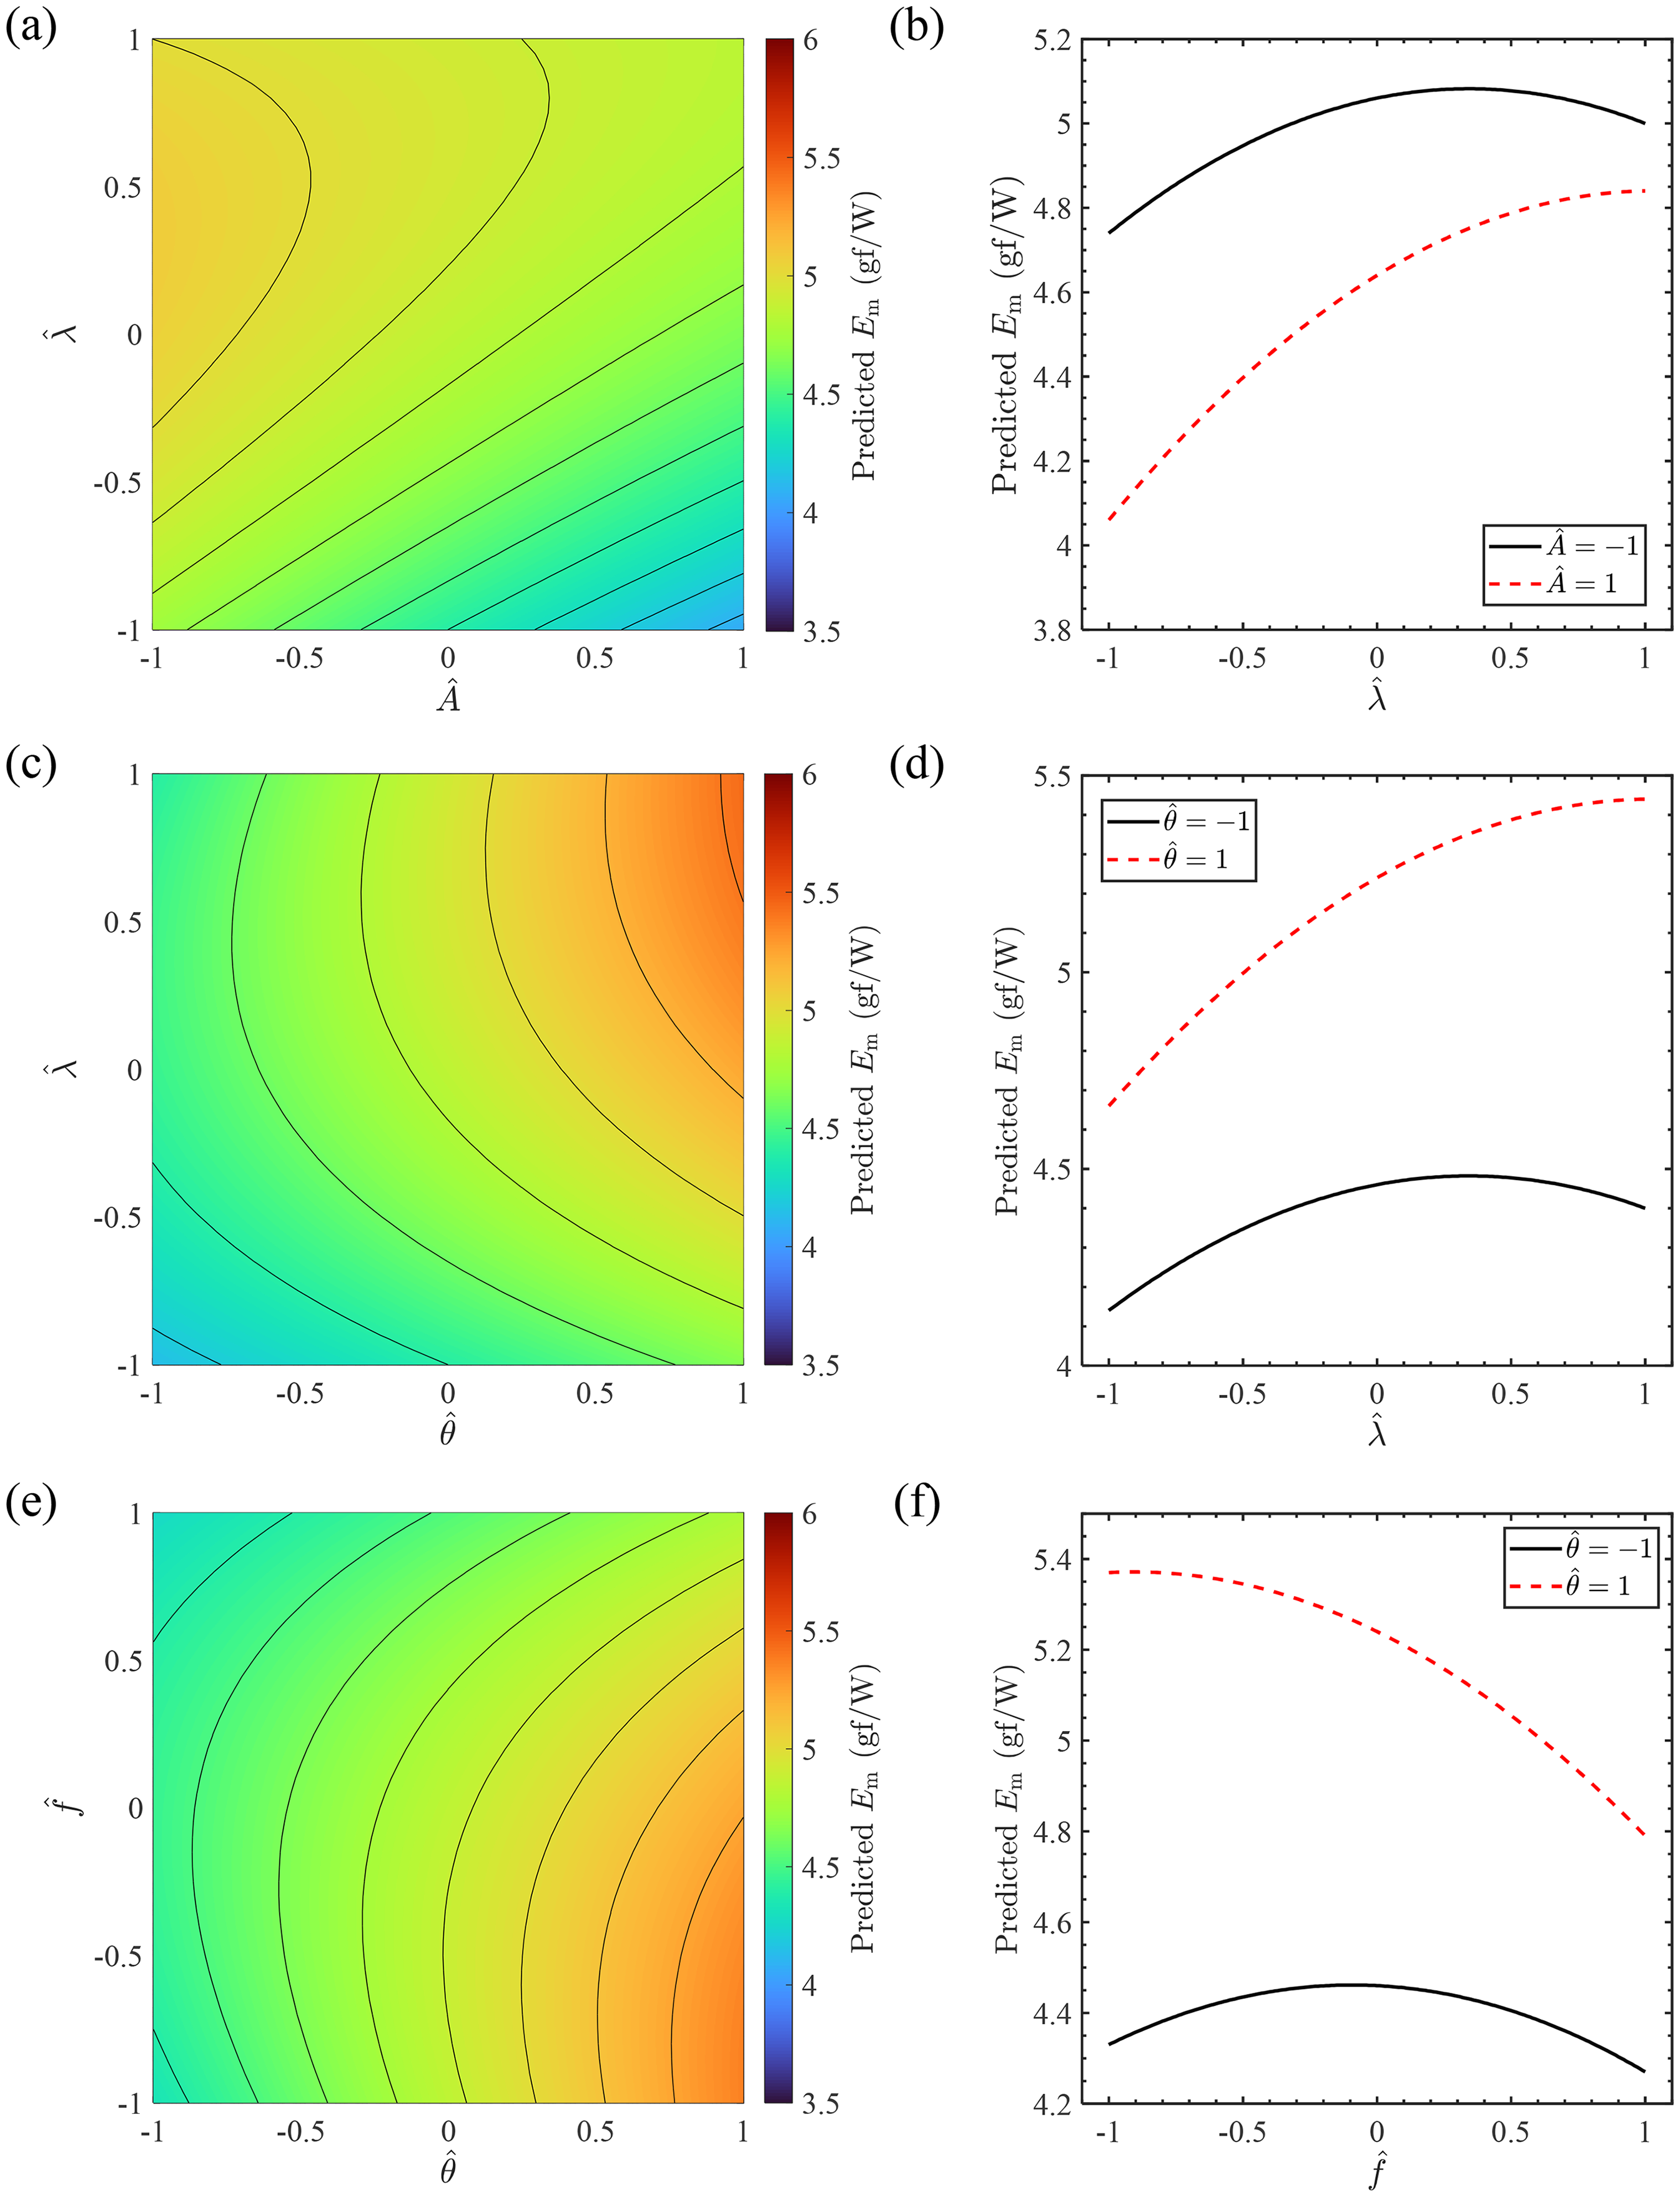
In Equation (6), the terms
The aforementioned three significant coupling effects on lift-to-power efficiency (
The coupling effect of slack angle (
The coupling effect of slack angle (
The coupling effects of
In summary, the interplay among these parameters significantly influences the aerodynamic performance of flexible wings. It may be impossible to acquire optimal design results by considering only the influence of individual parameters on the aerodynamic performance of flexible wings. Some coupling effects can be qualitatively explained by the negative torsional deformation of the wing, implying that the variations of the AoA induced by the deformation of the wings have significant effects on the aerodynamic performance.
Conclusion
As there is a lack of established flexible wing design methods for tailless FWMAVs, we proposed an experimental optimization wing design method based on the response surface methodology. In this method, the design parameters and optimization space are determined first. Then, the response surface models for predicting the aerodynamic performance of the flexible wing are obtained through experiments. Finally, according to the actual requirements of the vehicle, the design constraints are given and incorporated into the models, and the final optimal design results are obtained. We designed flexible wings using this method for a tailless FWMAV weighing 15 grams. The optimal design was validated through experiments to ensure it met the anticipated performance and requirements of the aircraft. Our proposed design method addresses the problem of achieving optimal design due to the complex interactions between parameters. The response surface models generated during the optimization process accurately predict the mean lift and lift-to-power efficiency of the flexible wings within the optimization space, with a maximum prediction error of under 10% when compared to experimental.
We discussed the effects of four parameters—aspect ratio, slack angle, taper ratio, and flapping frequency—on the aerodynamic performance of flexible wings based on response surface models. We found that the individual changes of these four parameters have significant effects on the aerodynamic performance of the flexible wing, and their effects are almost equally important. In addition, the coupling effects between these four parameters, especially in pairs, are also significant. These coupling effects explain the opposite influence laws of the same parameter in different past studies. At the same time, our study also shows that it is difficult to achieve the optimal design of the flexible wing when these coupling effects are ignored.
Compared with the “preferred method”, the experimental optimization design method based on the response surface methodology not only provides explicit theoretical guidance for flexible wing design but also yields the optimal solution under the design space and constraints. Furthermore, this method requires less time to predict the performance of flexible wings compared to numerical simulation. Additionally, this method can be applied not only to optimize aerodynamic performance but also to enhance the design of wing structures and reduce flapping noise in flexible wings. This approach provides substantial support for the design of FWMAVs.
Supplemental Material
sj-docx-1-mav-10.1177_17568293251348206 - Supplemental material for Experimental study on the aerodynamic optimization design of flexible wings for tailless flapping wing micro air vehicles
Supplemental material, sj-docx-1-mav-10.1177_17568293251348206 for Experimental study on the aerodynamic optimization design of flexible wings for tailless flapping wing micro air vehicles by Jianghao Wu, Shijie Sheng, Ziming Liu, Jin Cui, Chenyang Wang, Long Chen and Yanlai Zhang in International Journal of Micro Air Vehicles
Footnotes
Funding
The author(s) disclosed receipt of the following financial support for the research, authorship, and/or publication of this article: This work was supported by the National Natural Science Foundation of China, (grant number 12472231).
Declaration of conflicting interests
The author(s) declared no potential conflicts of interest with respect to the research, authorship, and/or publication of this article.
Supplemental material
Supplemental material for this article is available online.
References
Supplementary Material
Please find the following supplemental material available below.
For Open Access articles published under a Creative Commons License, all supplemental material carries the same license as the article it is associated with.
For non-Open Access articles published, all supplemental material carries a non-exclusive license, and permission requests for re-use of supplemental material or any part of supplemental material shall be sent directly to the copyright owner as specified in the copyright notice associated with the article.